Debugger Tutorials
Summary:
This article covers the Analysis of a multi-stage AgentTesla loader. The loader utilizes a Nullsoft package to drop an exe-based loader and multiple encrypted files. We'll follow the loader as it locates and decrypts the encrypted files, ultimately resulting in Shellcode which deploys AgentTesla malware.
Topics Covered:
- Initial Analysis of Nullsoft File
- Extraction of exe and encrypted files.
- Static Analysis of exe using Ghidra.
- Static Analysis of Shellcode Using Ghidra
- Identification of Stack Strings
- Identification of API hashing
- X32dbg for Decoding Individual hashed APIs
- x32dbg for Decoding API Hashes in Bulk
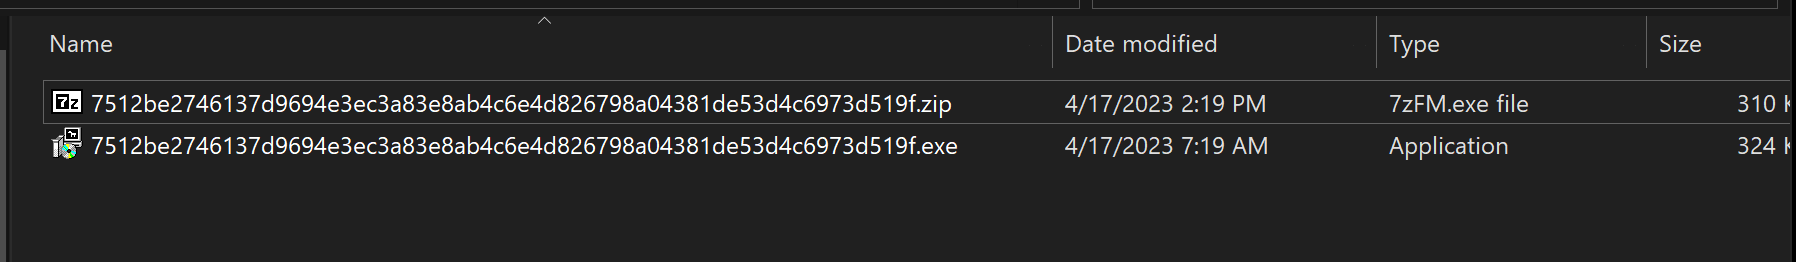
Sha256: 7512be2746137d9694e3ec3a83e8ab4c6e4d826798a04381de53d4c6973d519f
Link: https://bazaar.abuse.ch/sample/7512be2746137d9694e3ec3a83e8ab4c6e4d826798a04381de53d4c6973d519f/
Primary Analysis
After unpacking the initial .zip pw:infected - An .exe is obtained.
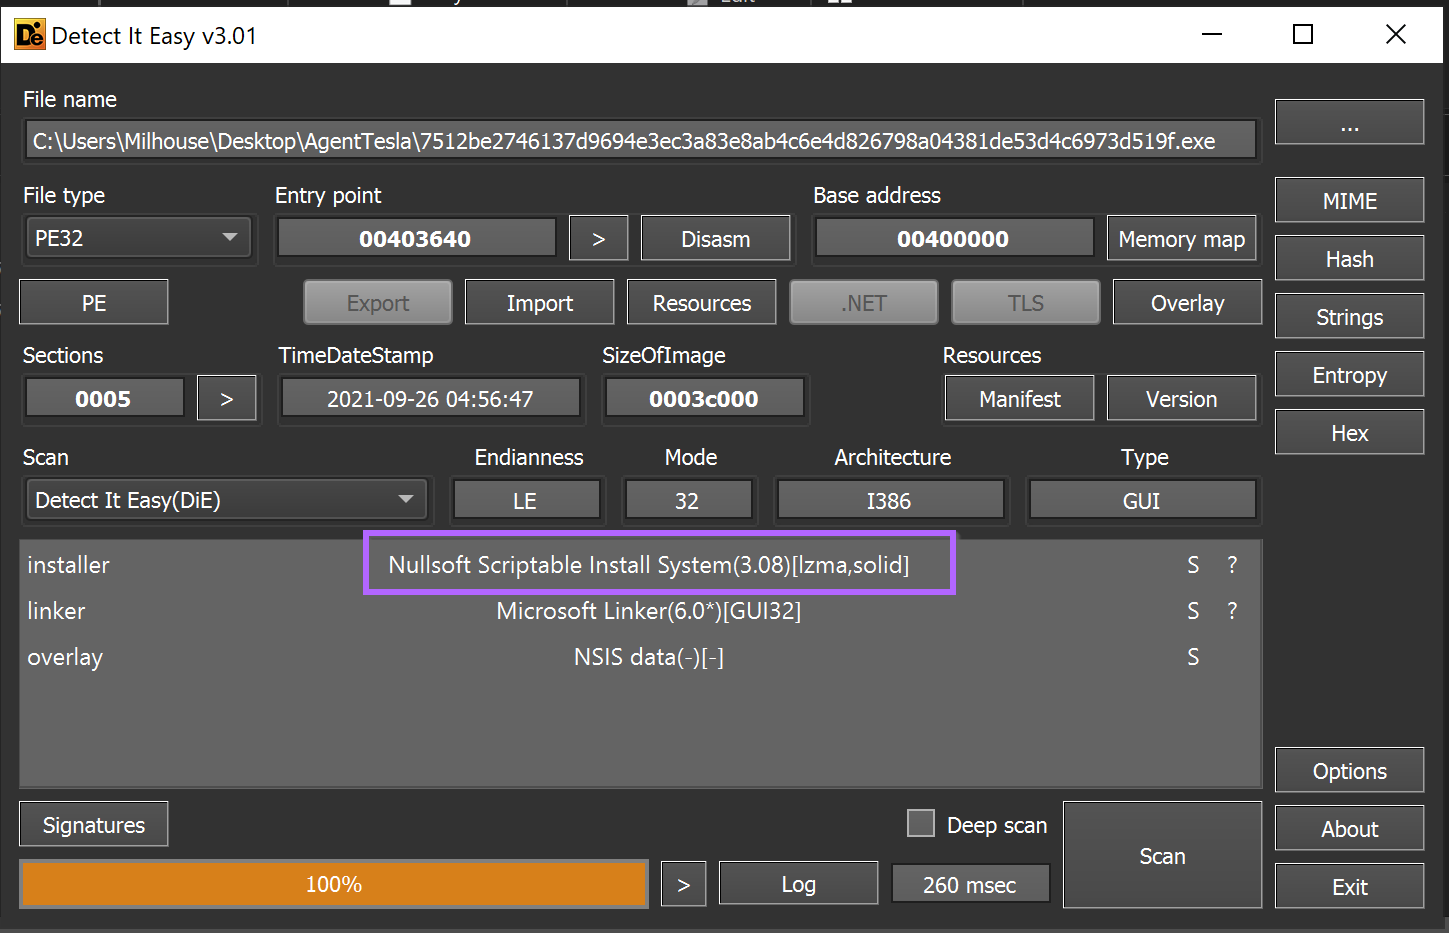
Using detect-it-easy, we can determine the file is packaged using the Nullsoft Scriptable Install System.
My initial approach with any scriptable installer is to attempt to unzip the file. This is because most exe-based installer scripts are just a zip file with a small exe stub that unzips and executes the files.
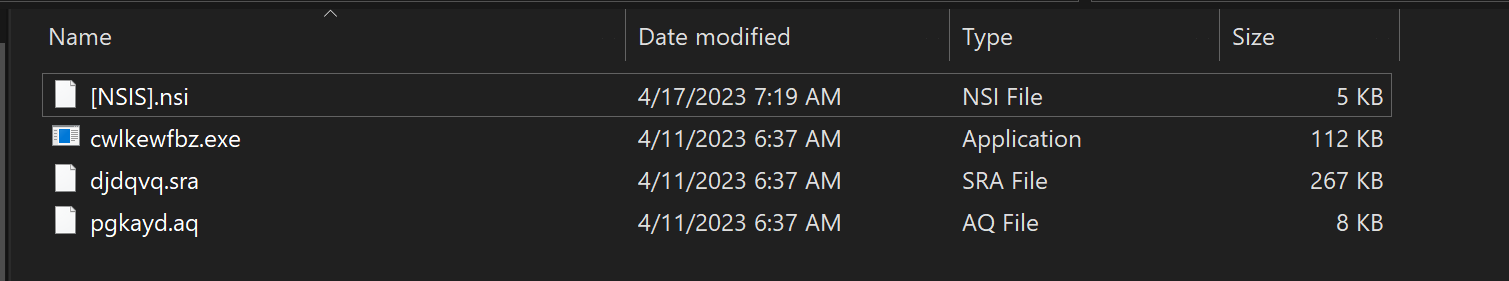
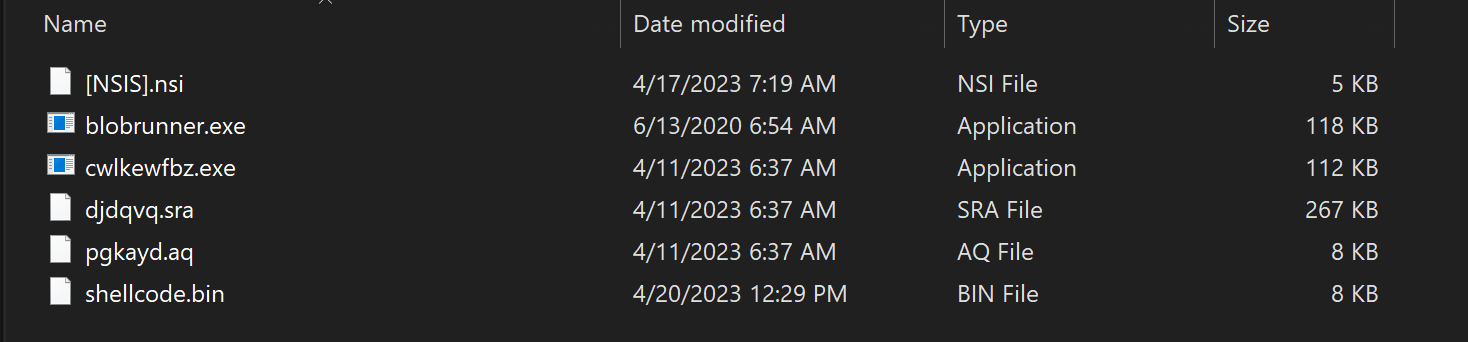
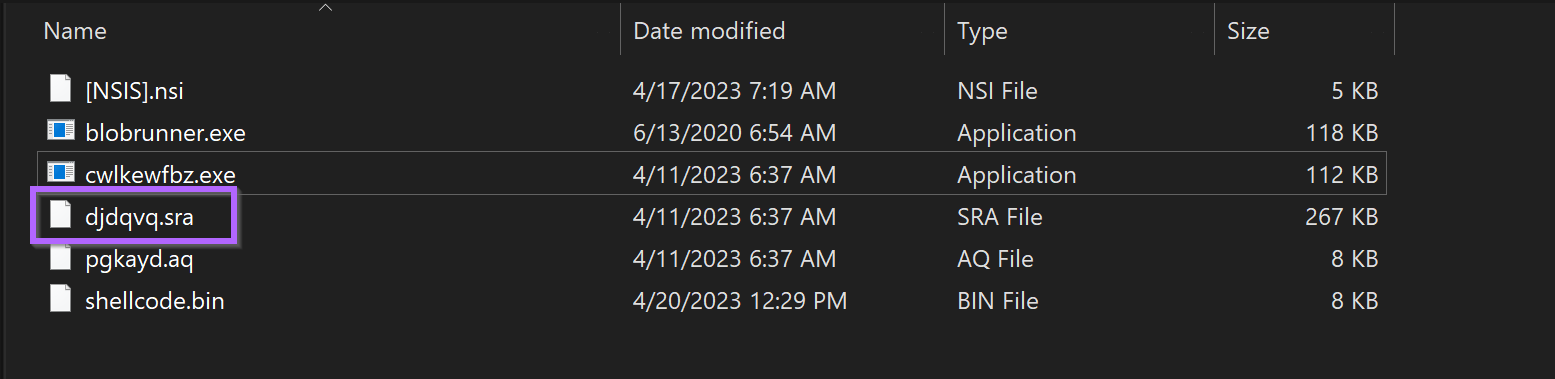
Unzipping the folder using 7-zip reveals four files. Including a randomly named cwlkewfbz.exe and a Nullsoft Script .nsi.
My initial assumption here was that the .nsiscript would execute the cwlkewfbz.exe file, so I decided to look into the script to see if this was true.
I assumed the script would be text-based and viewable with a text editor. So I used Notepad++ to view it.
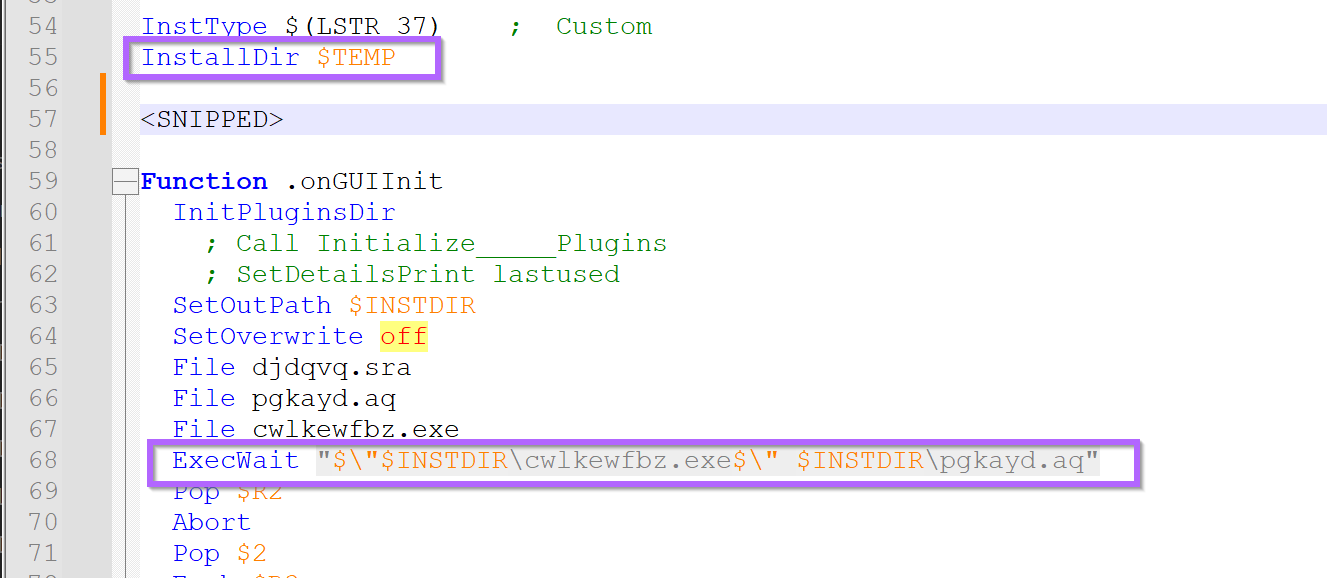
The initial parts (below) look like junk - but after a short scroll to line, a potential execution path and parameters of cwlkewfbz.exe can be observed.
It appears (lines 55,68) the cwlkewfbz.exe is intended to execute from the users %TEMP% folder with pgkayd.aq file as a parameter.
This was interesting information and implied that the malware requires two "pieces" in order to function. In situations like this, generally the .exe is a loader, and the real malware is contained in an encrypted file passed as a parameter (in this case the pgkayd.aq)
A review of the pgkayd.aq file using detect-it-easy revealed no recognized file formats, but the overall entropy was high. This suggested that pgkayd.aq might be encrypted or obfuscated.
If a strong encryption was used, then the entropy would be flat and generally higher (usually around 7.9 for good encryption). This suggested a low-effort 0r low-quality encryption may be used.
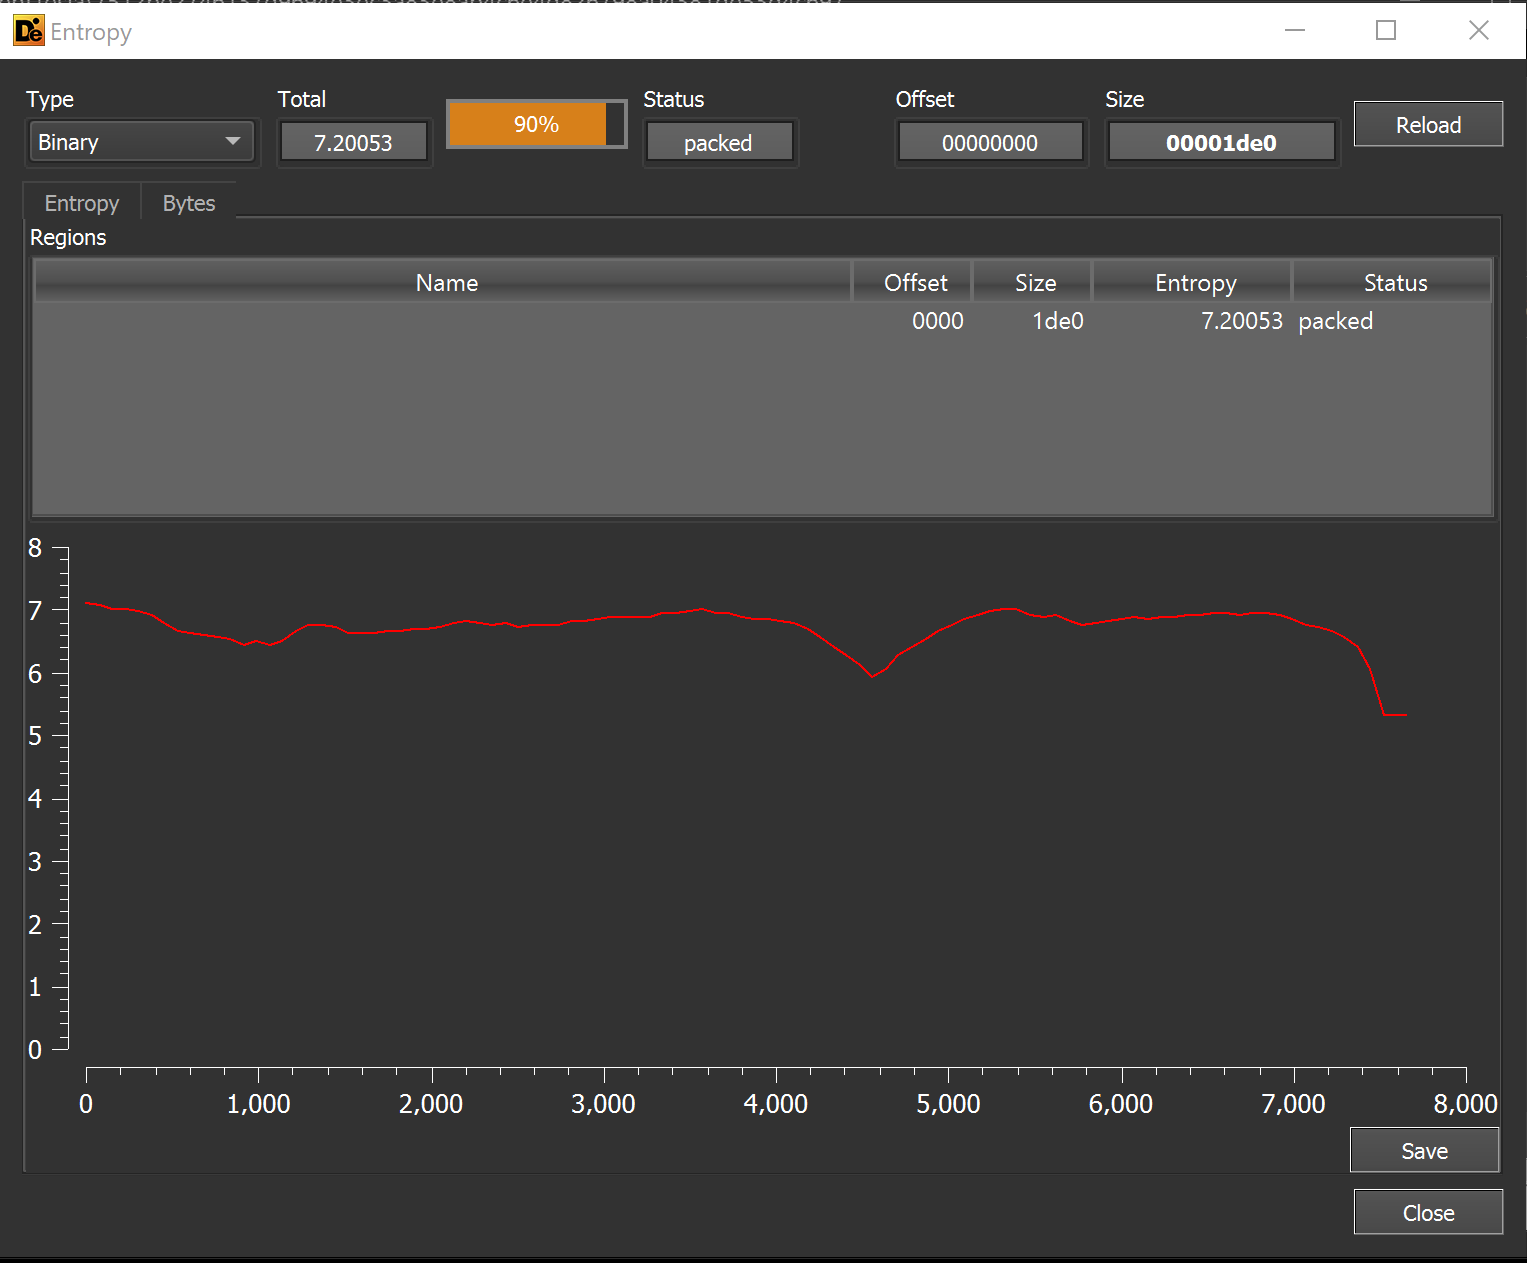
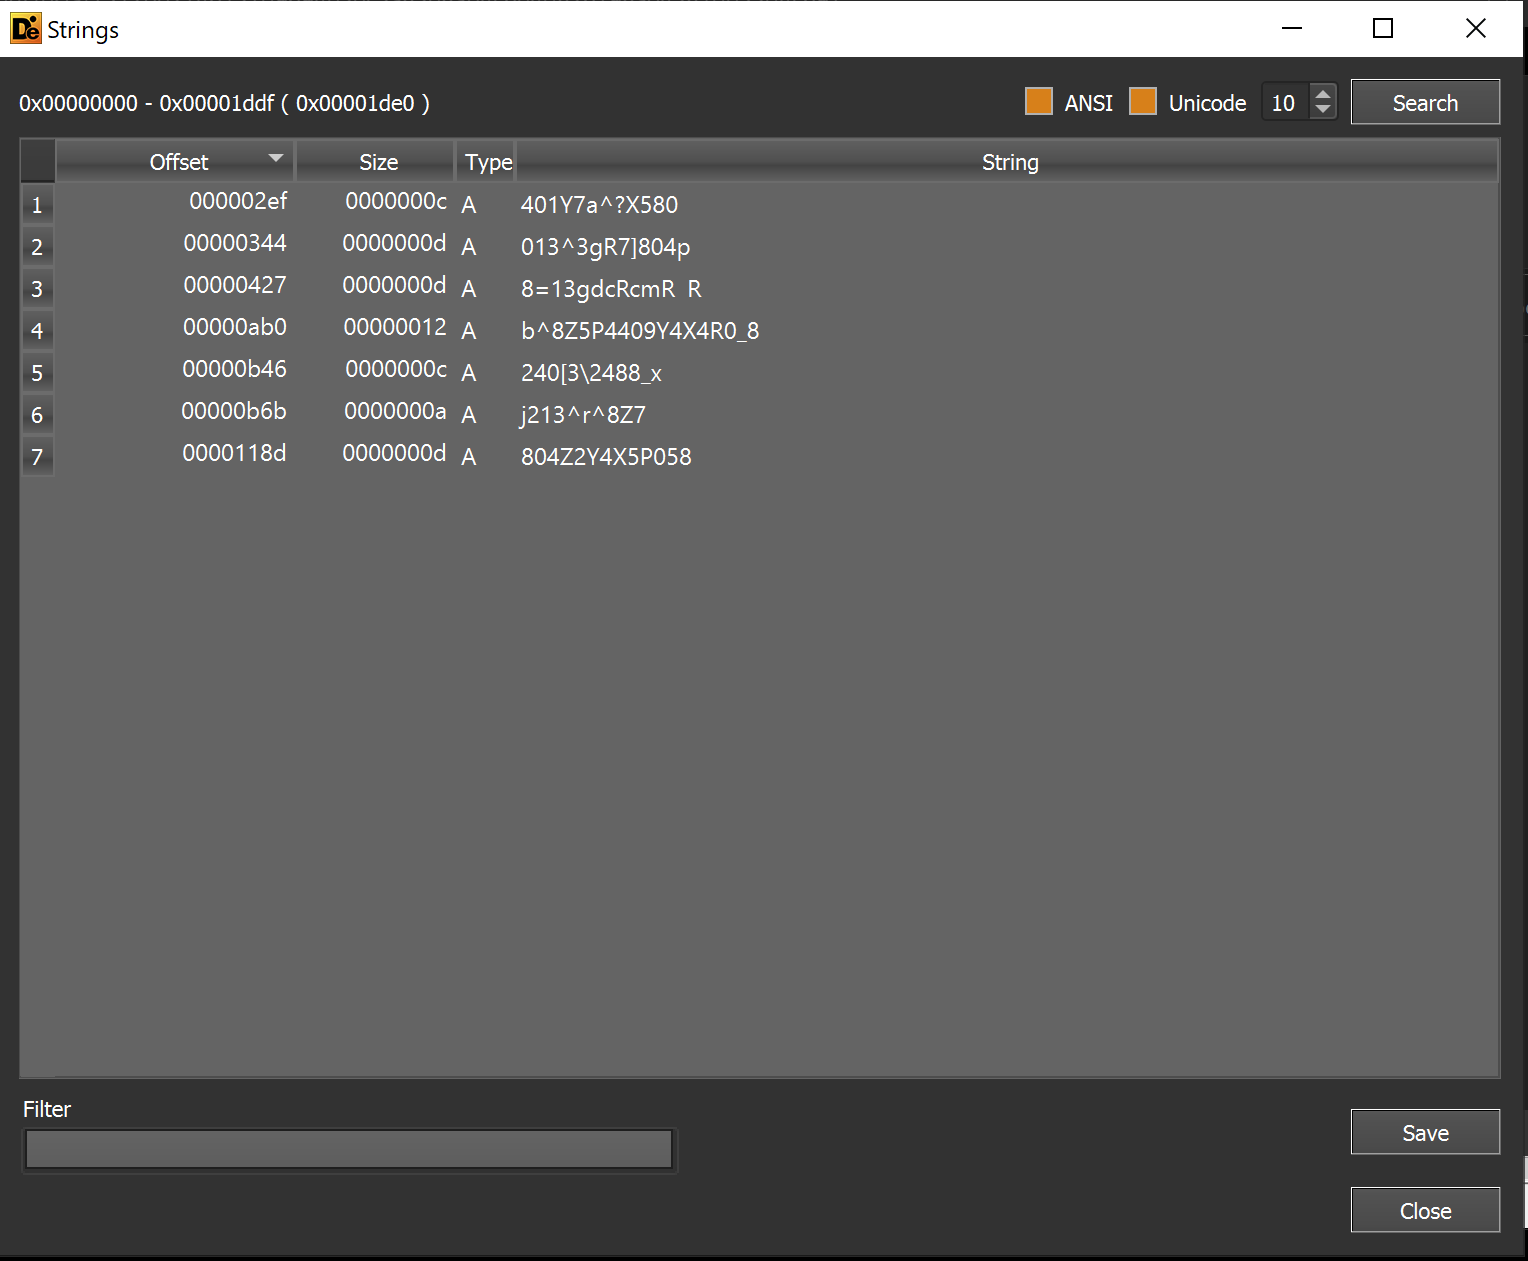
I reviewed the file for any plaintext strings that may indicate its purpose. But this revealed only seven strings. None of which were helpful.
Reviewing the other djdqvq.sra file within the folder, an extremely high (and flat) entropy is observed.
The high and flat entropy strongly suggests that djdqvq.sra is encrypted.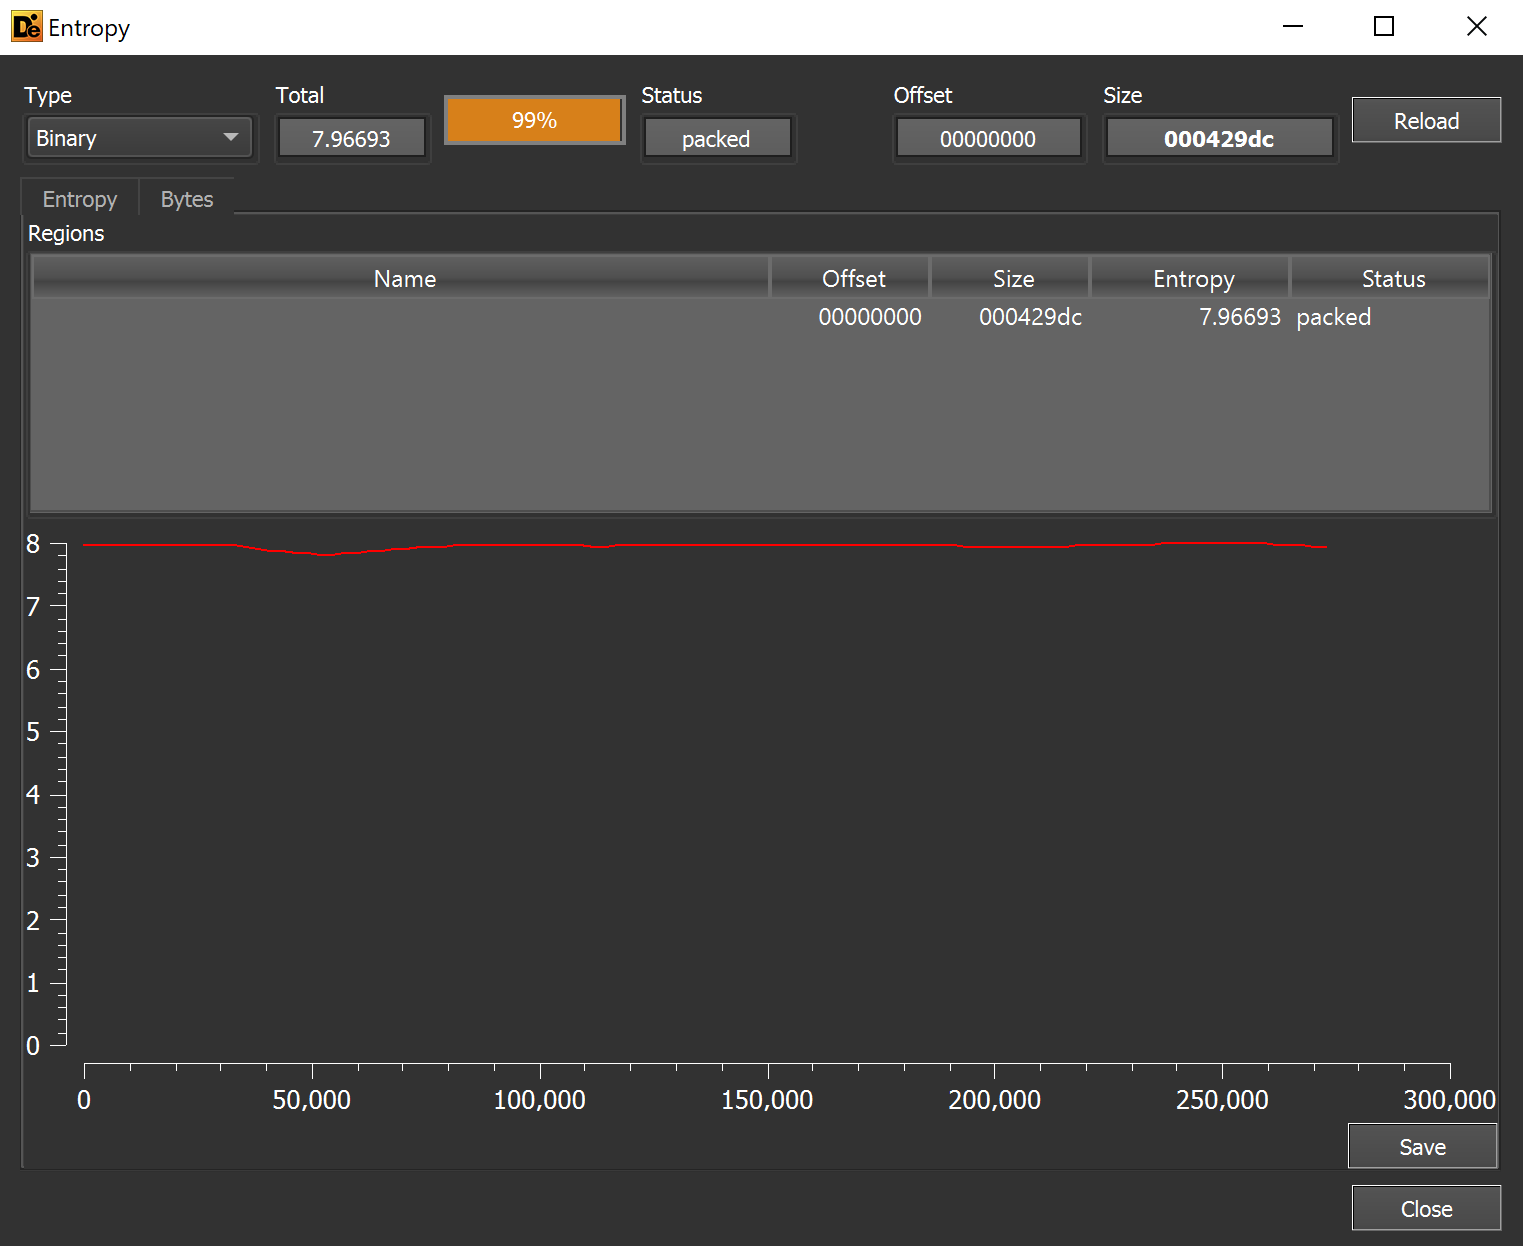
Back to cwlkewfbz.exe
After a review of the djdqvq.sra and pgkayd.aq files revealed they were likely encrypted. I returned to the cwlkewfbz.exe file.
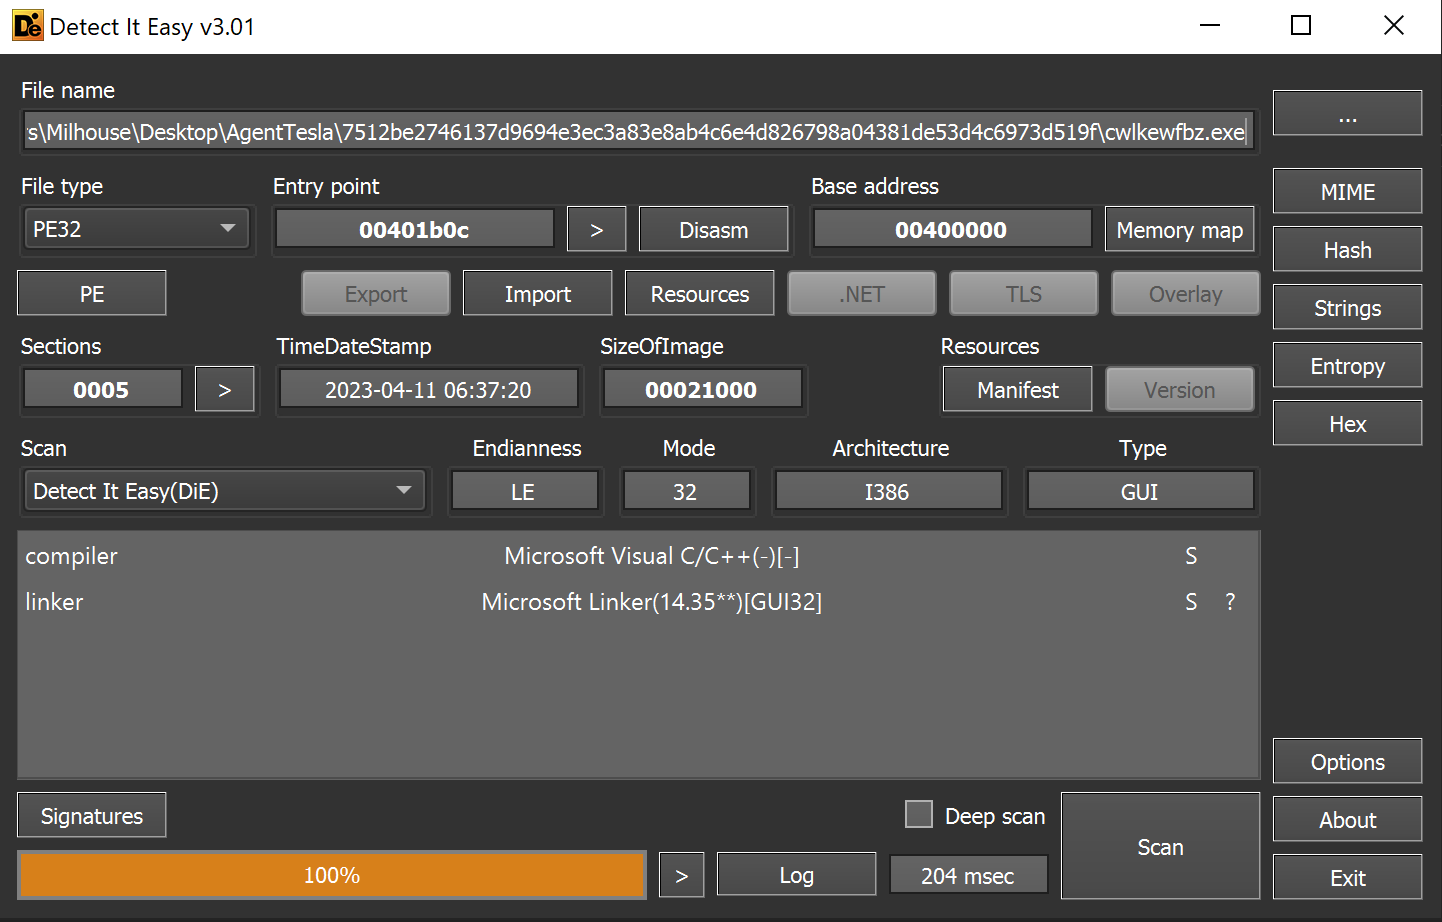
This reveals a C/C++ file with no significant areas of entropy.
The lack of high entropy areas suggests that the file does not contain any embedded encrypted content.
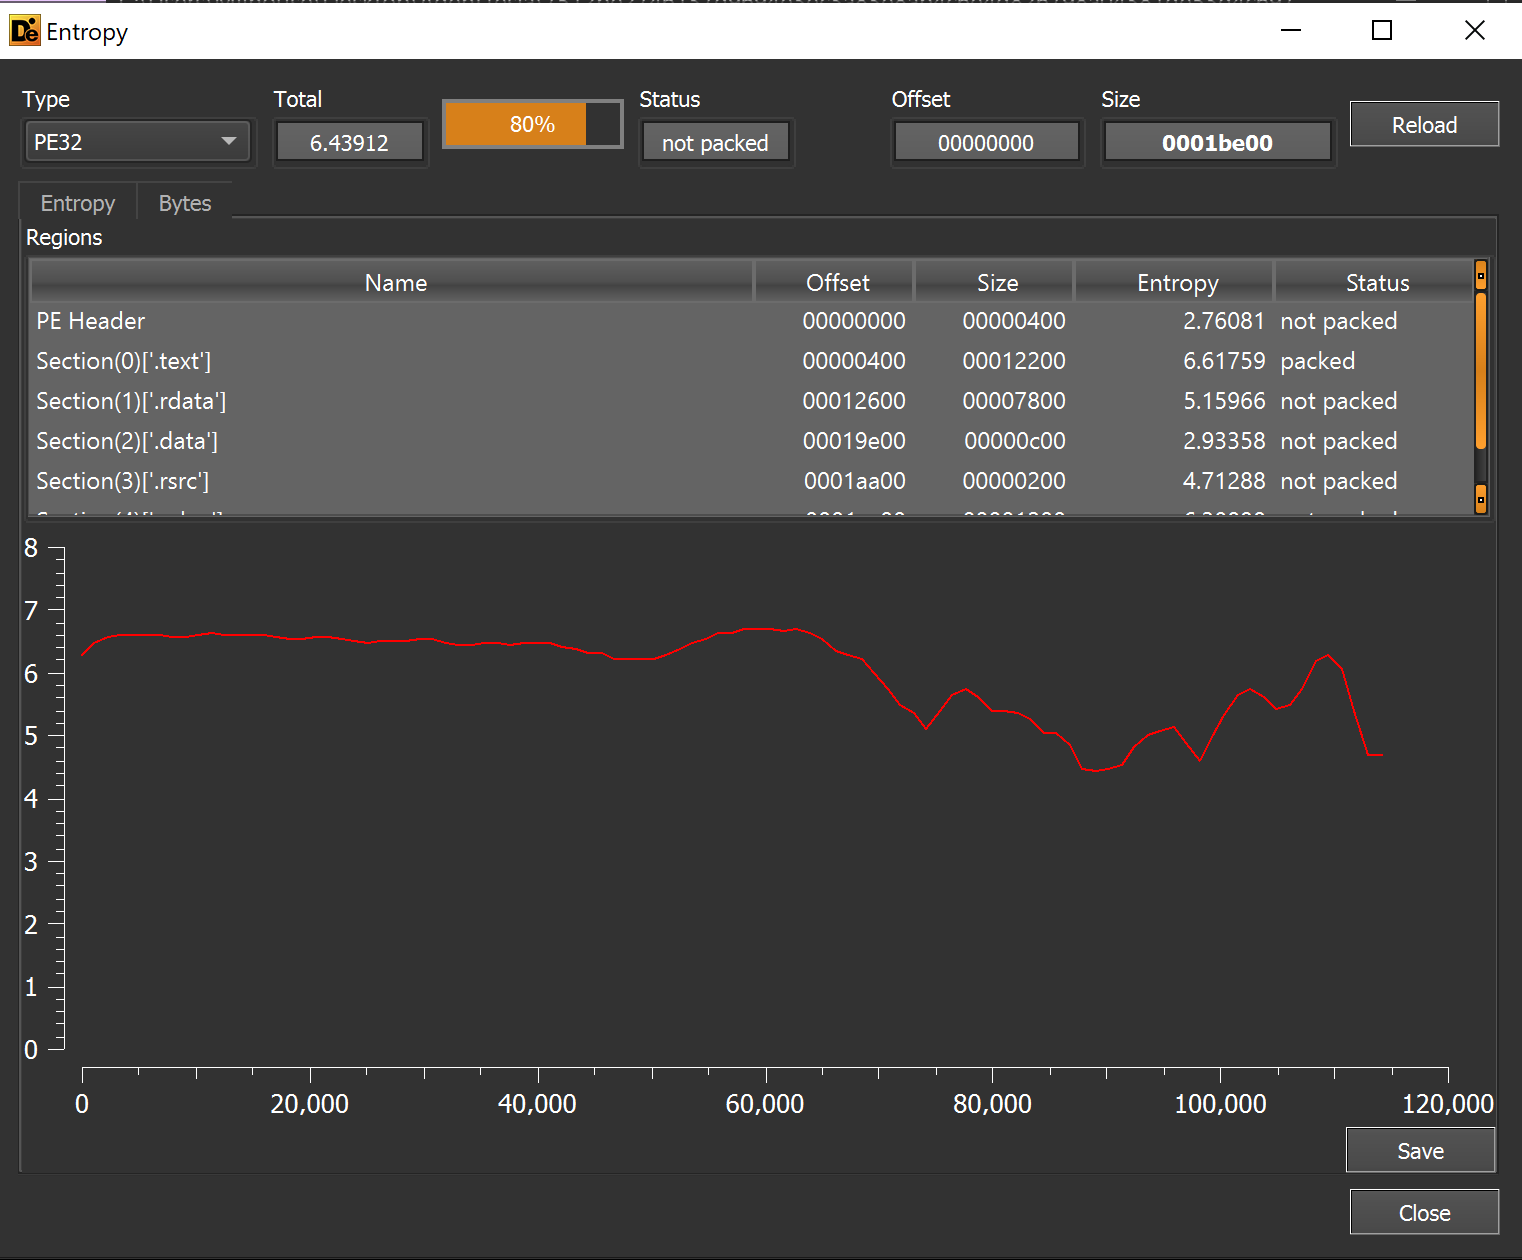
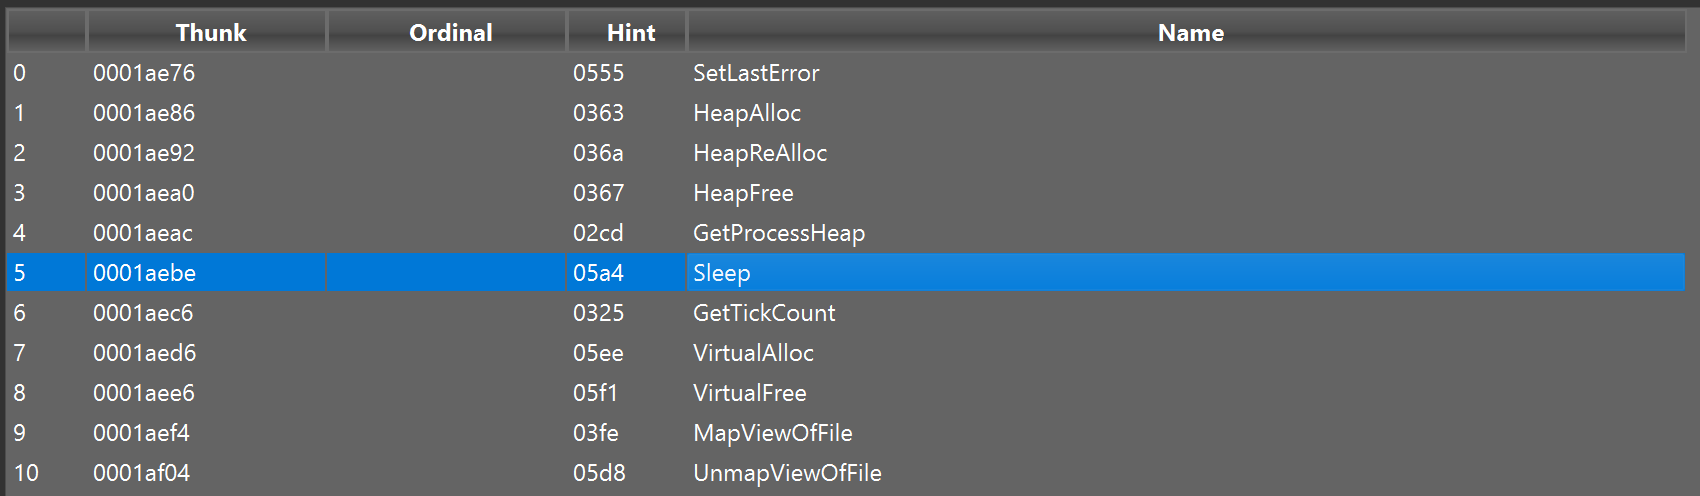
Reviewing the imported functions reveals the usage of VirtualAlloc . This is a valuable function/API that we can later set a breakpoint on to extract information about allocated memory.
Although VirtualAlloc has legitimate uses and is not malicious on its own - it also a common API used by malware to allocate new memory regions. The purpose of these regions is often to store decrypted payloads and additional stages of malware.
Lastly, I used detect-it-easy to perform a string search on cwlkewfbz.exe. I had hoped that there might be strings that could indicate the purpose or origin of the Malware.
Sadly, the string search did not determine anything interesting, just a bunch of Windows and C++ library shenanigans.
Analyzing cwlkewfbz.exe - x32dbg
I decided to move beyond basic analysis. My approach Analysisse x32dbg to monitor the previously noted usage of VirtualAlloc
I hoped that this might reveal an additional payload or decrypted content.
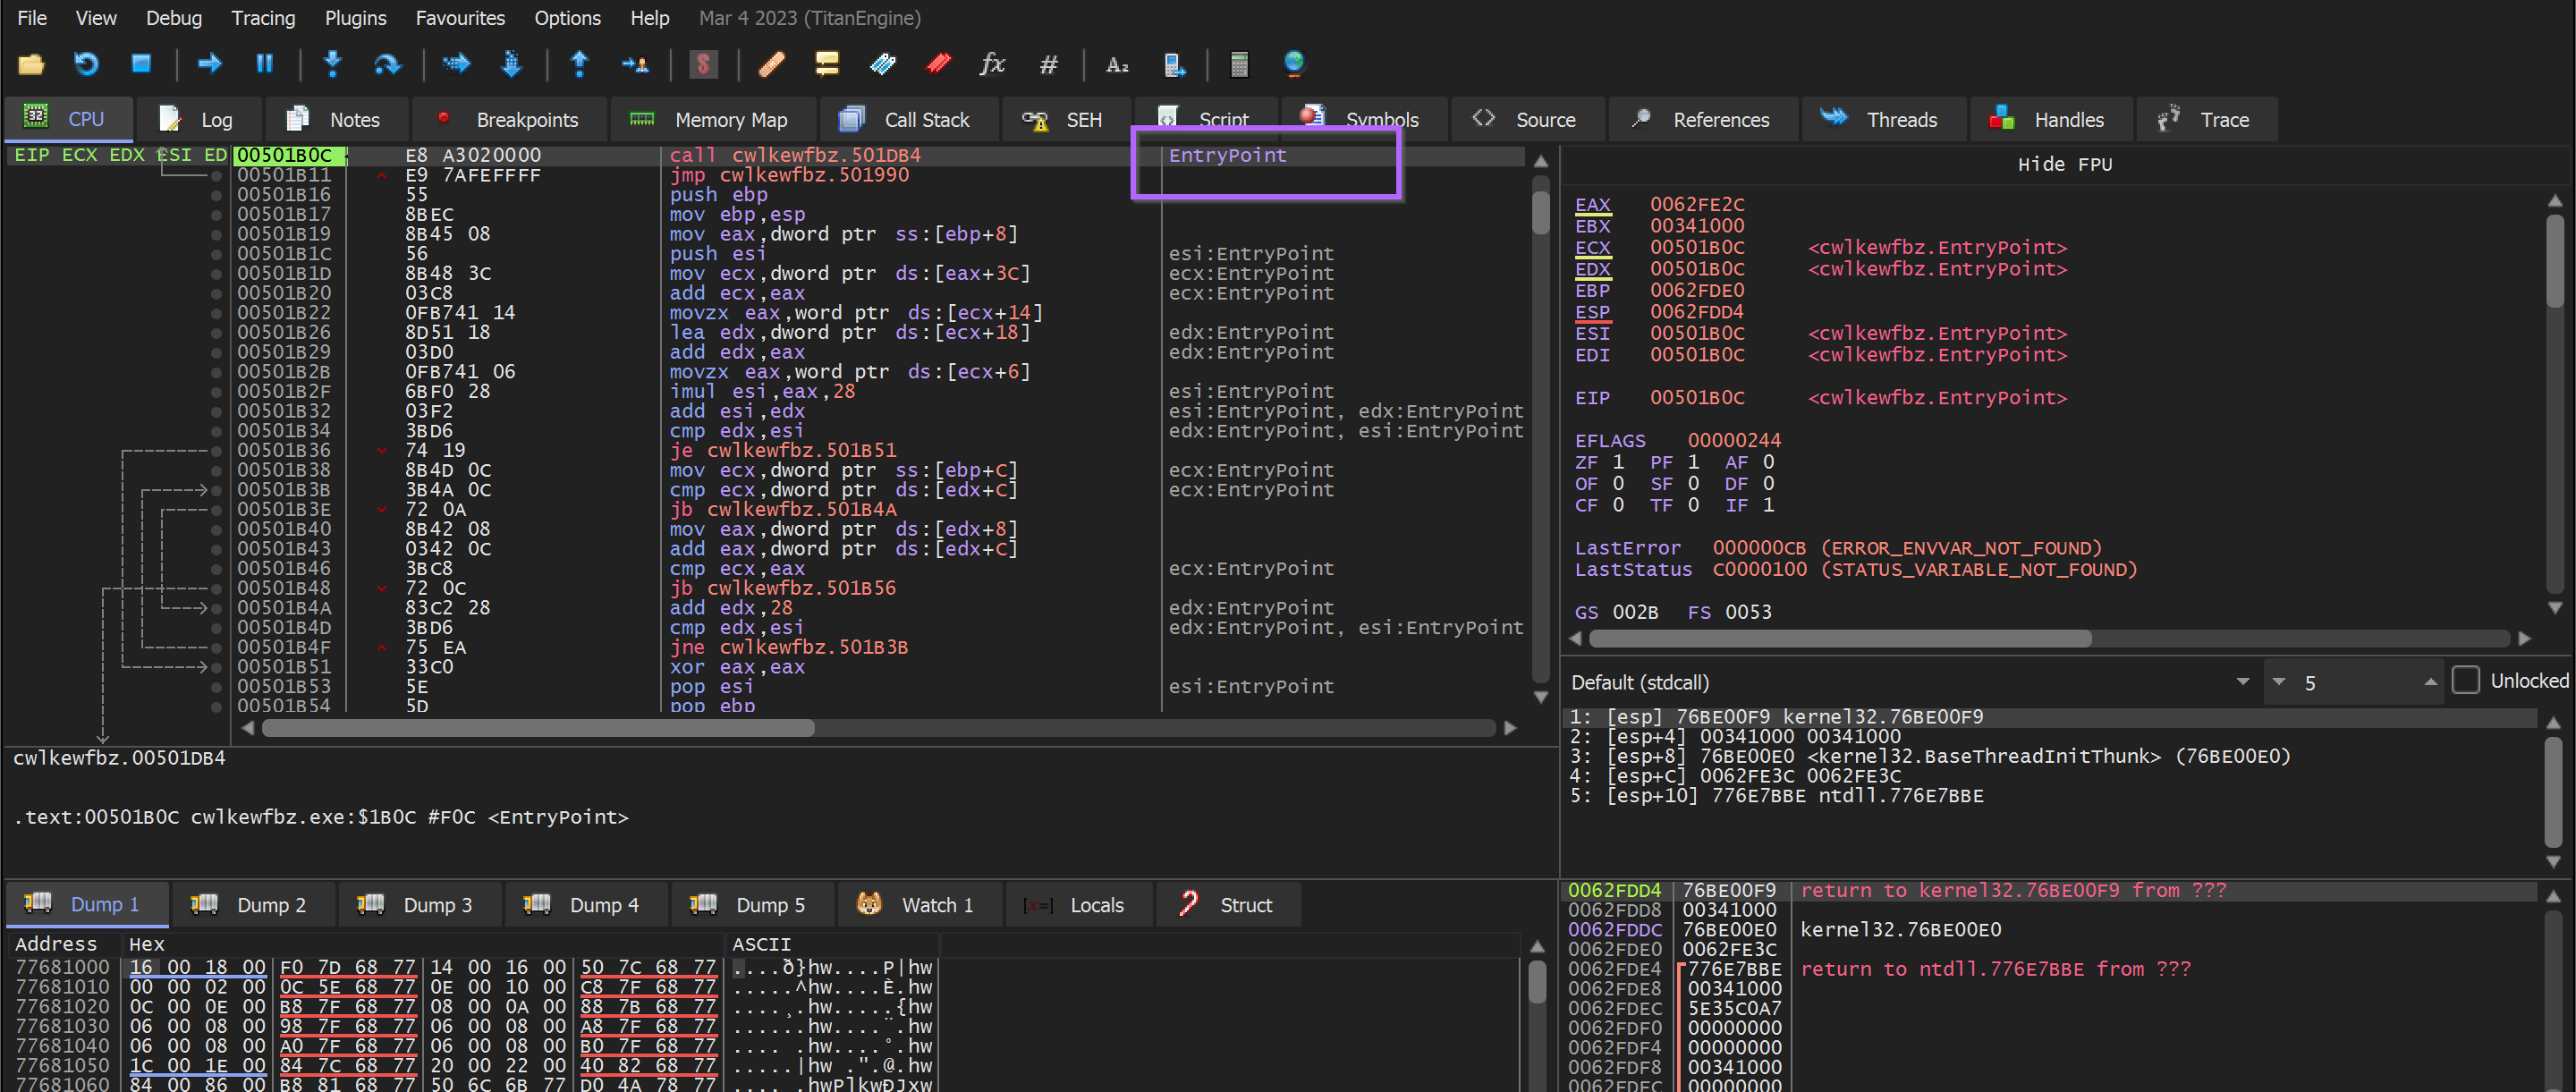
I opened the cwlkewfbz.exe file in x32dbg and allowed it to execute until the initial entry point.
I then created a breakpoint on VirtualAlloc with bp VirtualAlloc
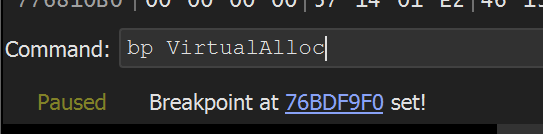
I allowed the Malware to continue to execute.
However - the VirtualAlloc breakpoint was never hit and the process was immediately terminated.
Since the breakpoint on VirtualAlloc was never triggered; I knew something must have happened between the entry point and the Malware’s initial call to VirtualAlloc.
There are a few ways that this could be investigated
- Exit Breakpoint - Can be used to view the function that triggered the process termination,
- Ghidra - To locate paths to VirtualAlloc and diagnose any potential issues, anti-debugging or similar.
Static Analysis Using Ghidra
After the initial breakpoint failed, I used Ghidra to gather more information about paths to VirtualAlloc.
Since the breakpoint was not being hit at all - I wanted to use Ghidra to investigate any paths between the EntryPoint and VirtualAlloc.
There are two main features that I'll use to achieve this
Cross References (x-refs) - To see where a given resource (function, API, string, etc) is used within a program. (Essentially a ctrl+F for binary files)
Function Tree - A graphical representation of cross-references. Allows you to see which function calls a given resource and which function calls that function. And so on. Quite literally, a "tree" of function calls that enables you to visualize paths of execution.
Using cross-references - I would be able to find out where VirtualAlloc is called within the program.
Using the Function Tree - This would allow me to view the path taken to get to VirtualAlloc and potentially identify reasons why VirtualAlloc is not being triggered.
How to use cross-references in Ghidra
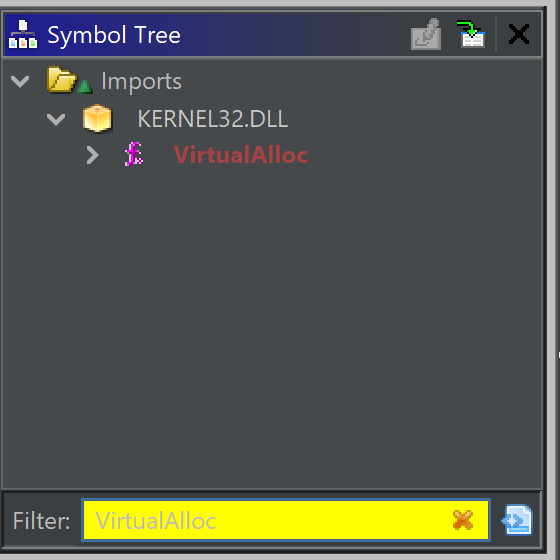
To locate cross references to VirtualAlloc - I first located VirtualAlloc within the Symbol tree of Ghidra.
Symbol Tree → Imports → Kernel32.DLL → VirtualAlloc
(You could browse through the symbols manually or use the filter to speed things up)
I then accessed cross-references by right-clicking on the VirtualAlloc symbol and selecting. Show References to.
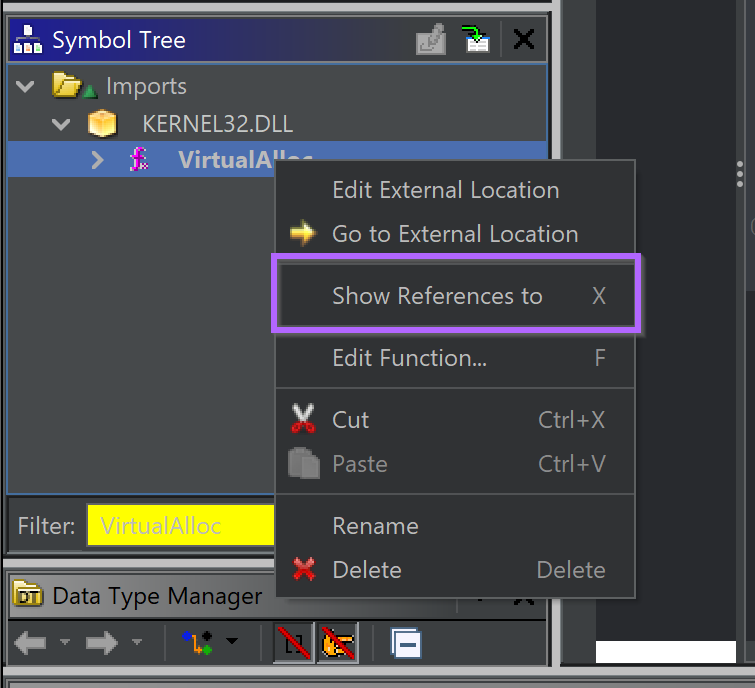
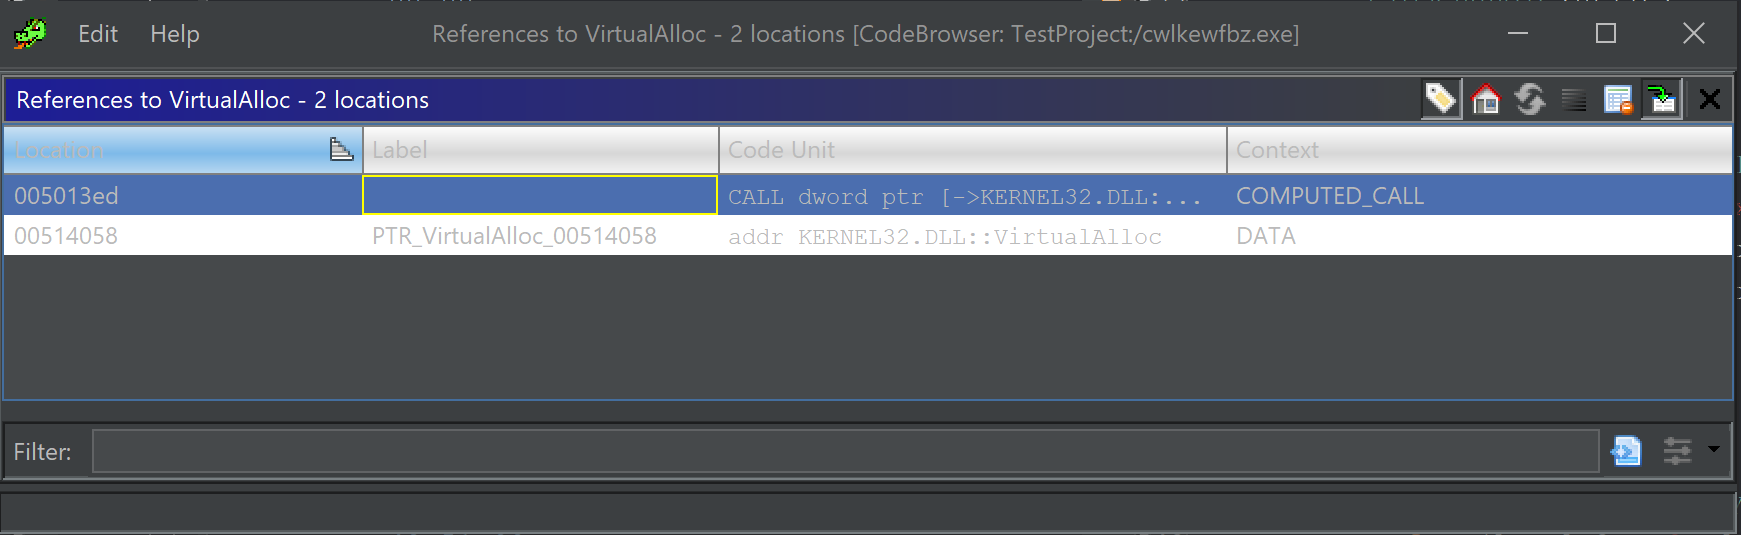
This revealed the cross references. With only one function that calls VirtualAlloc - I clicked on this function to view its contents and establish context around the VirtualAlloc call.
(The context/data reference can be ignored, this is not a function call)
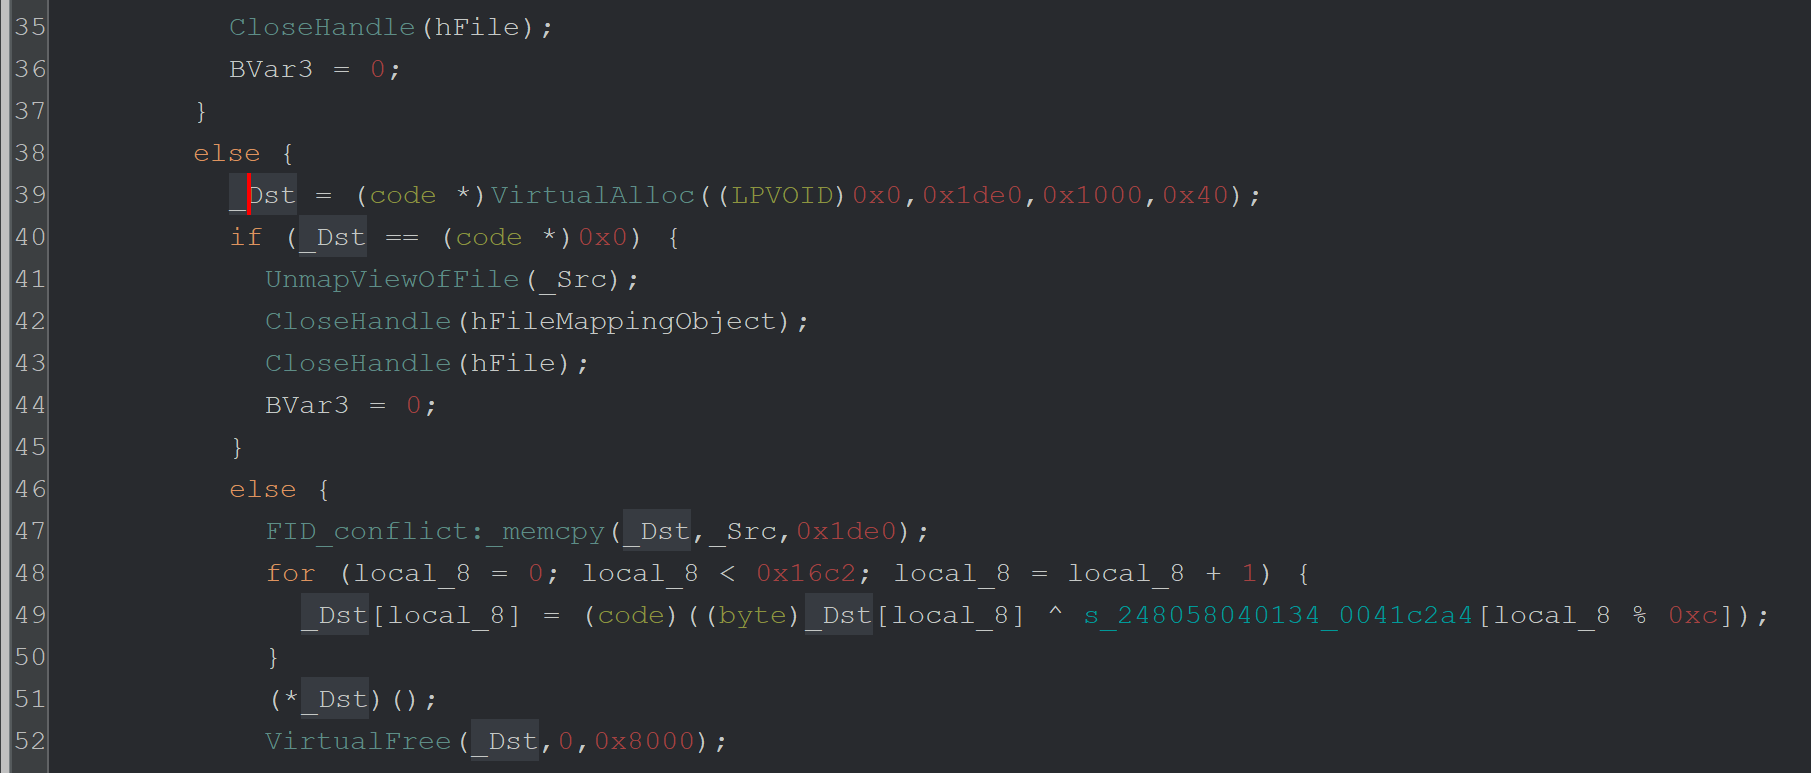
Here (below), the surrounding code and context are revealed.
This is the code that executes (39) the VirtualAlloc function. In this screenshot, we can see that the VirtualAlloc function is called (39), then _memcpy is used (47) to copy data into the buffer, then the buffer is xor'd ^ with a key (49).
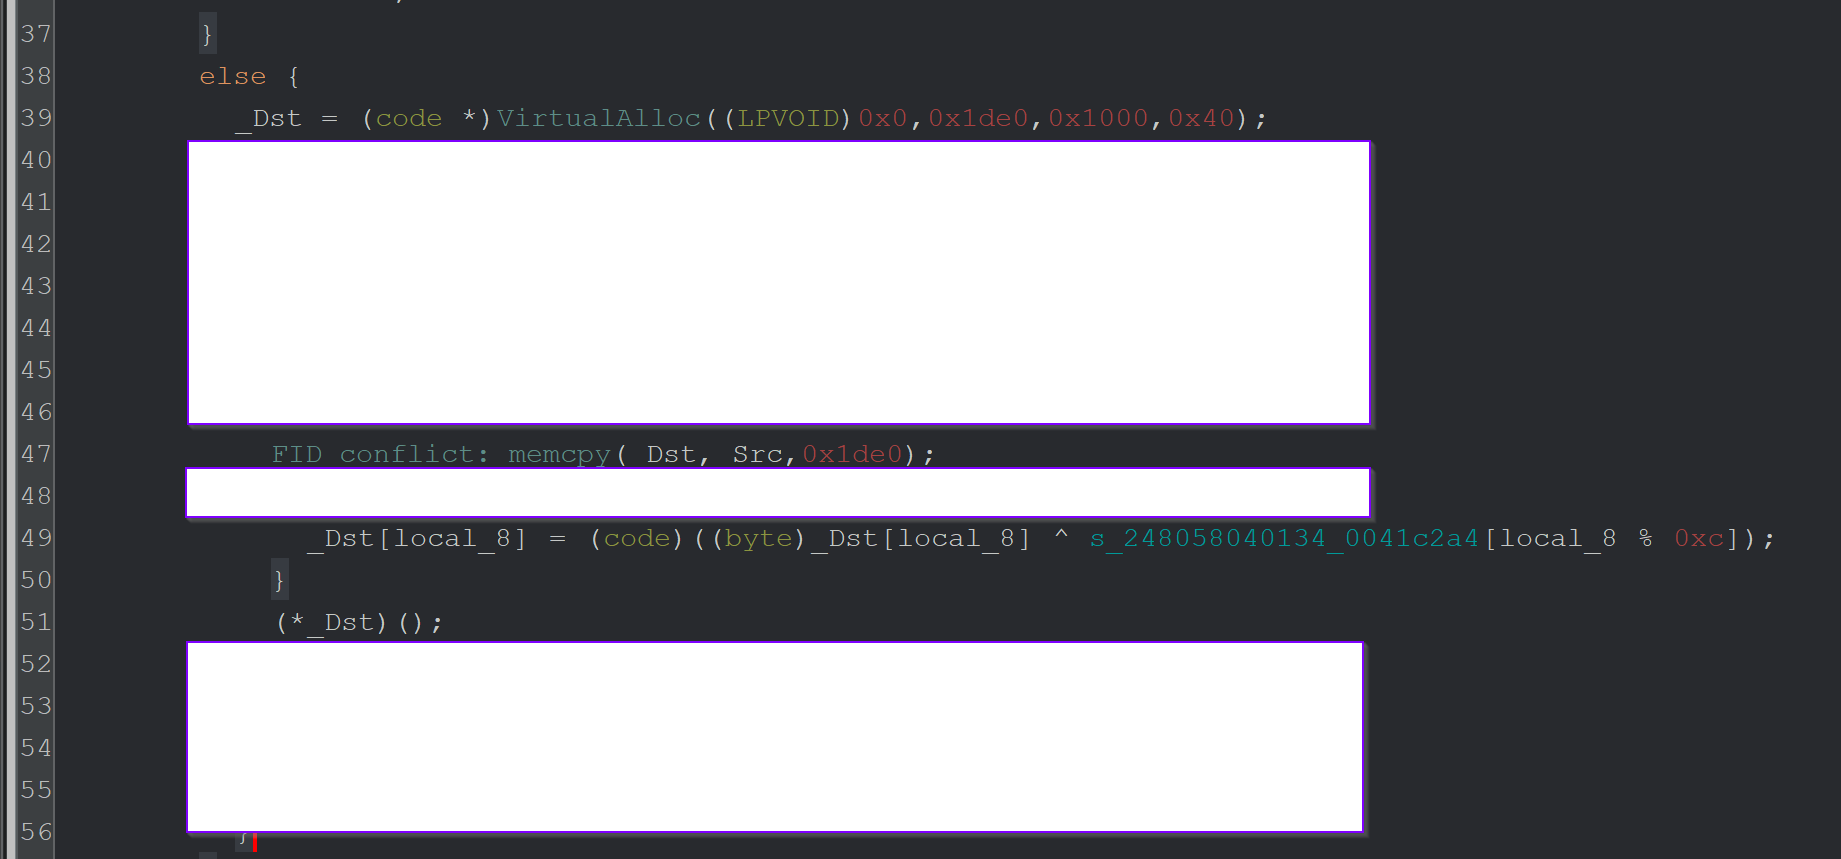
Here is a slightly better view with only the most relevant information visible.
Line 39 - Call VirtualAlloc to create a memory buffer
Line 47 - Copy some data into that buffer
Line 49 - Use XOR ^ To decode the data in that buffer.
Line 51 - Execute the buffer as code.
From this, we can determine that the VirtualAlloc buffer is being used to store and execute some kind of code.
This is great - but why is the VirtualAlloc function never hit in the first place?
For this - we need to see what happens before VirtualAlloc.
Since we have already located the relevant function - we can scroll up to see what happens before VirtualAlloc and determine why it might not be being hit.
Below we can see the contents before the VirtualAlloc call on Line 39.
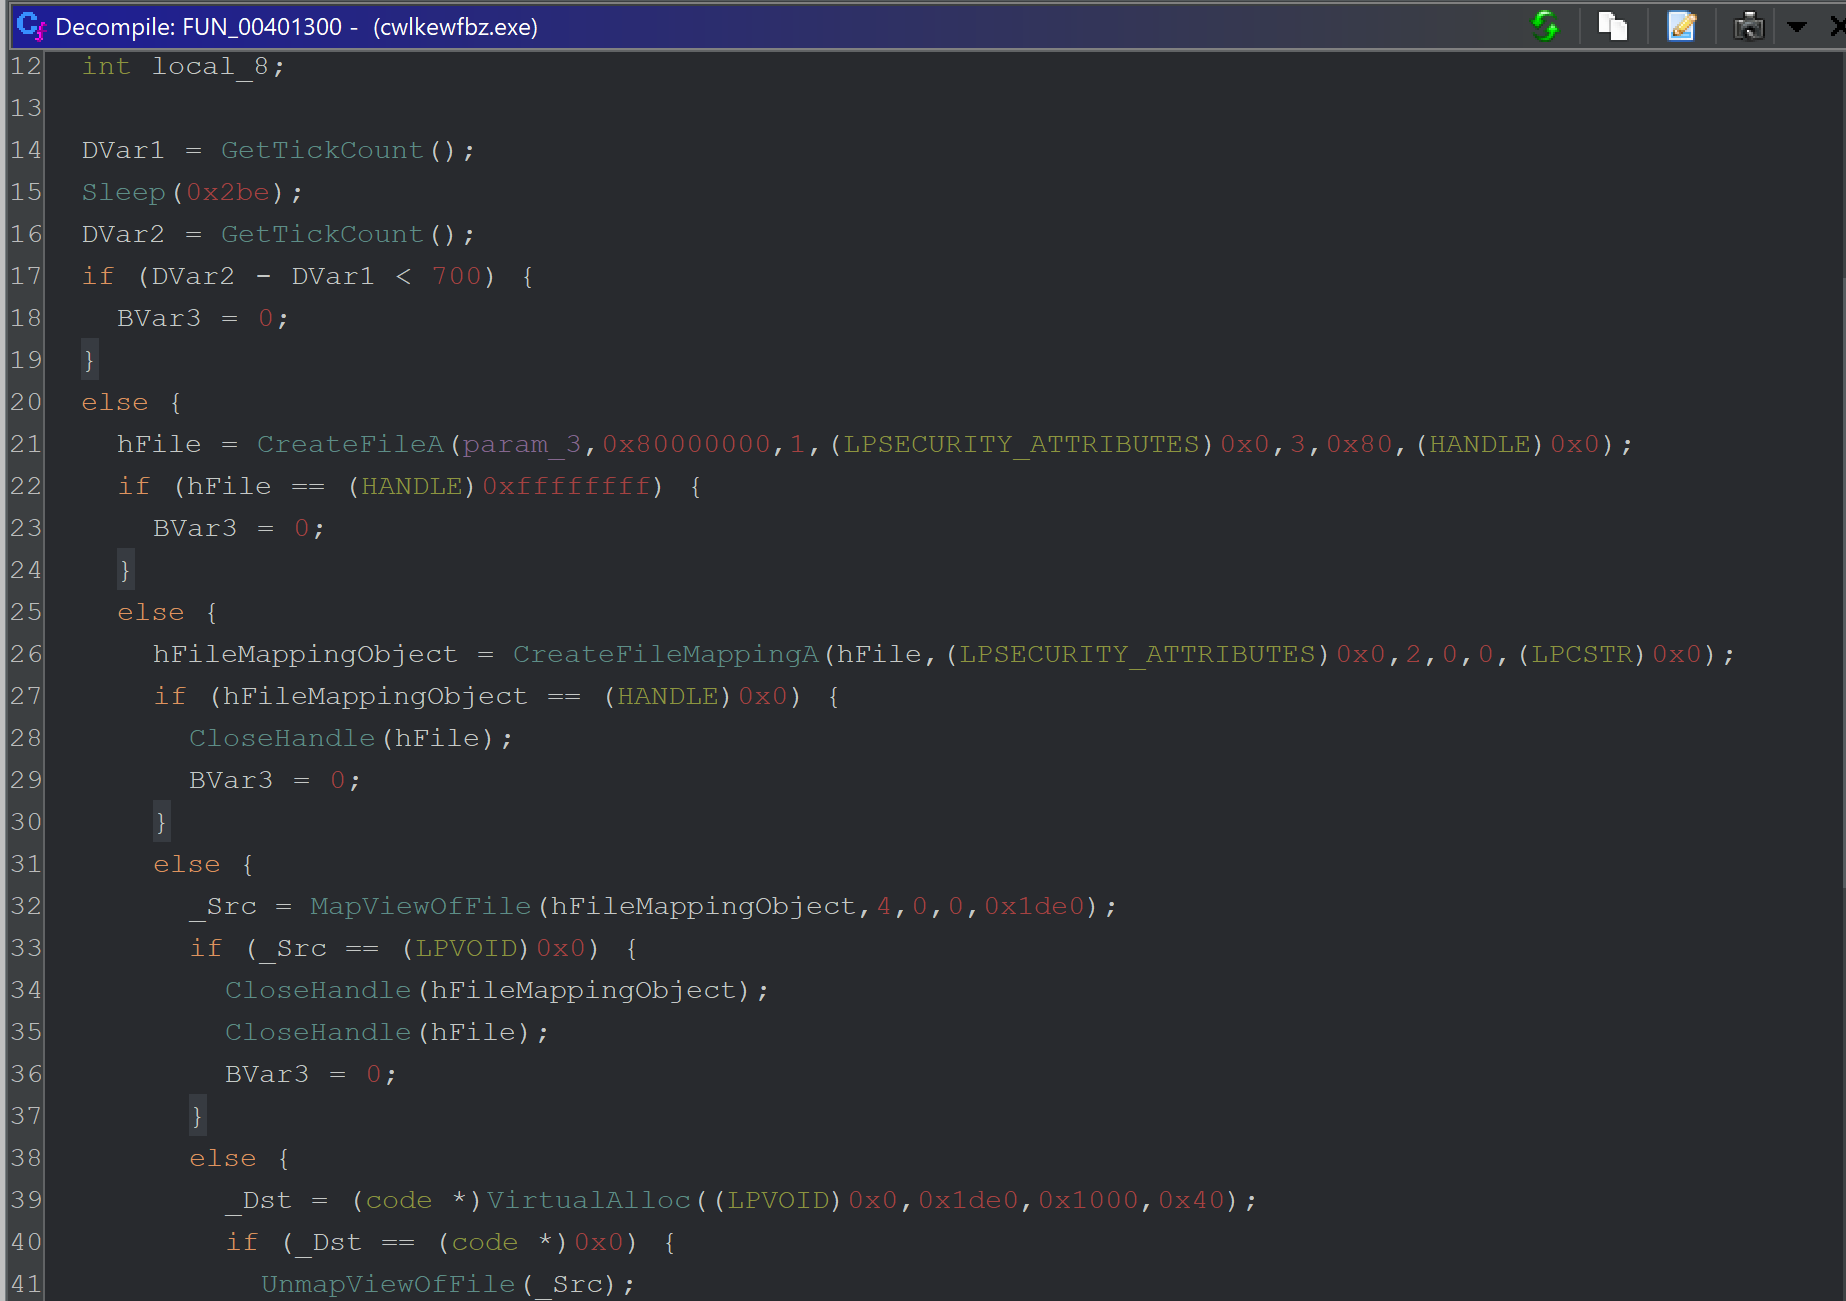
There's quite a bit happening - so here’s a breakdown. The first is an anti-debug/anti-emulation check using timers.
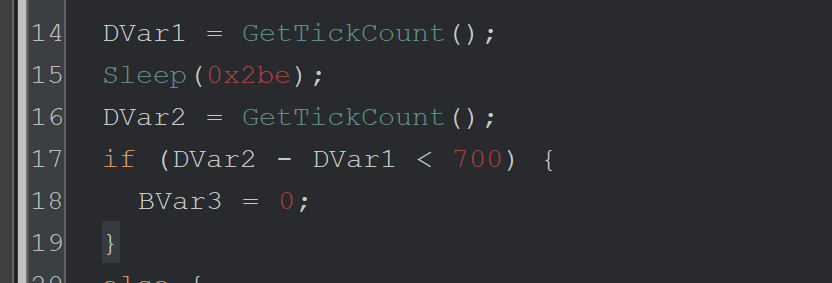
Lines 14-19 - This is an anti-debug/emulation check to bypass sandboxes that patch the Sleep function with a value of 0.
Line 14 - GetTickCount is used to check the number of milliseconds that have elapsed since the system was started.
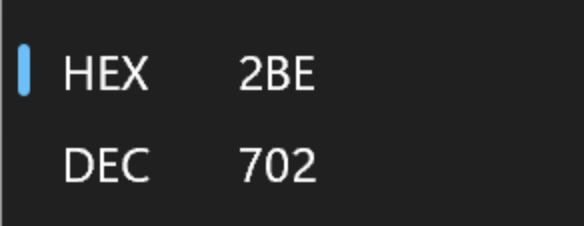
Line 15 - The Malware calls Sleep for 0x2be (702) milliseconds.
Line 16 - GetTickCount is used again to determine how many milliseconds have elapsed since the system was started.
Line 17 - If less than 700 milliseconds have passed, set a variable to 0 and don’t continue execution.
Windows Calculator (programmer mode) can convert the 0x2be into decimal to obtain 702 milliseconds.
Although this anti-analysis check was interesting - I had a gut feeling that it wasn't the issue, so I didn’t investigate it further.
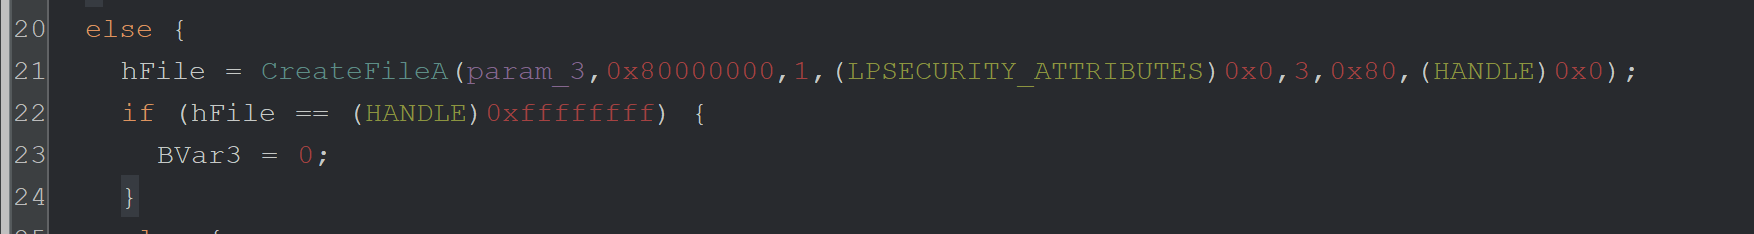
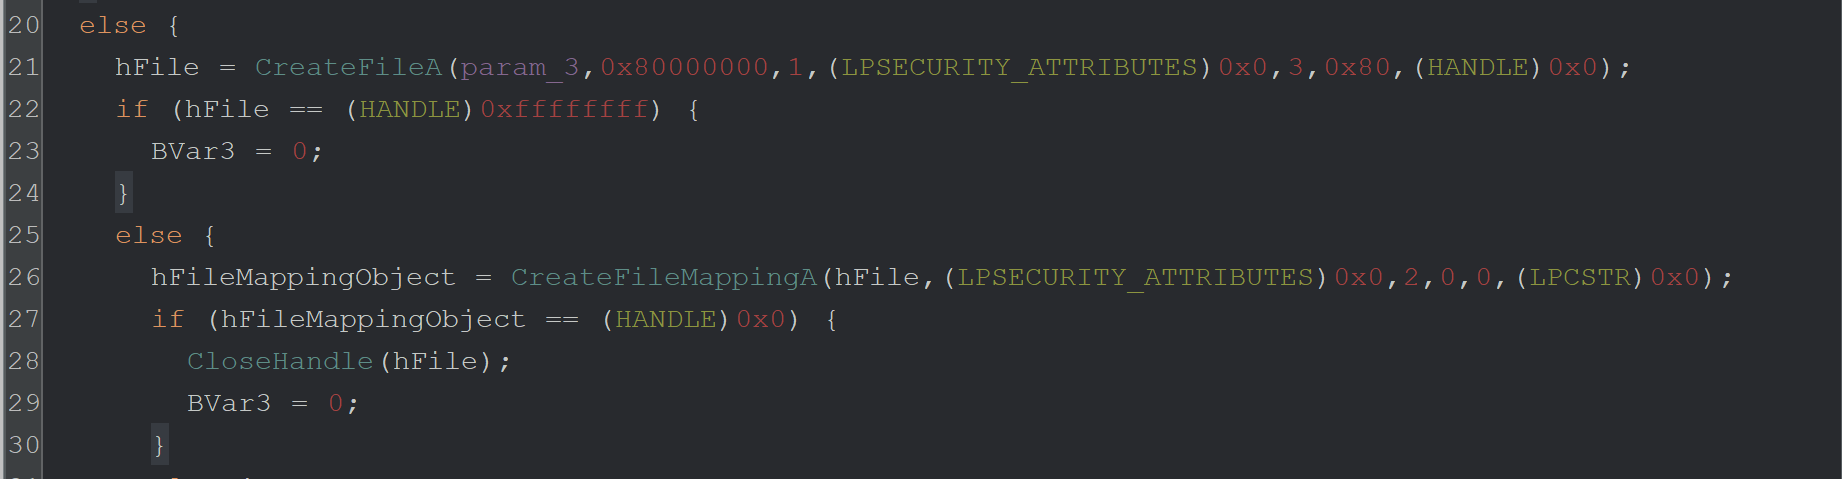
In lines 21-24 below - we can see the CreateFileA function is called.
This is used to open a file from disk (the first parameter, stored in param_3).
I wanted to know which file was being opened and whether the failure to open this file may be what is breaking the malware execution.
I decided to use a debugger to monitor the first argument to CreateFileA
I did this by creating a breakpoint with bp CreateFileA and allowing the Malware to execute.
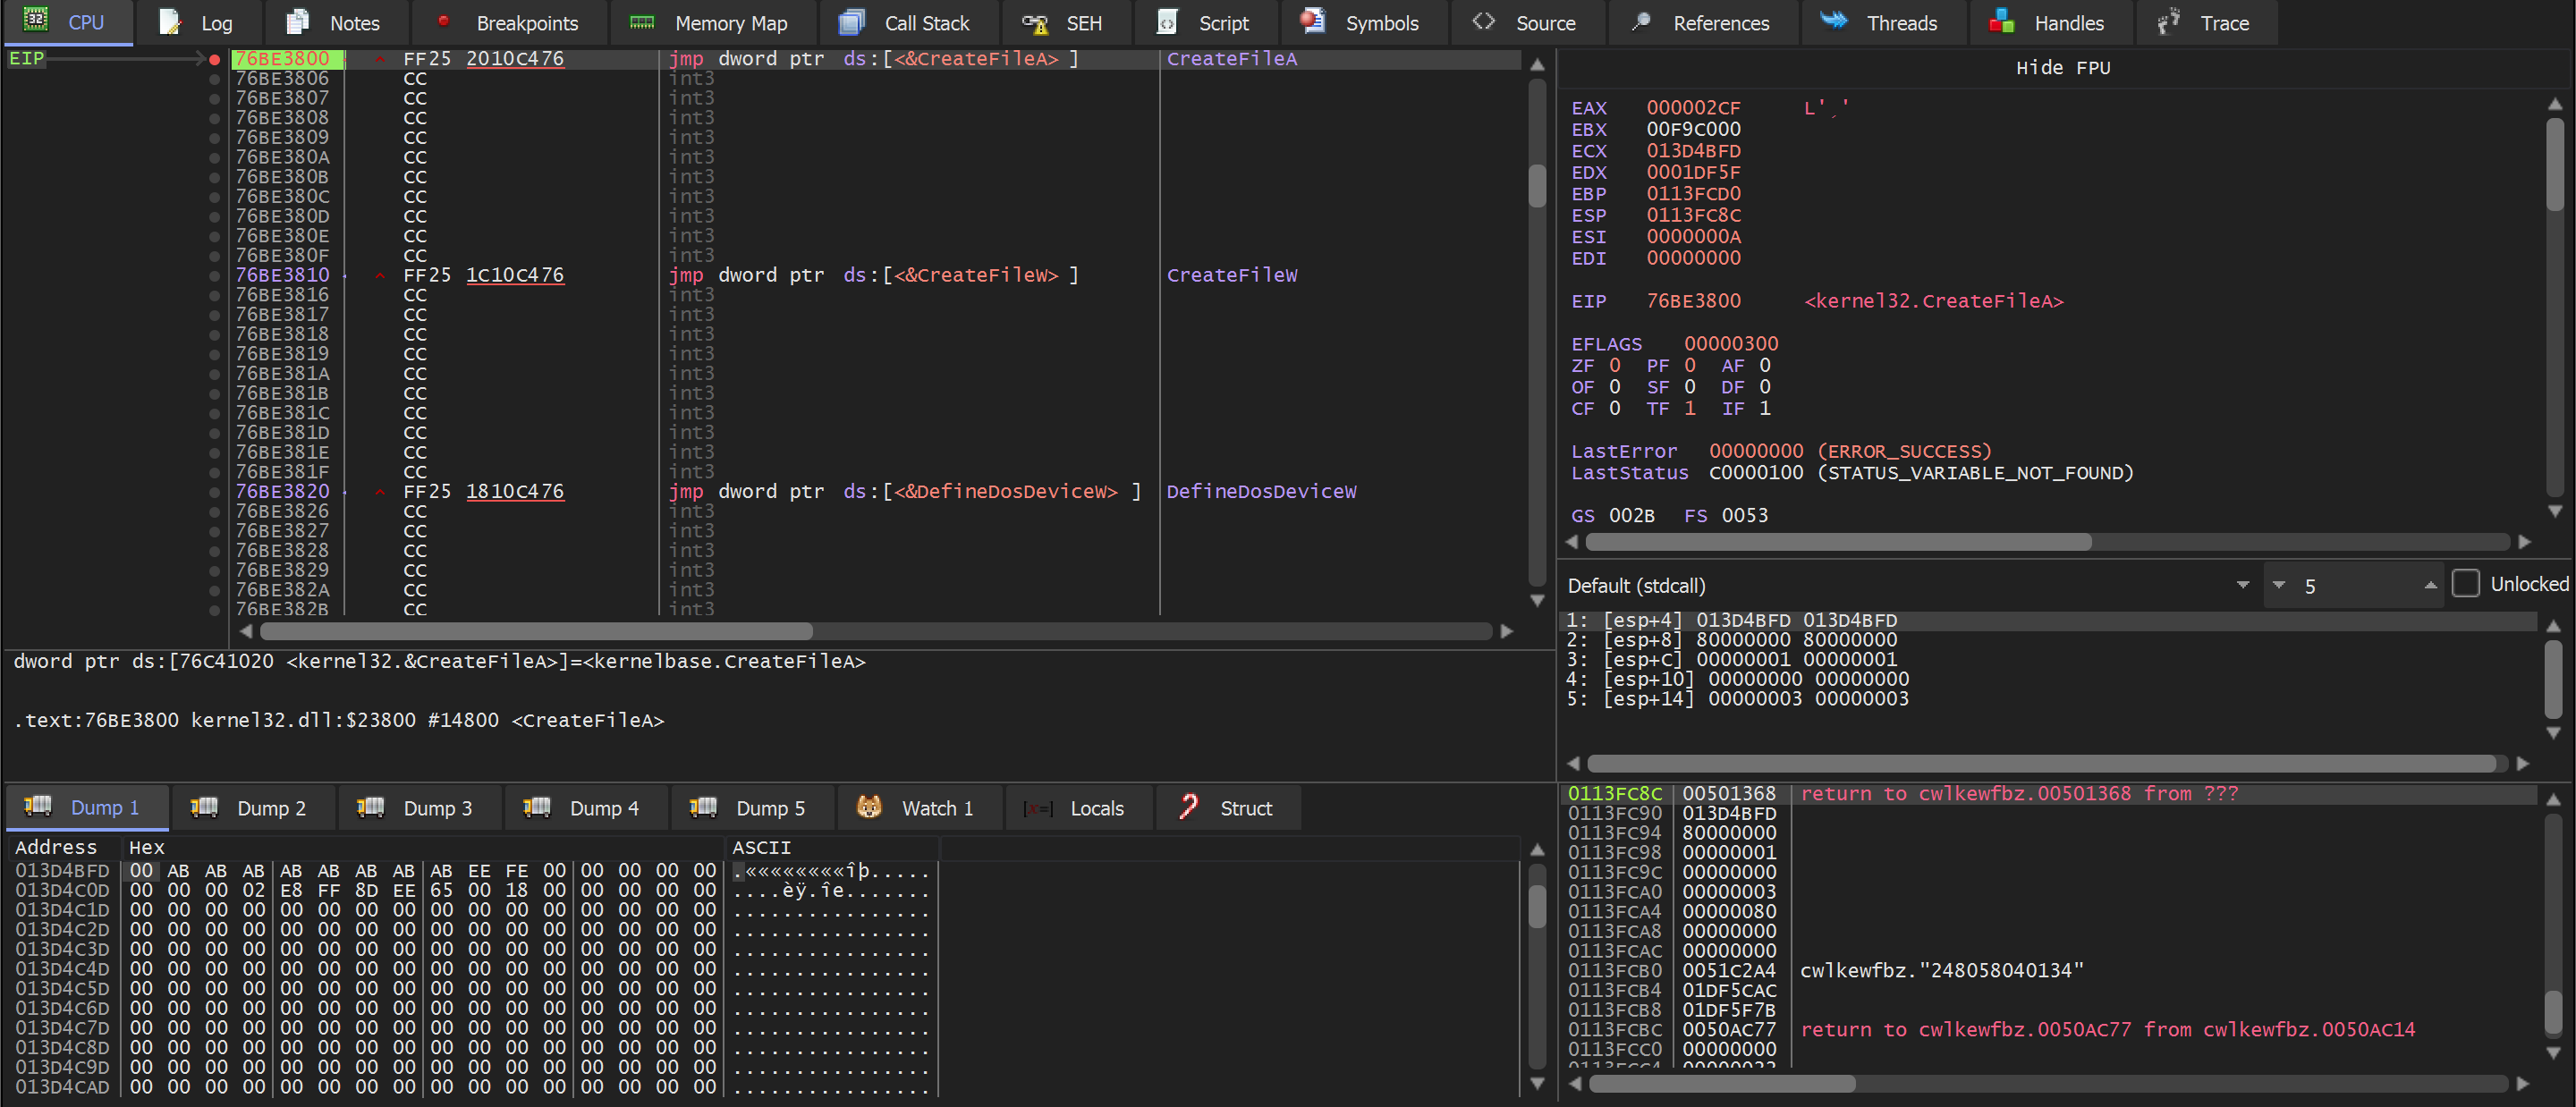
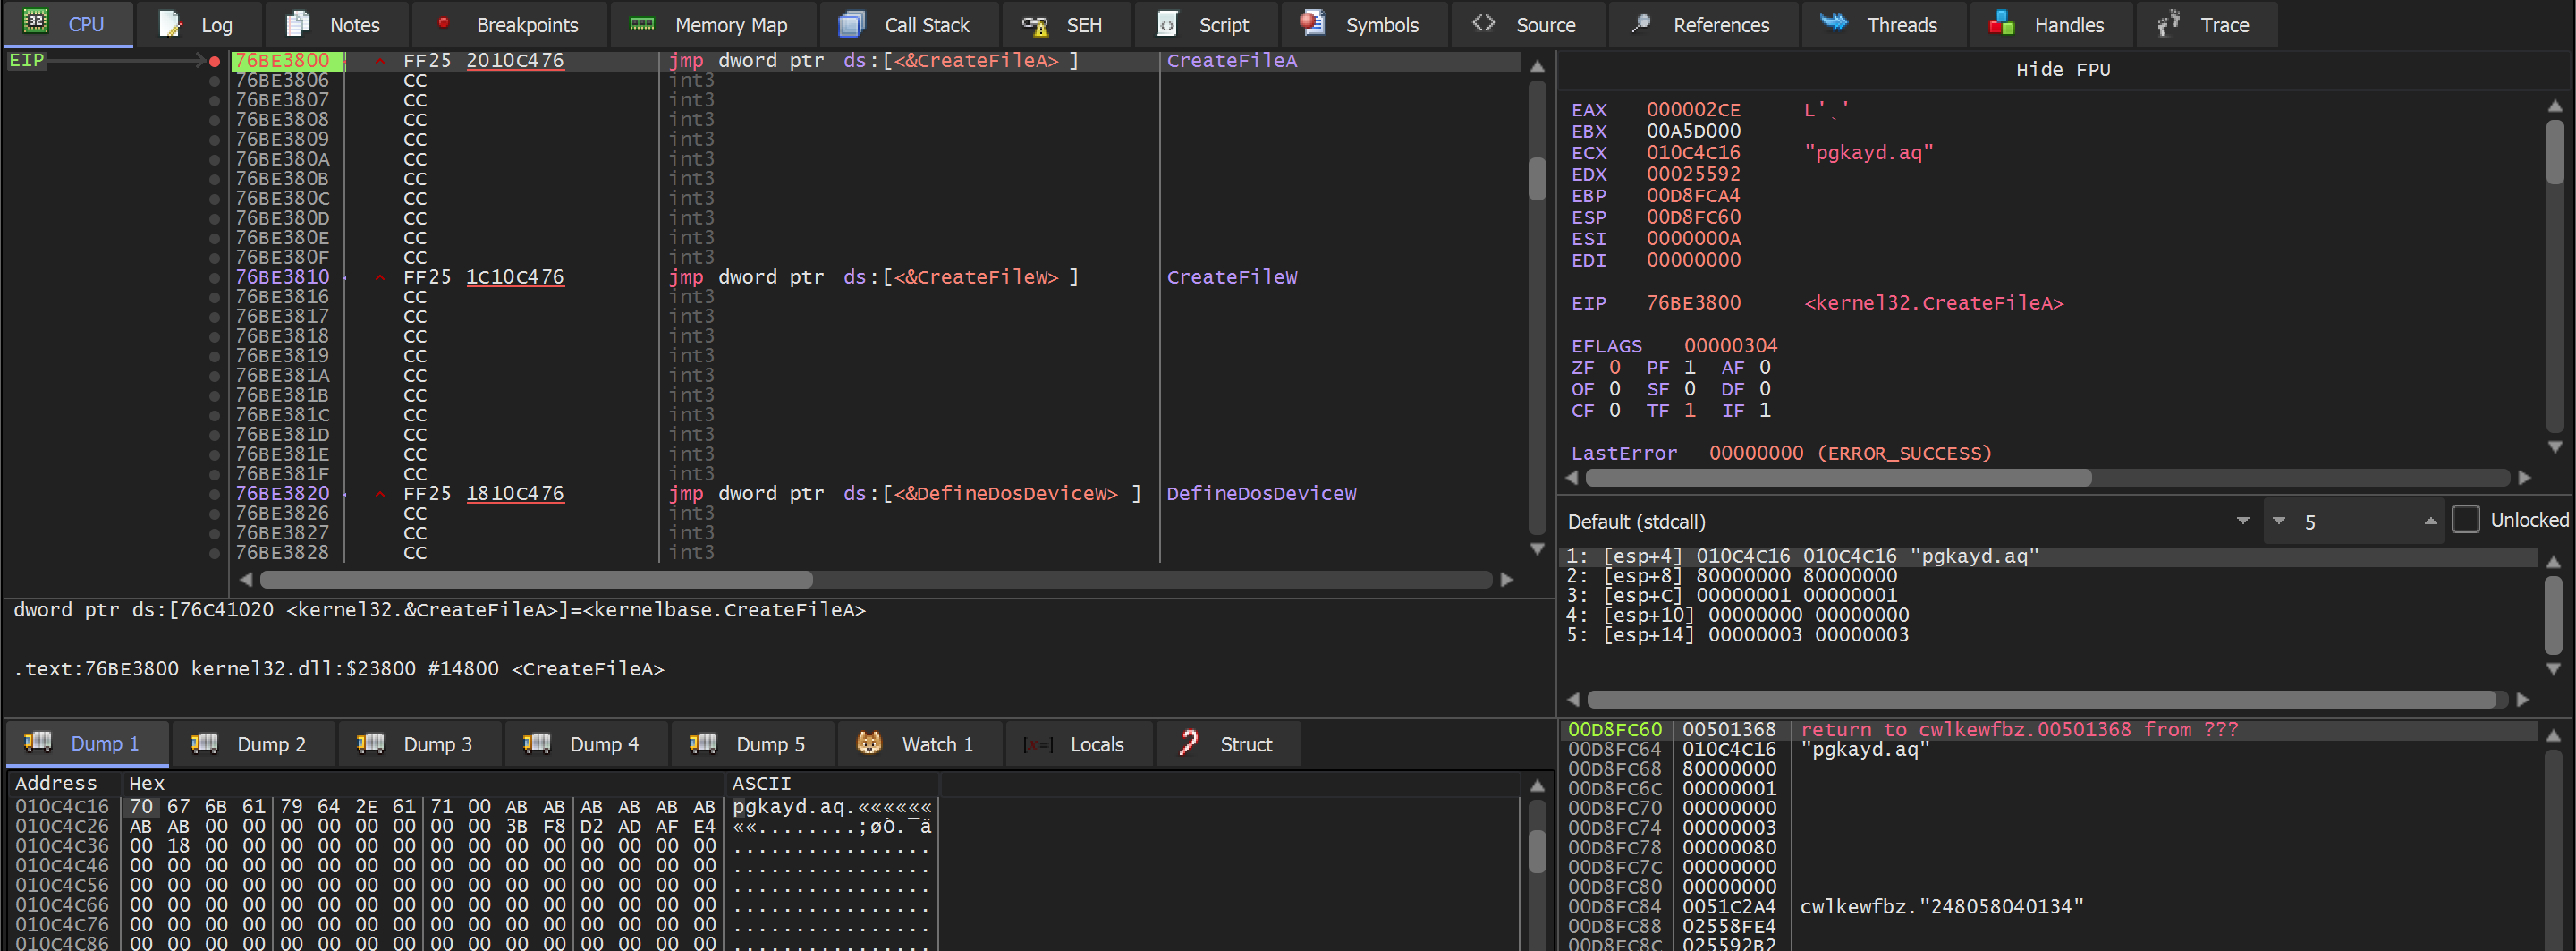
(Above) - the breakpoint is immediately hit.
(Below) - Confirmation that the first argument lpFileName is the one containing the file name.
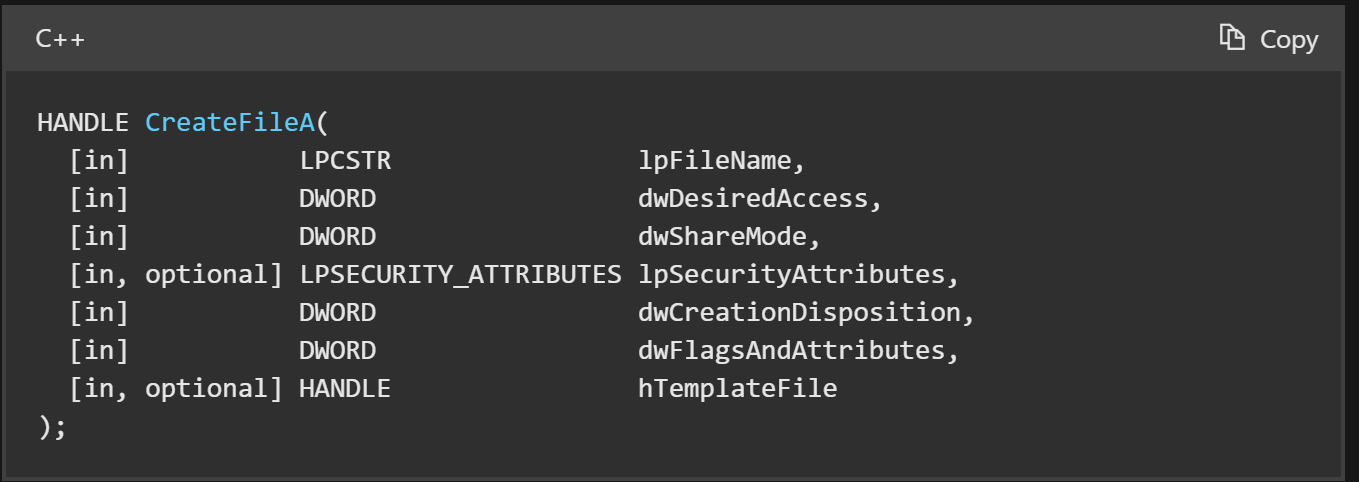
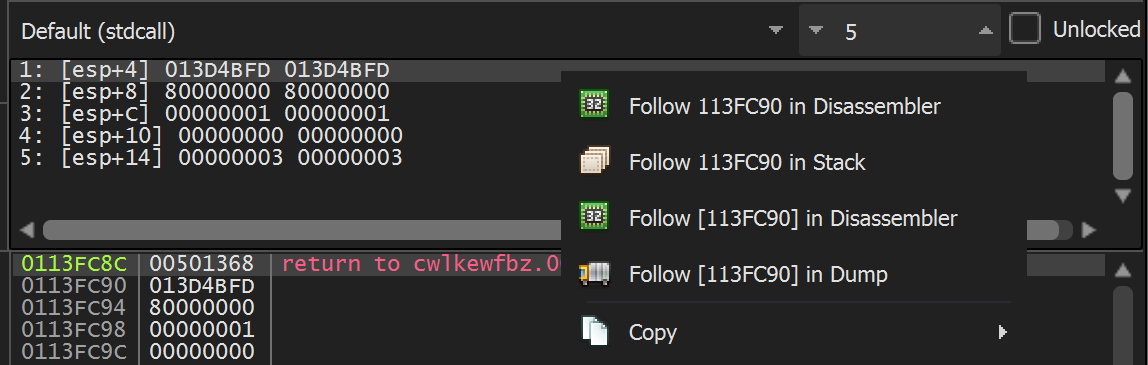
So I followed the first argument, which can be found on the right side of the debugger window.
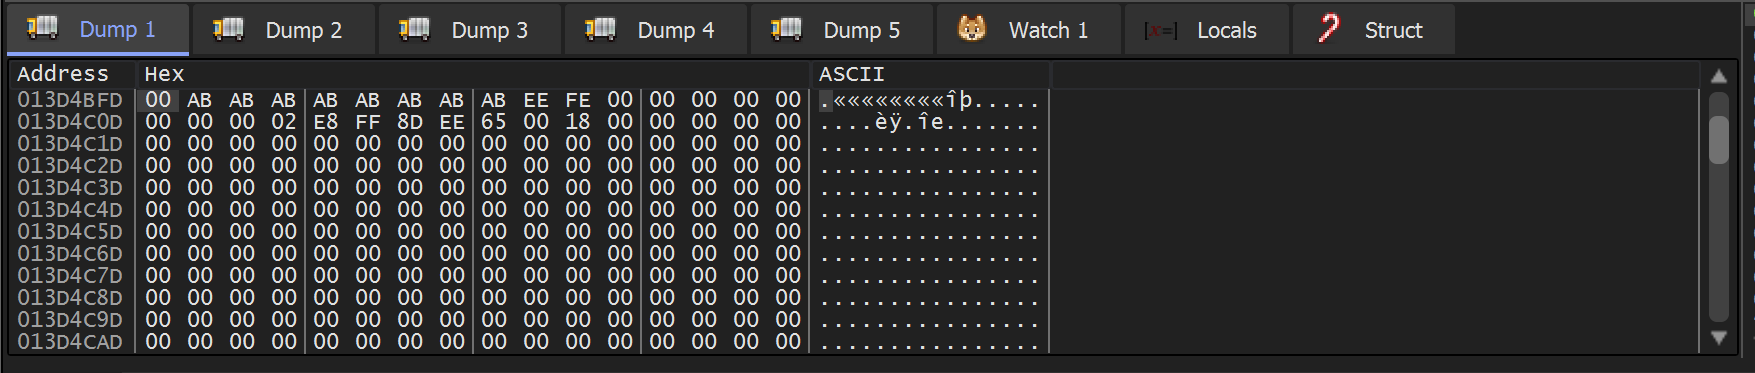
I viewed the contents of the first argument [esp+4] using “Follow in Dump.”
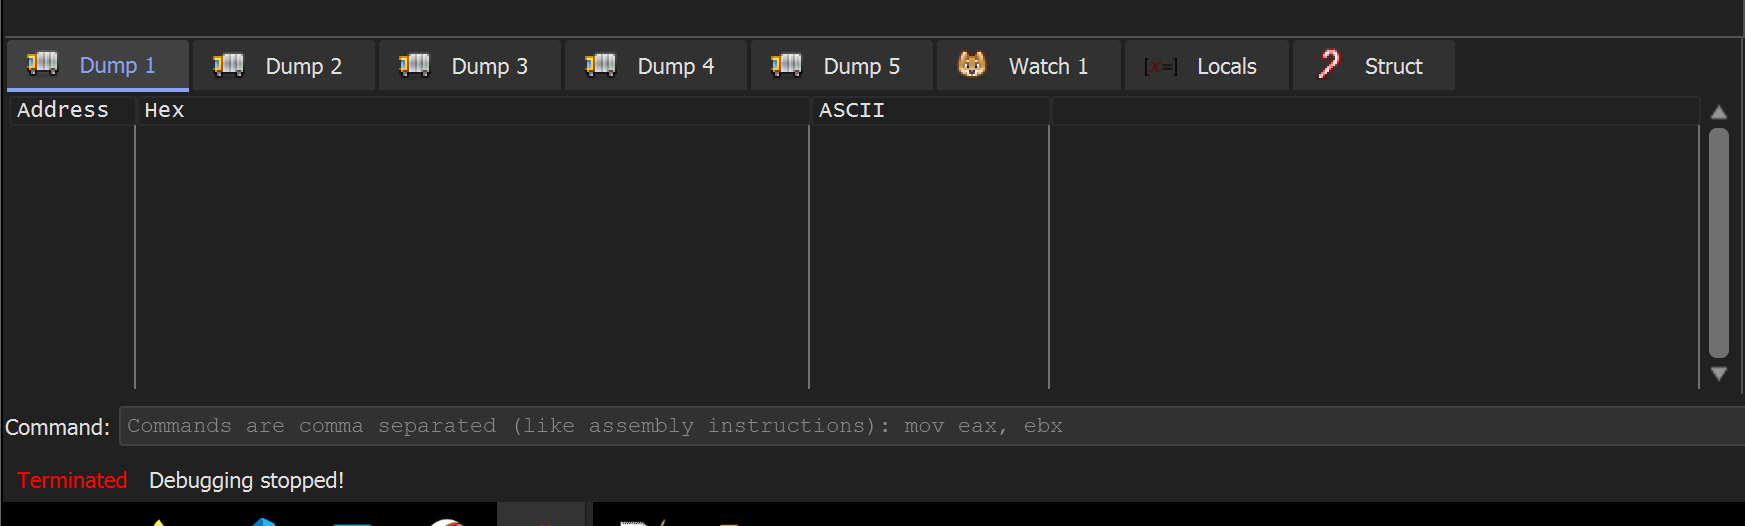
(below) In the resulting dump window - I could see only junk and not a valid file name.
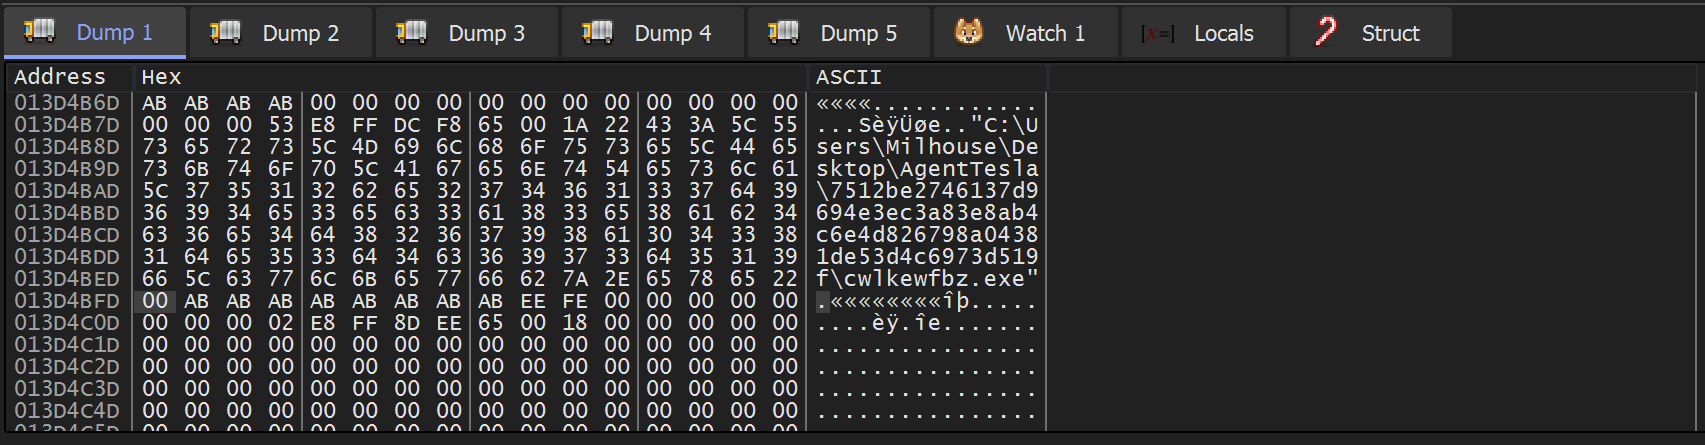
I then scrolled up slightly. This revealed the command line of the file being executed.
Notably, the command line is empty after the cwlkewfbz.exe.
I suspected this was causing issues. So I allowed the function to execute and checked the return value to determine if an error was occurring, which may break the Malware.
Unsurprisingly - the return value for CreateFileA is 0xffffffff (EAX in top right) - which indicates an error.
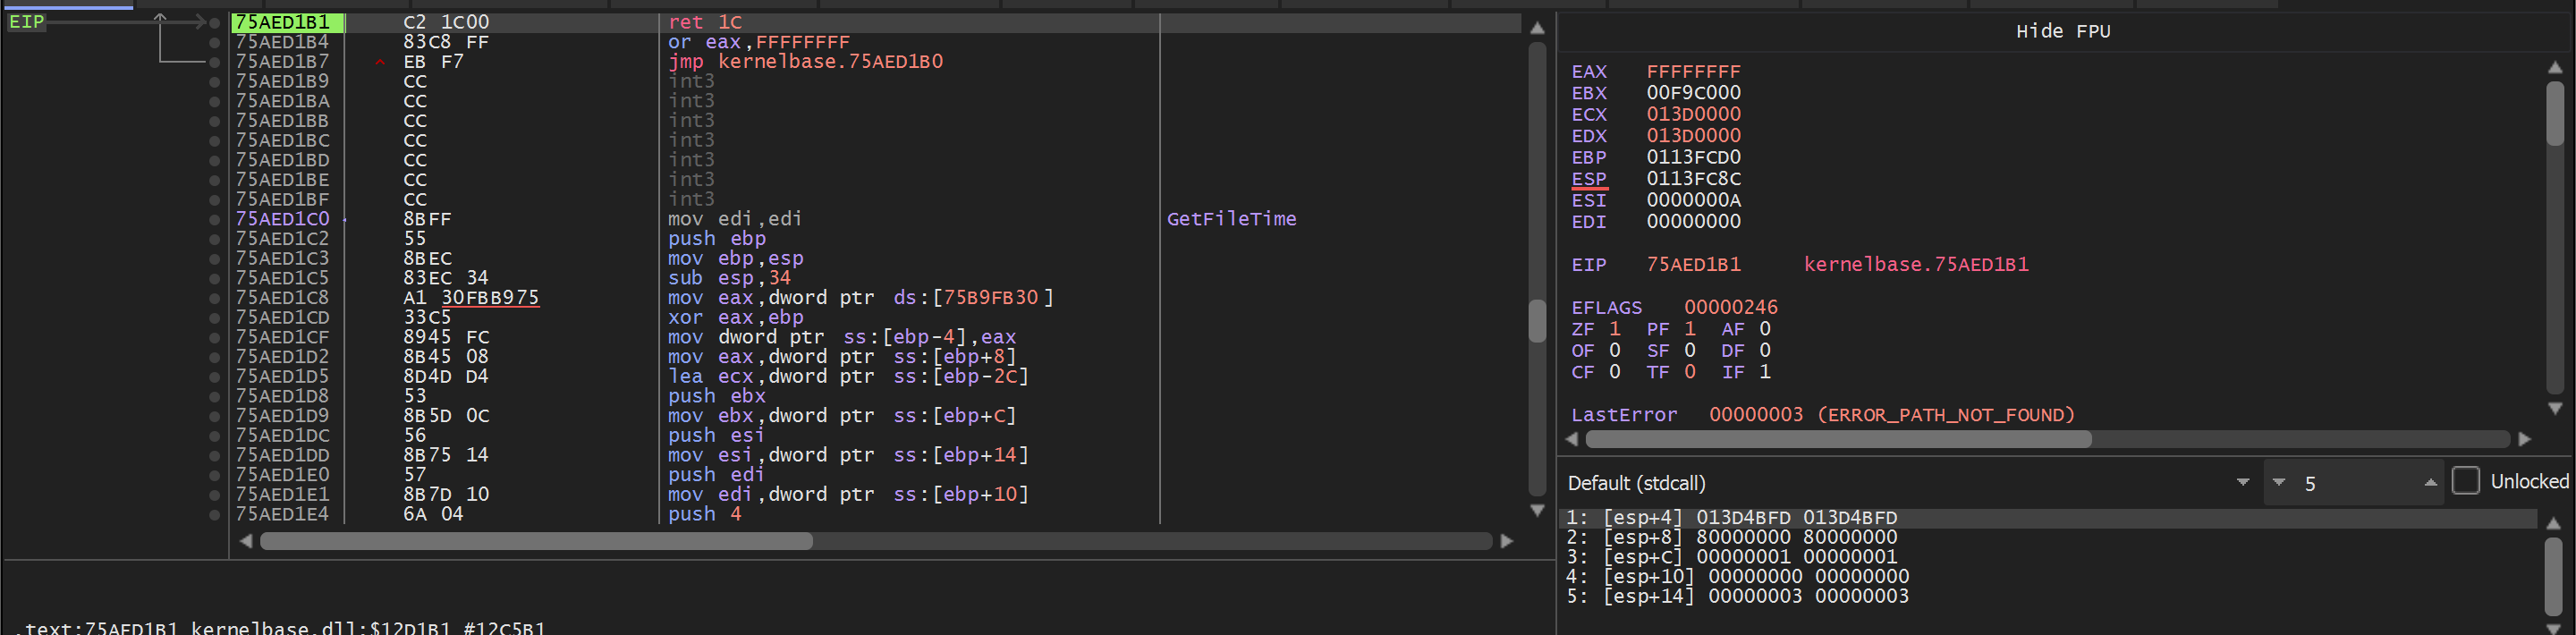
The call to CreateFileA is within a long series of if-else statements which ultimately execute the 2nd stage. If any statements fail, the Malware sets Bvar3 to 0 and exits.
Line 22 - Since the result of CreateFileA is an error 0xffffffff, the Malware will not continue to the next API of CreateFileMappingA.
Fixing the CreateFileA
It was now reasonably safe to assume that the CreateFileA error was causing the Malware to terminate before the call to VirtualAlloc.
To fix this and continue execution - we needed to know which value was being expected in the call to CreateFileA
Our previous analysis of the .nsi script reveals the file that should be in this command line. pgkayd.aq
Analysisatch the command line in x32dbg.
We can use x32dbg to modify the command line to the correct values that match the .nsi script.
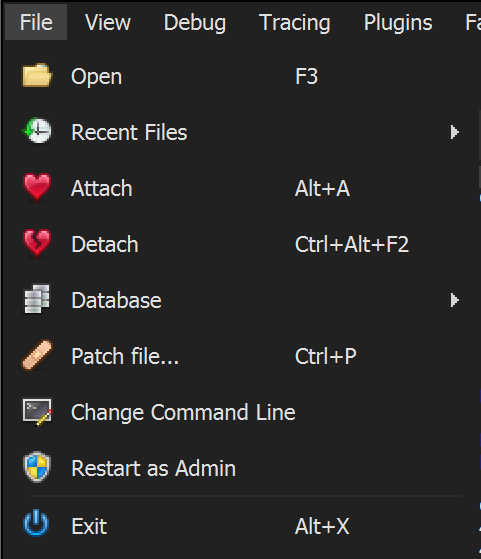
Within x32dbg you can browse to File -> Change Command Line
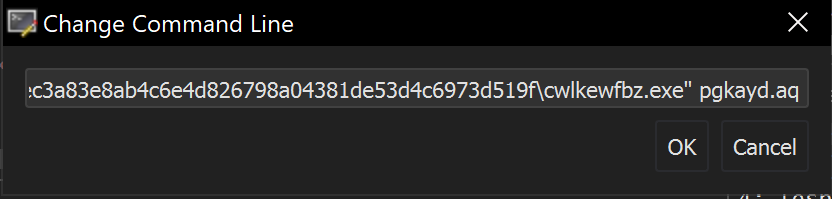
And then crudely add the value pgkayd.aq from the .nsi script. (I found that the full path was not required)

The modified command line looked like this.
After restarting the program, the first argument to CreateFileA now contains the correct file.
Continuing execution - the breakpoint on VirtualAlloc is triggered successfully.
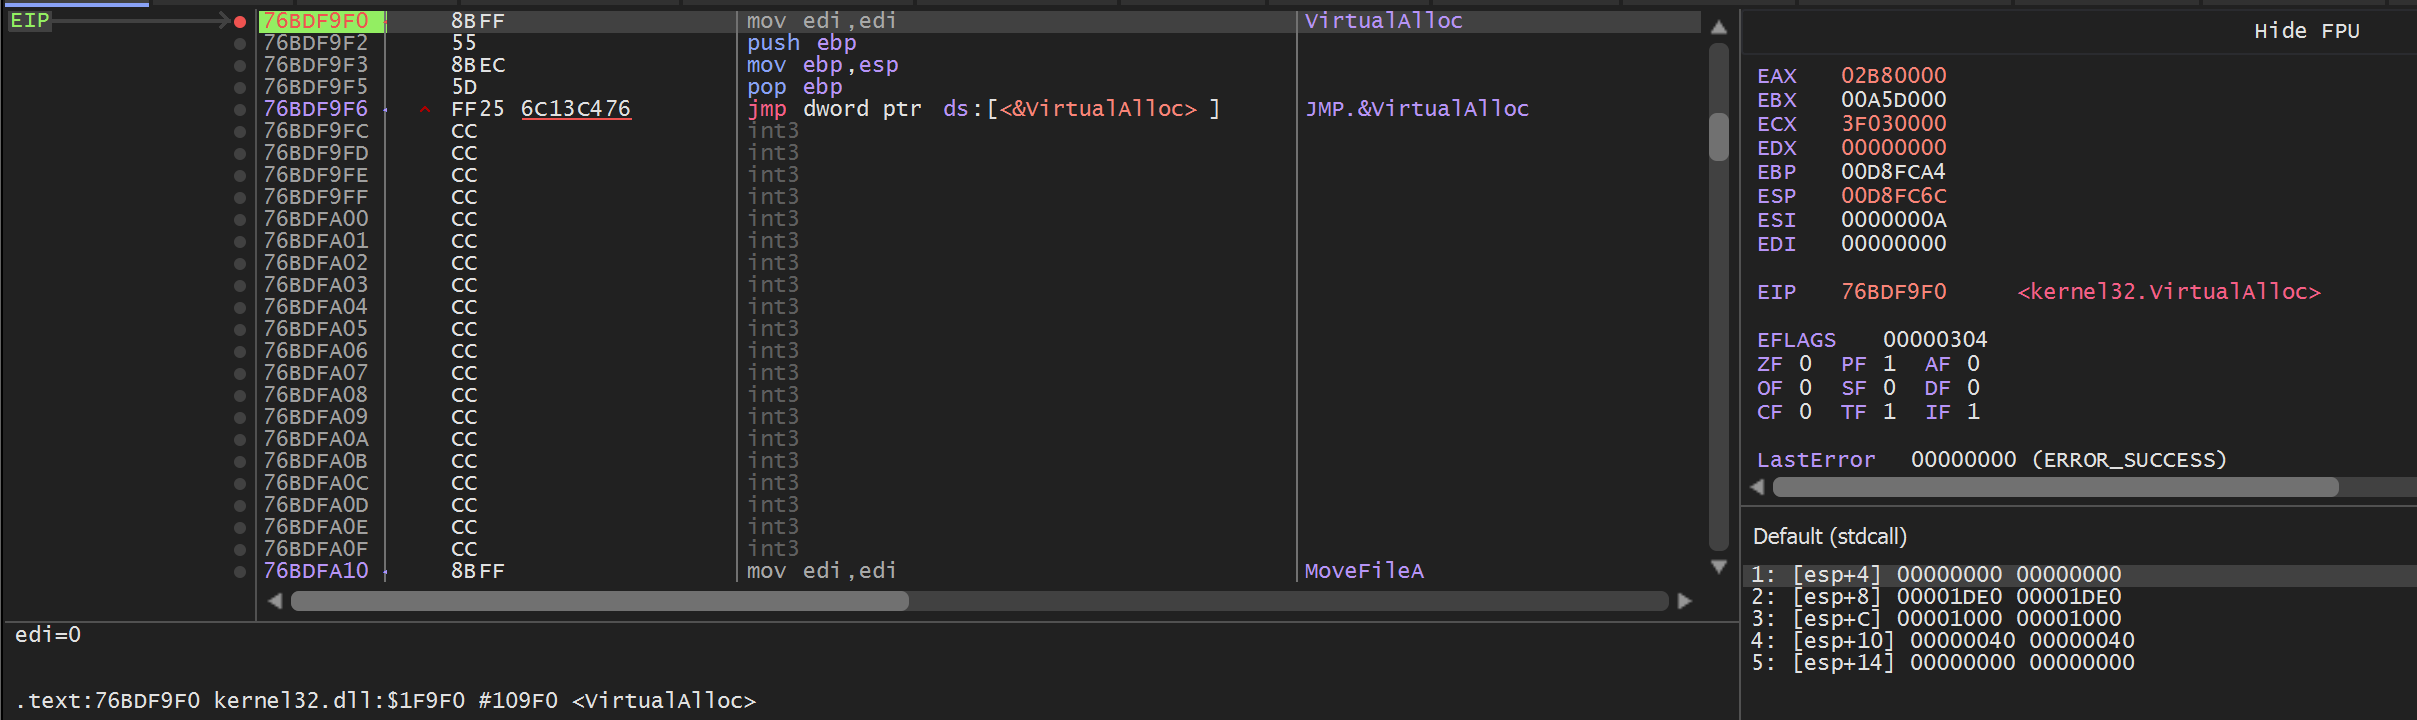
We now need to monitor the memory being allocated by VirtualAlloc. This can be done using a similar process that I detailed in my Redline/Amadey Post.
Using this process - we can be alerted if any content is written to the newly created buffer.
- Set a breakpoint on
VirtualAlloc - Use
Execute Until Returnto obtain the return value (containing the address of the memory buffer) - Set a hardware breakpoint on the buffer - This will trigger an alert when the buffer is accessed.
- Monitor the "alerts" until the buffer contains something of interest.
Creating a Hardware Breakpoint To Decode Malware
To create the Hardware breakpoint from VirtualAlloc - we can hit CTRL+F9 (Execute Until Return) and then Follow in Dump on the return value in EAX.
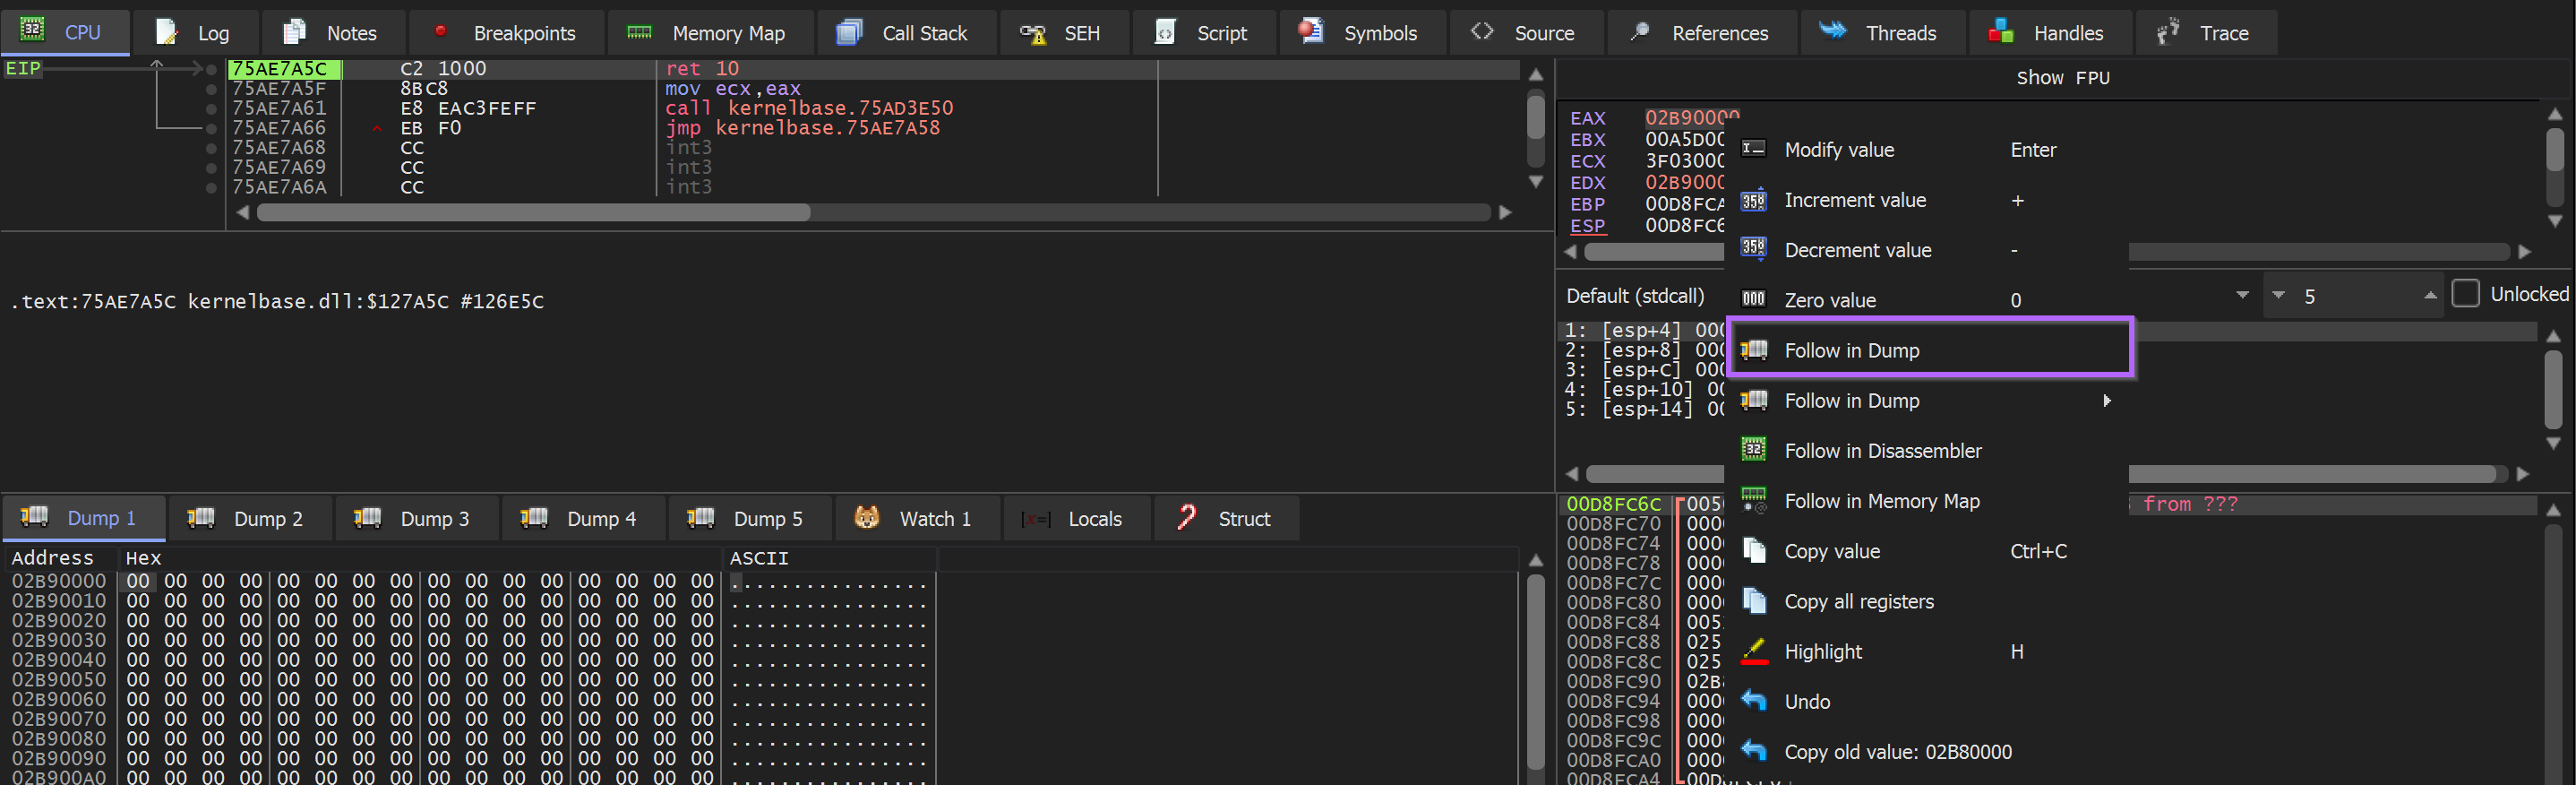
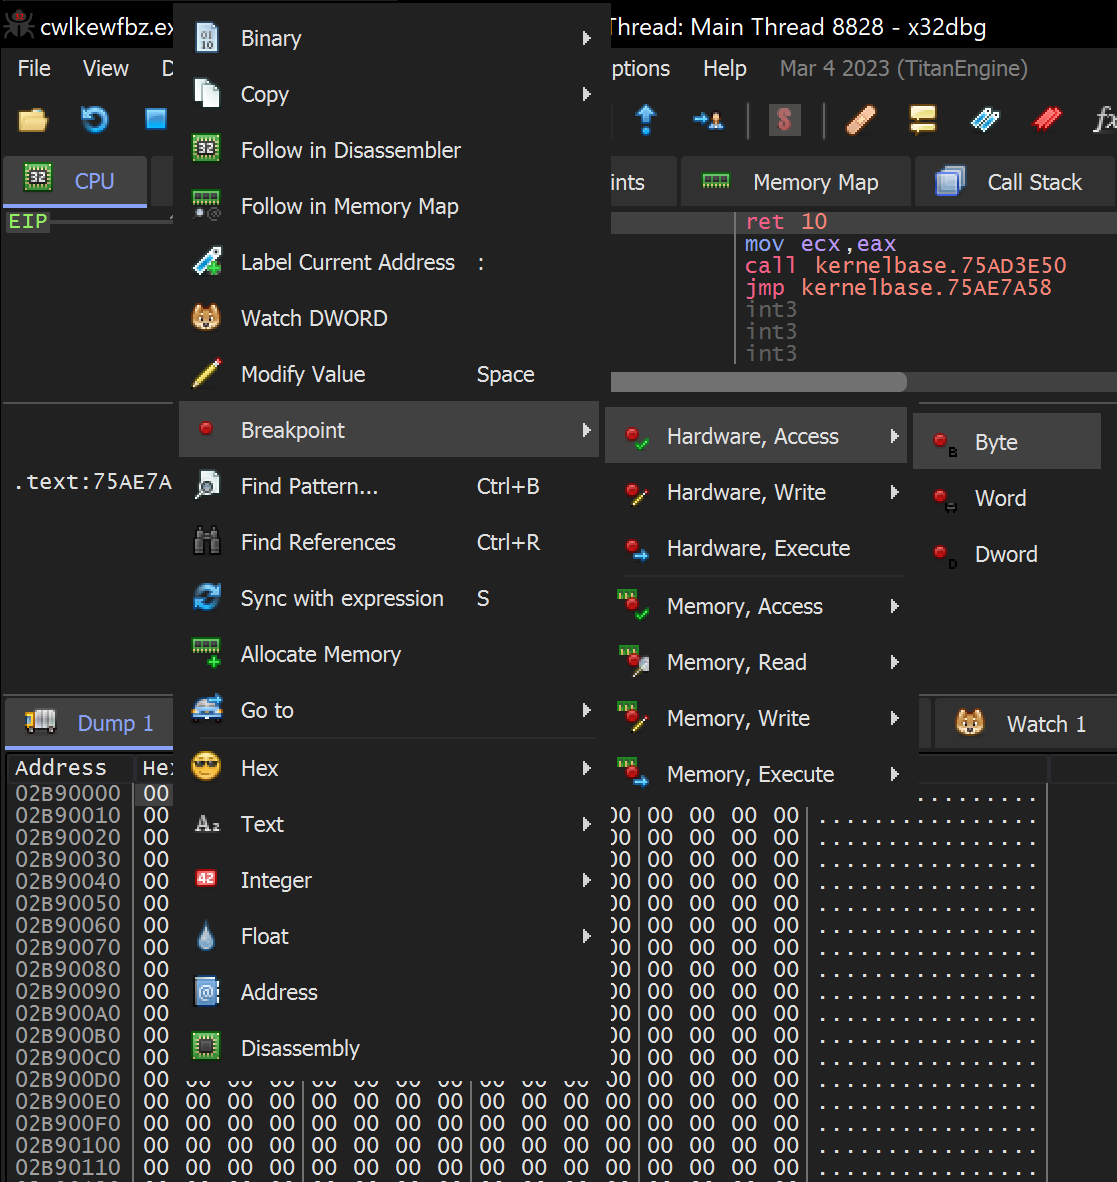
With the resulting memory contents in the dump window - we can select the first bytes and create a hardware breakpoint.
Dump → Right Click → Breakpoint → Hardware Access → Byte
Then continue execution
Once the hardware breakpoint has been set - We can allow the Malware to continue to execute.
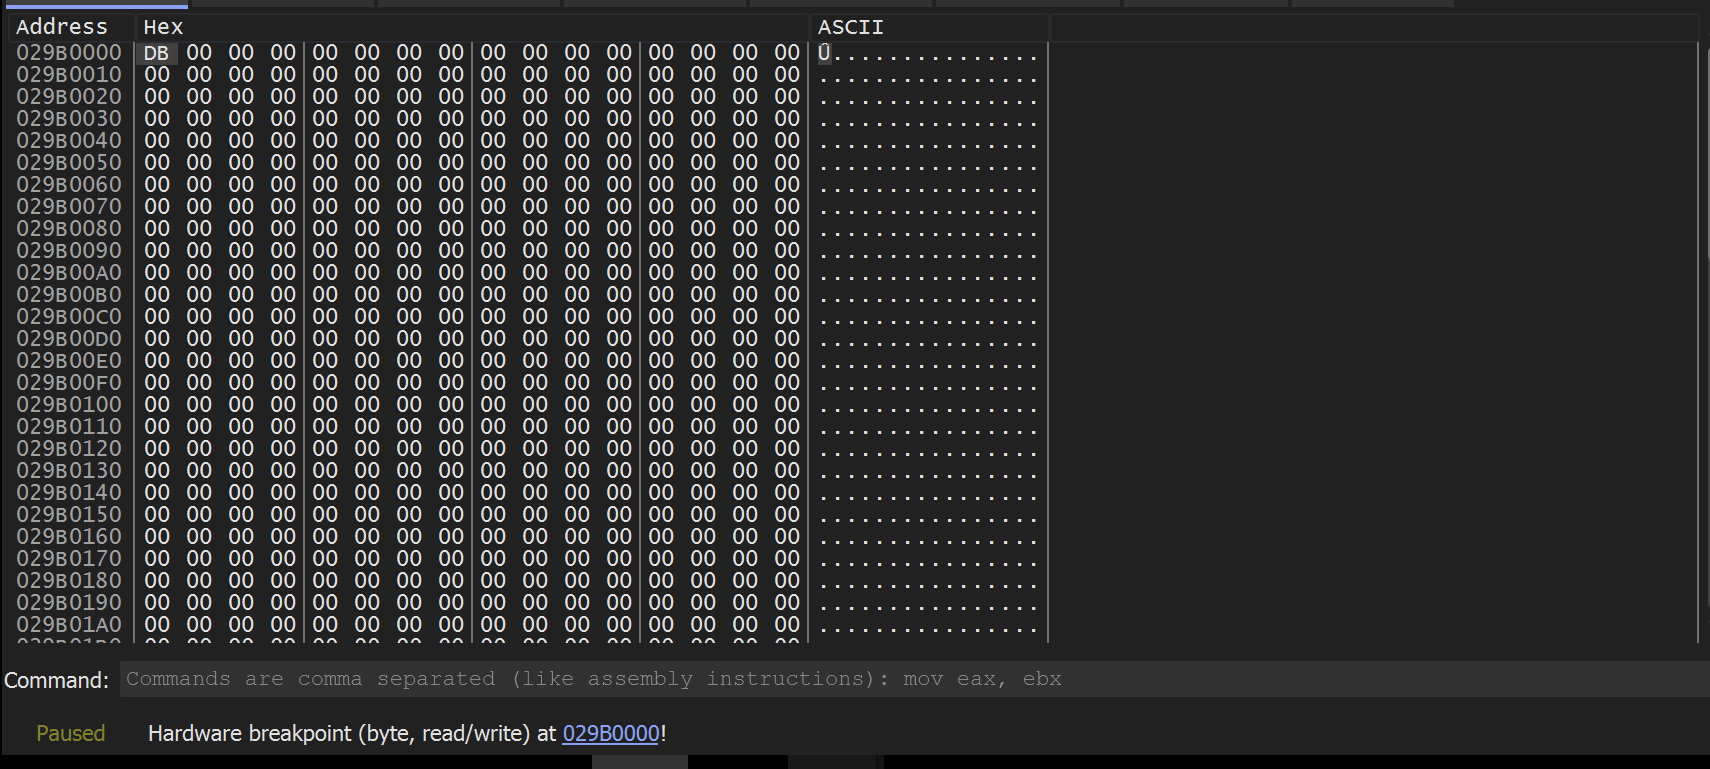
Soon - the hardware breakpoint is triggered and a single byte DB is written into the buffer. We can hit CTRL+F9 to continue execution and allow the buffer to finish filling up.
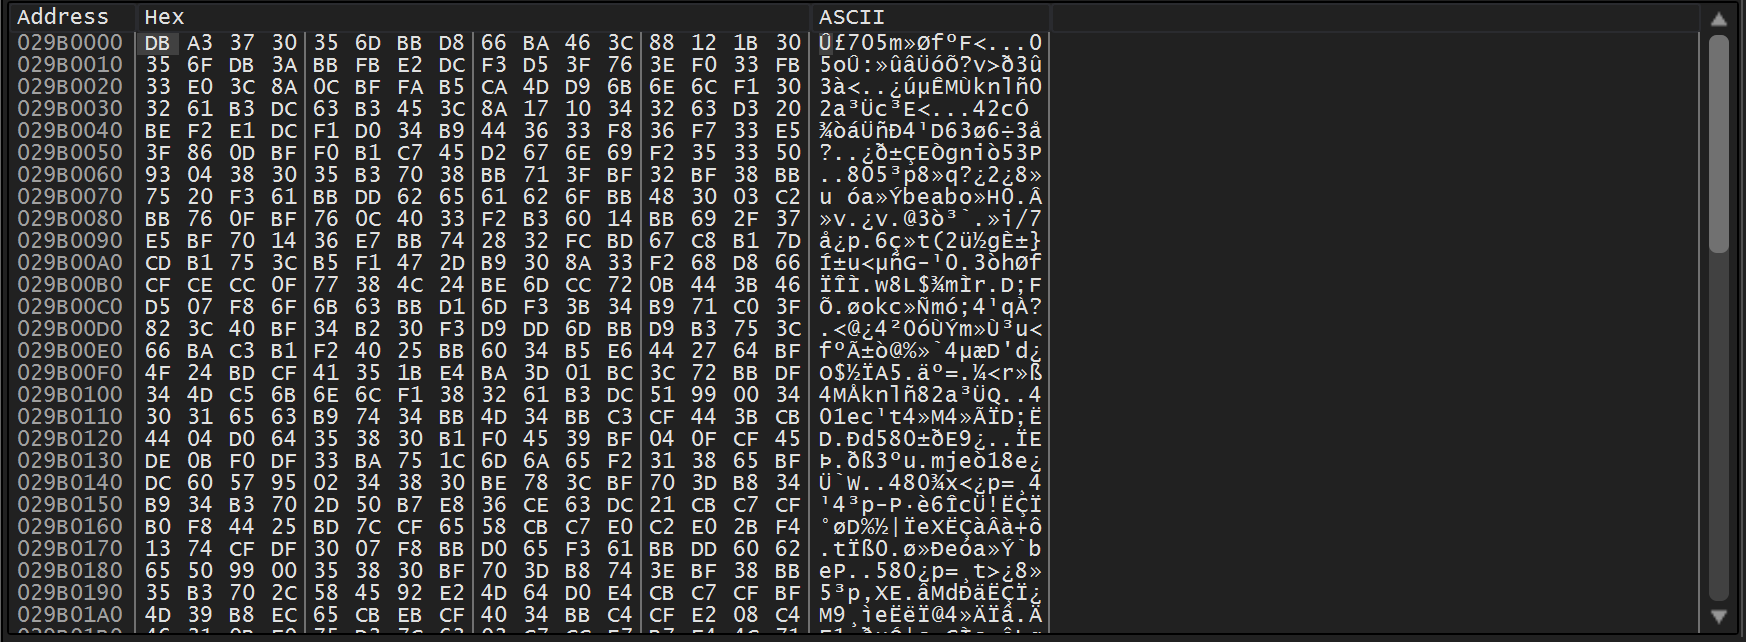
The buffer quickly fills up - but does not contain a MZ header (indicating an unpacked file). There are also no visible strings within the dumped content.
In situations like this - I generally suspect one of two things
- The “junk” is raw machine code (also referred to as shellcode), which often looks like junk.
- The “junk” is not fully decoded yet - in which case we can continue to execute and trigger hardware breakpoints until something of value appears.
The second option is useful - because the buffer needs to be accessed each time the buffer undergoes a round of decoding - a process that will trigger a hardware breakpoint.
Validating Potential Shellcode
The x32dbg Disassembler can be used to validate whether or not the bytes are shellcode.
This can be done by selecting the dump data and selecting Follow in Disassembler
We can see this in action below - note how the first disassembler bytes are DB A3 , which aligns with the contents of the dump window.
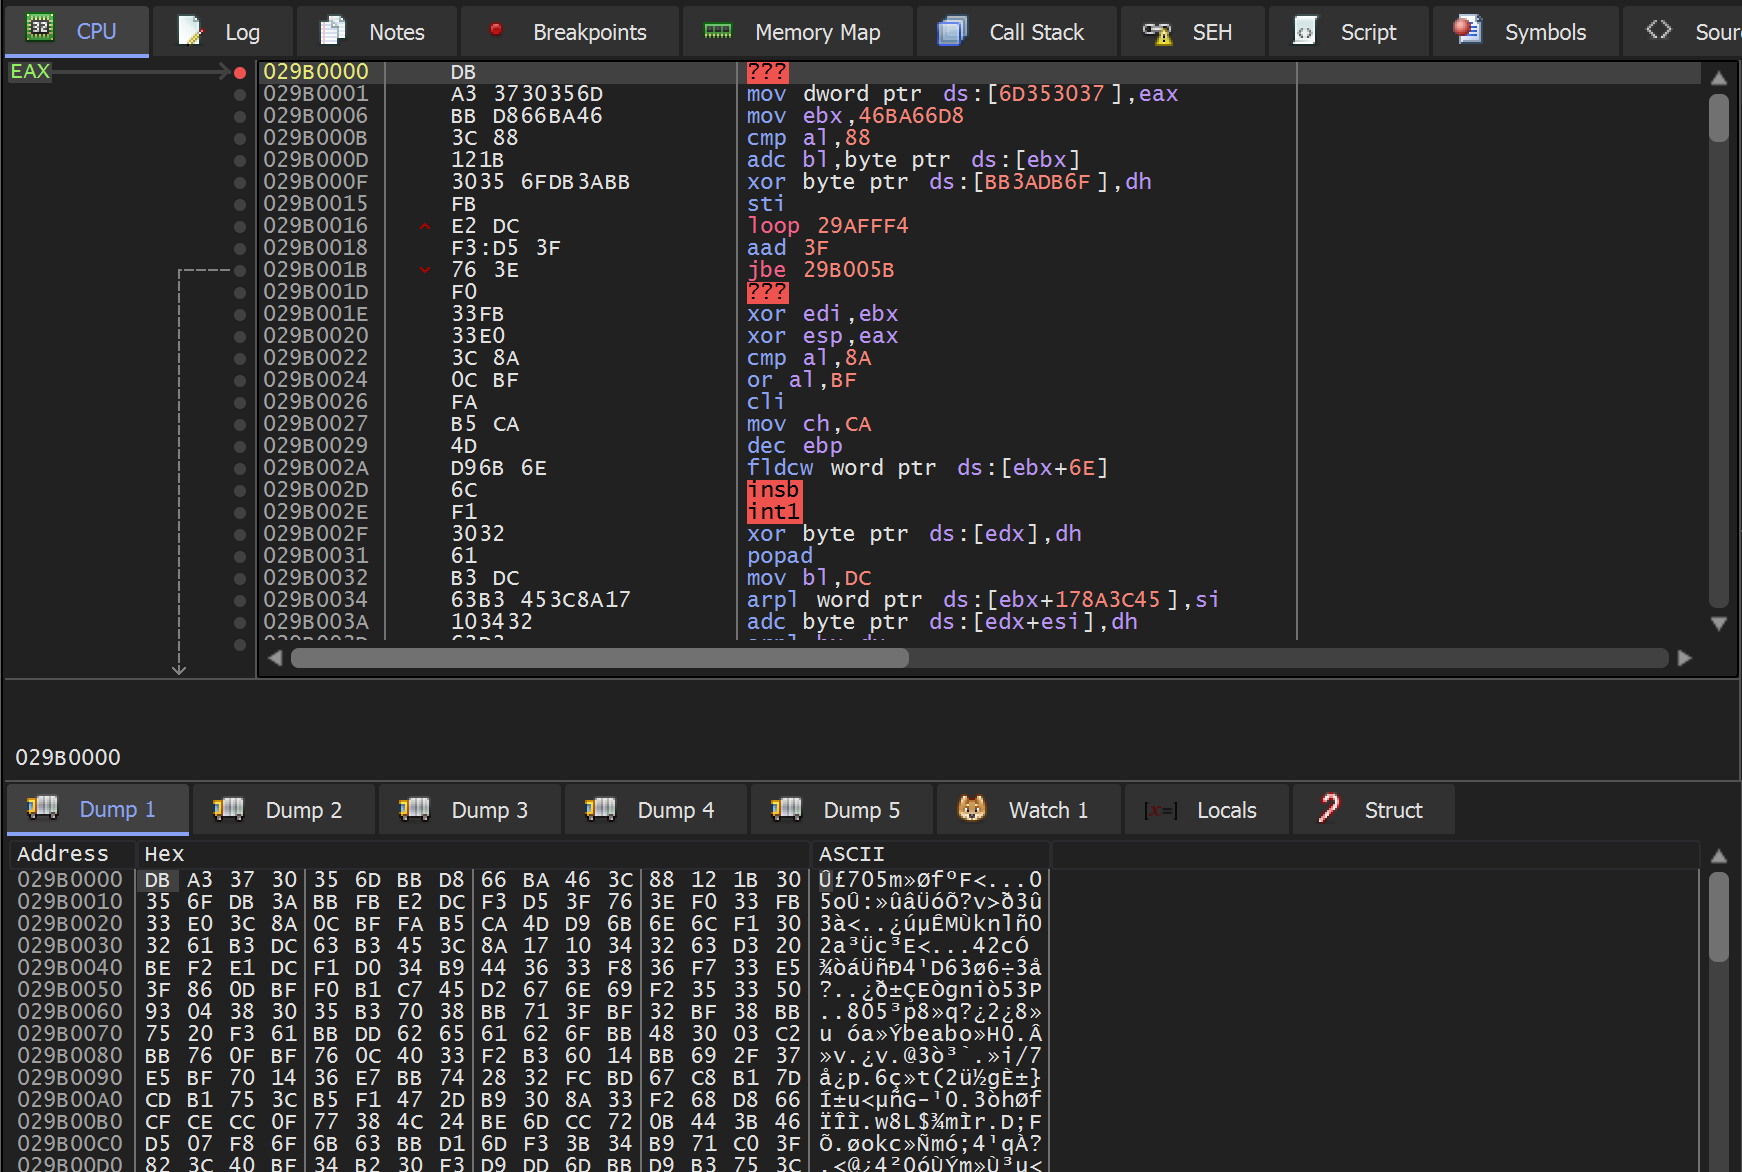
In this case - the disassembled content did not look like valid shellcode. (You can usually tell this by the presence of big red ???)
I decided to continue execution.
Continuing Analysis - Locating Shellcode
Since the initial bytes did not appear to be shellcode or anything of value - I decided to continue execution.
This triggered another hardware breakpoint on the same bytes and location as before.
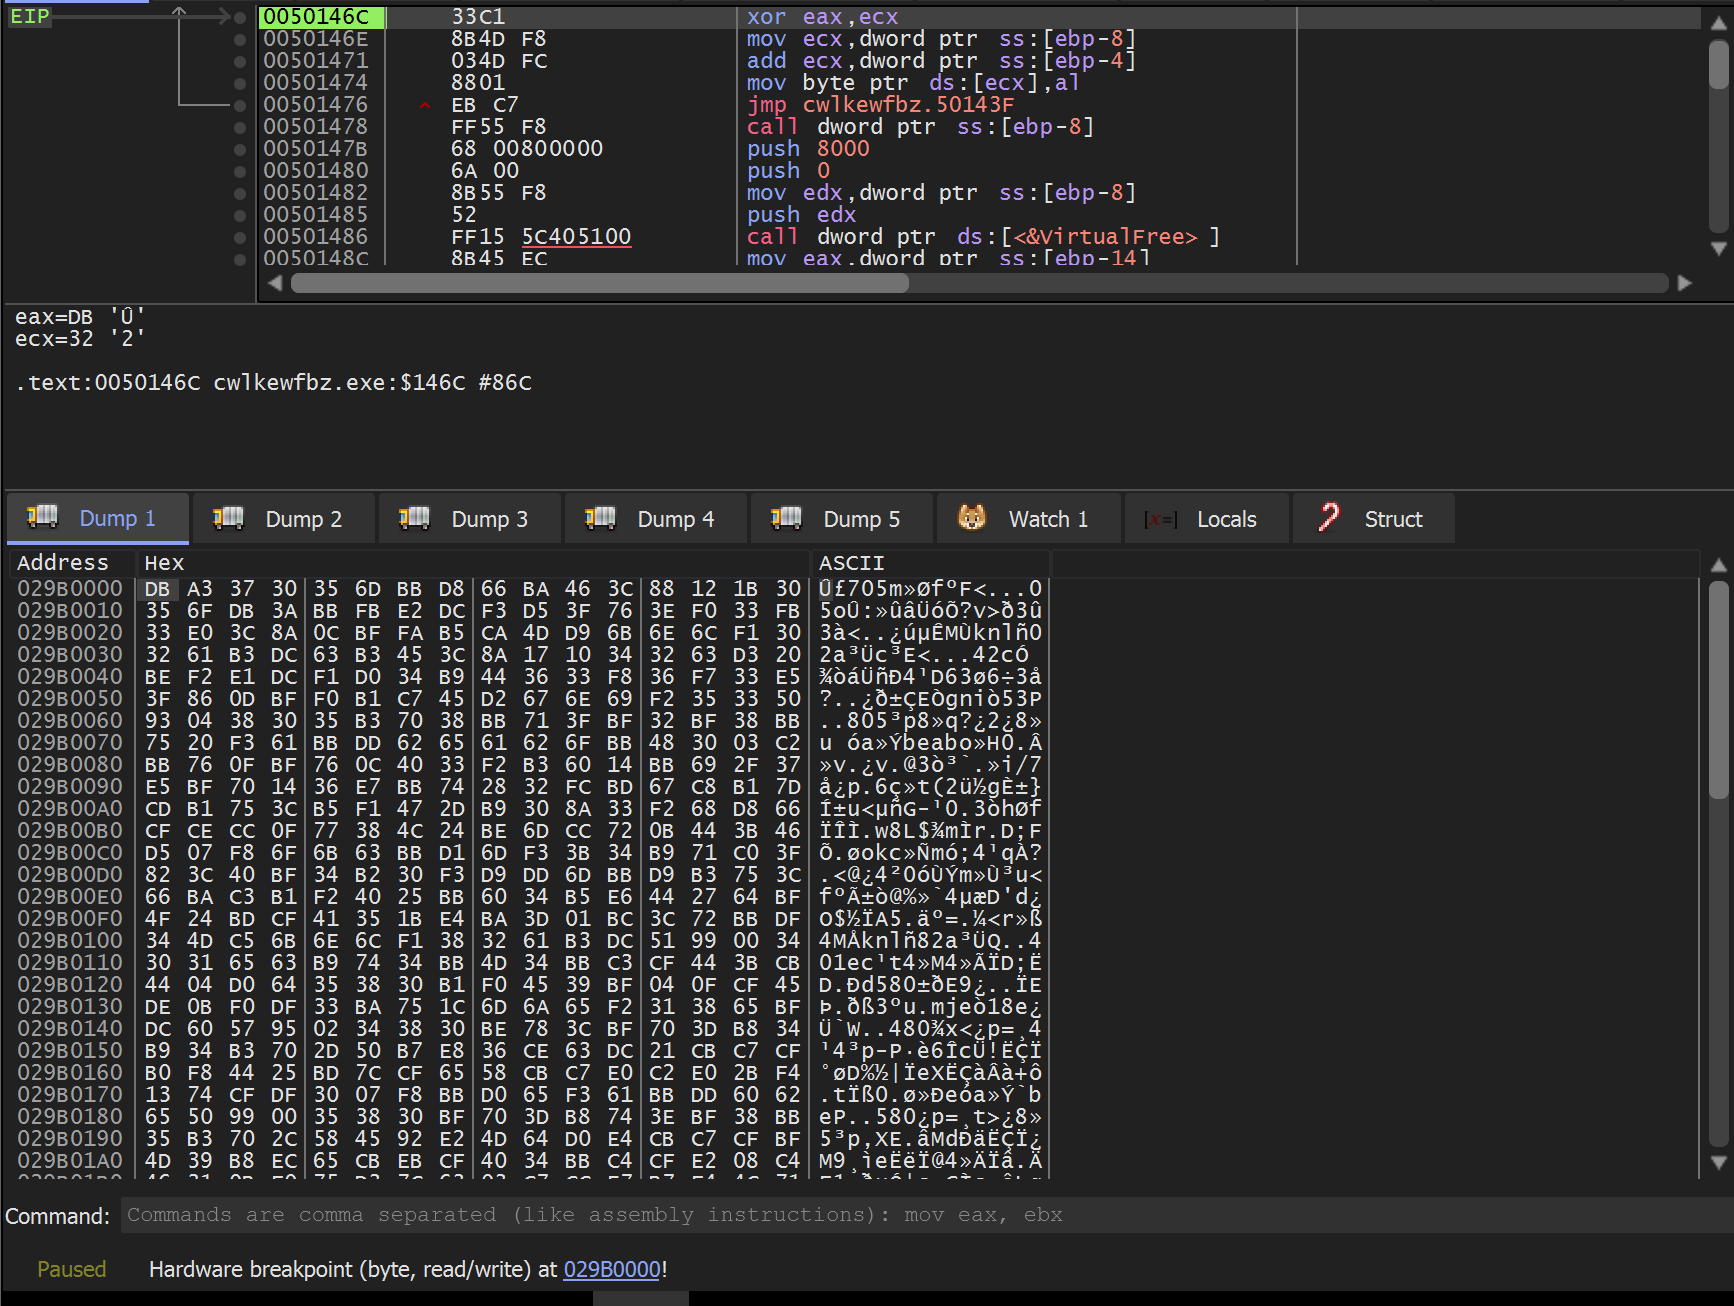
In the below screenshot - we can see EIP that an xor instruction triggered the breakpoint. This is a strong suggestion that decoding is taking place.
I then found that continuing execution did not have the intended result that I wanted. The data was decoded as expected, but a hardware breakpoint was not triggered when the first byte was executed.
Hence - the resulting shellcode was able to execute without triggering a breakpoint.
To solve this - I went back to Ghidra and checked where the buffer was being executed.
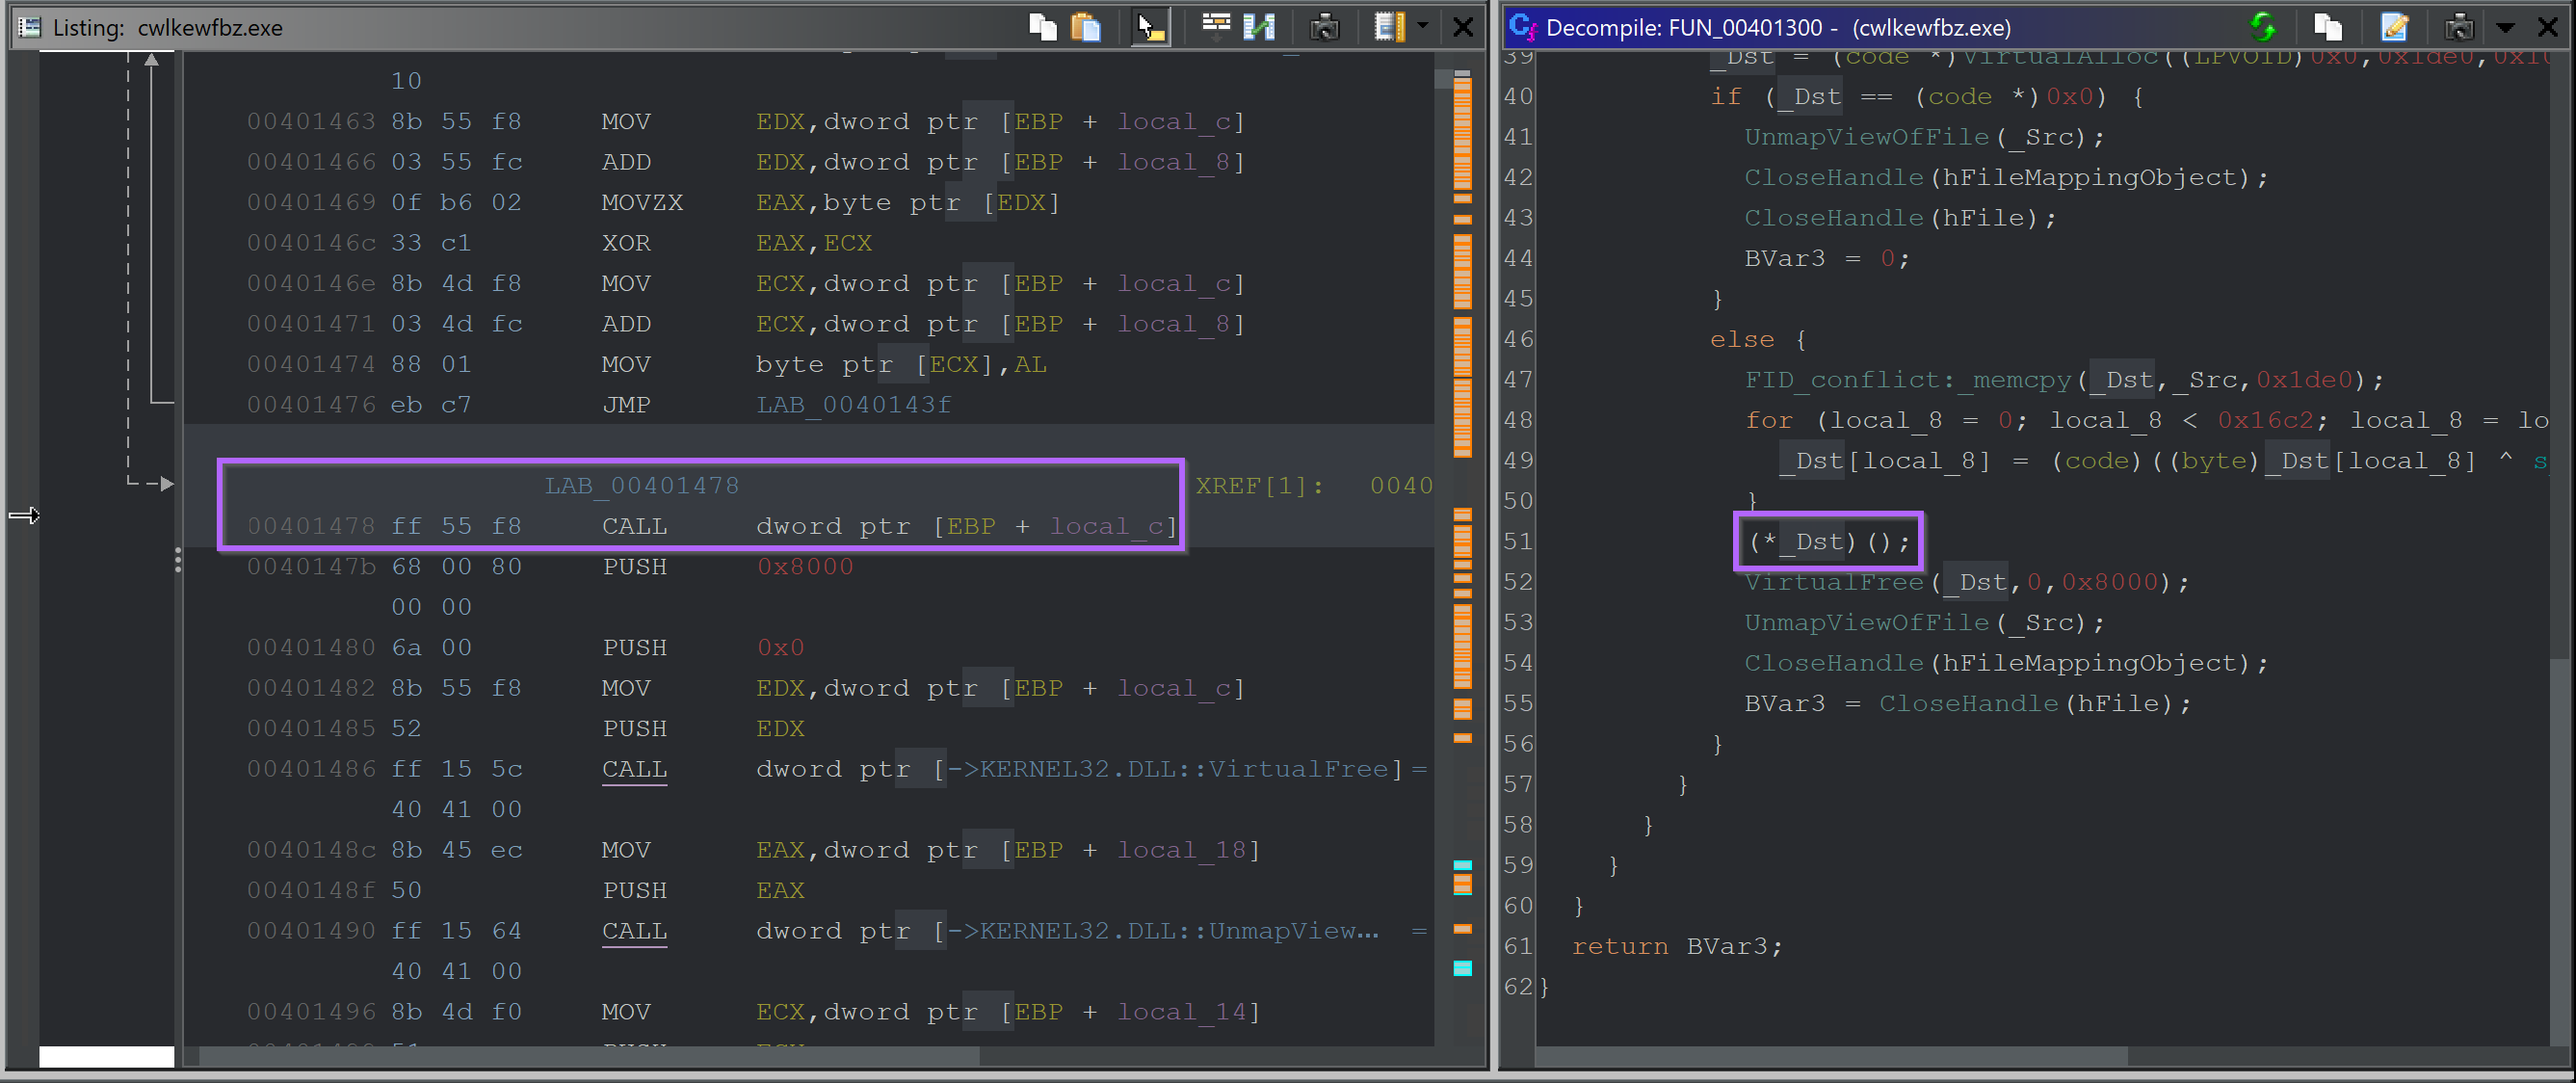
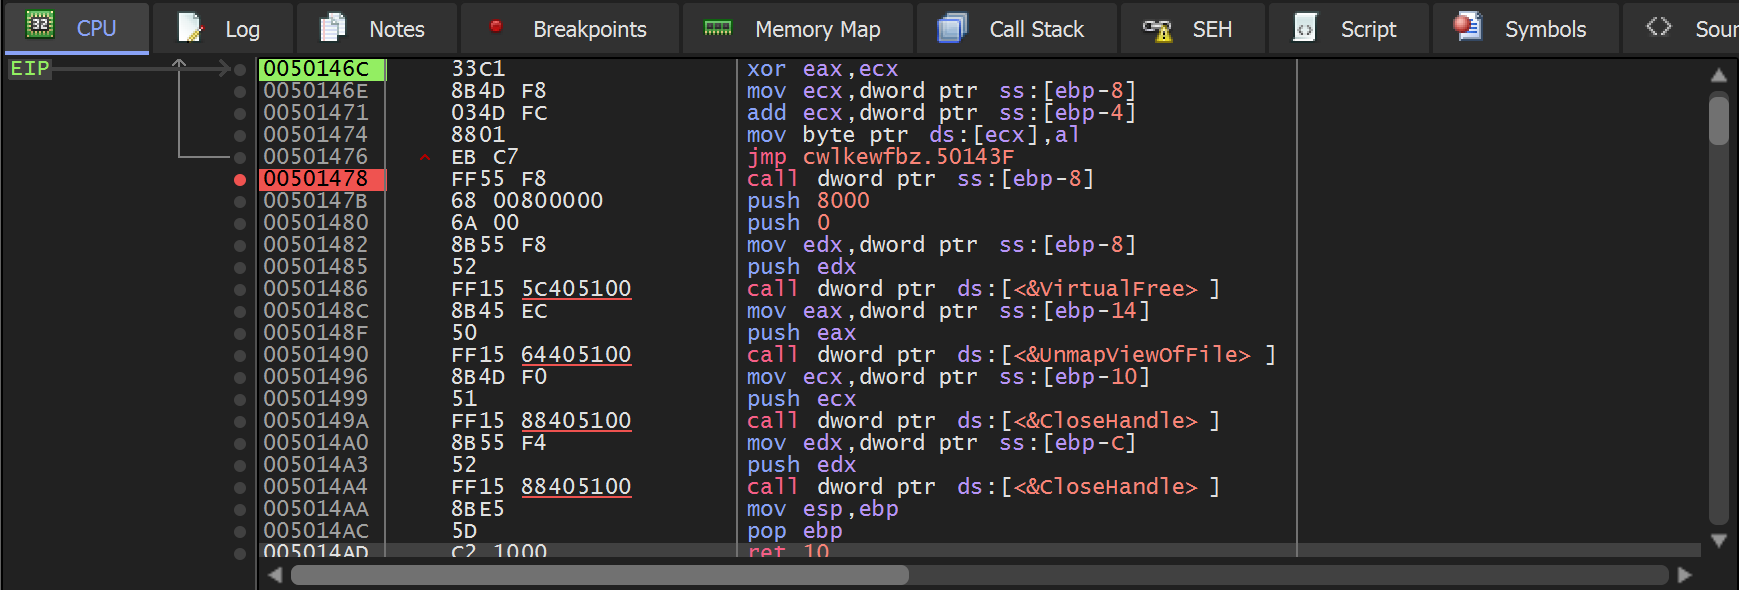
I then manually set a breakpoint on this address (the one containing the CALL) so that I could obtain the buffer just prior to it being executed.
This was only a few instructions after the second hardware breakpoint was triggered.
(TLDR: once you hit the second hardware breakpoint, the CALL address will already be in your disassembly window, about 6 lines after EIP)
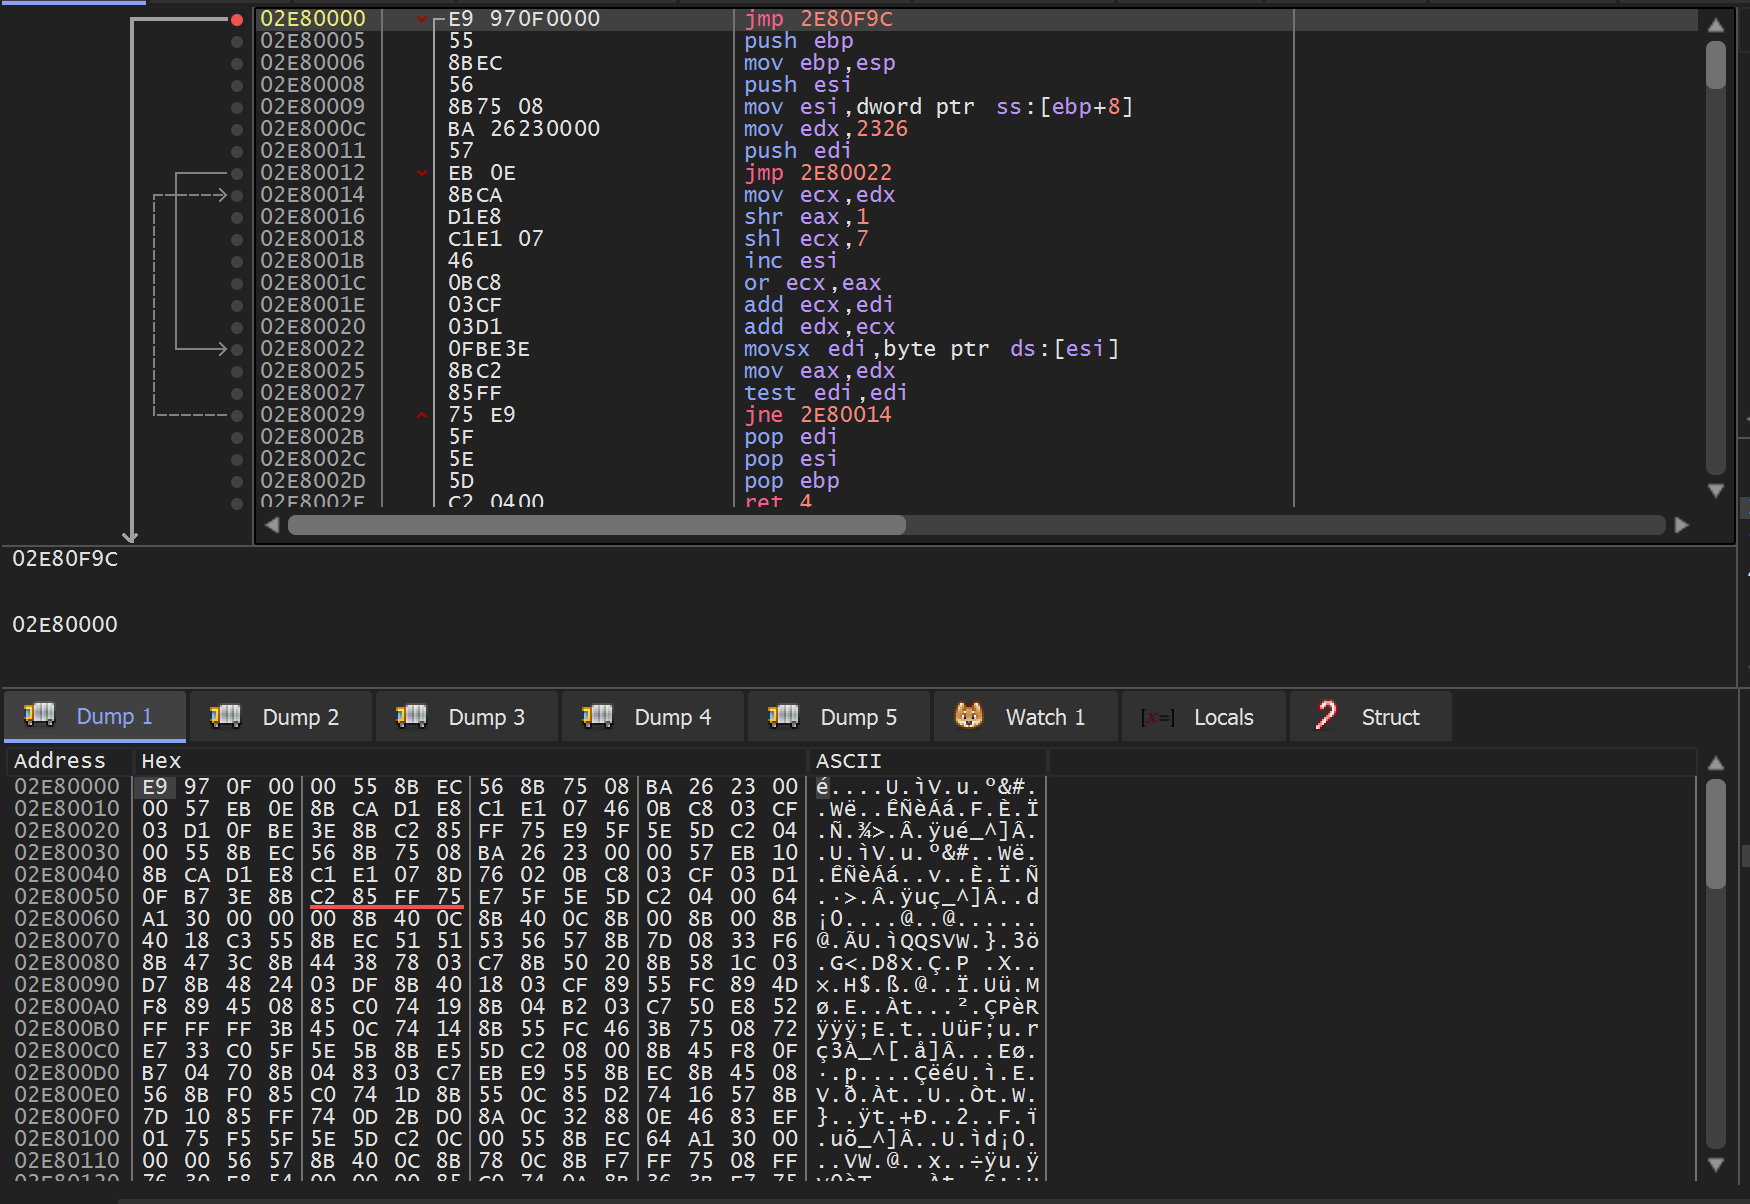
Allowing the Malware to continue to execute until the CALL. We can see a new buffer in the dump window E9 97 0f 00
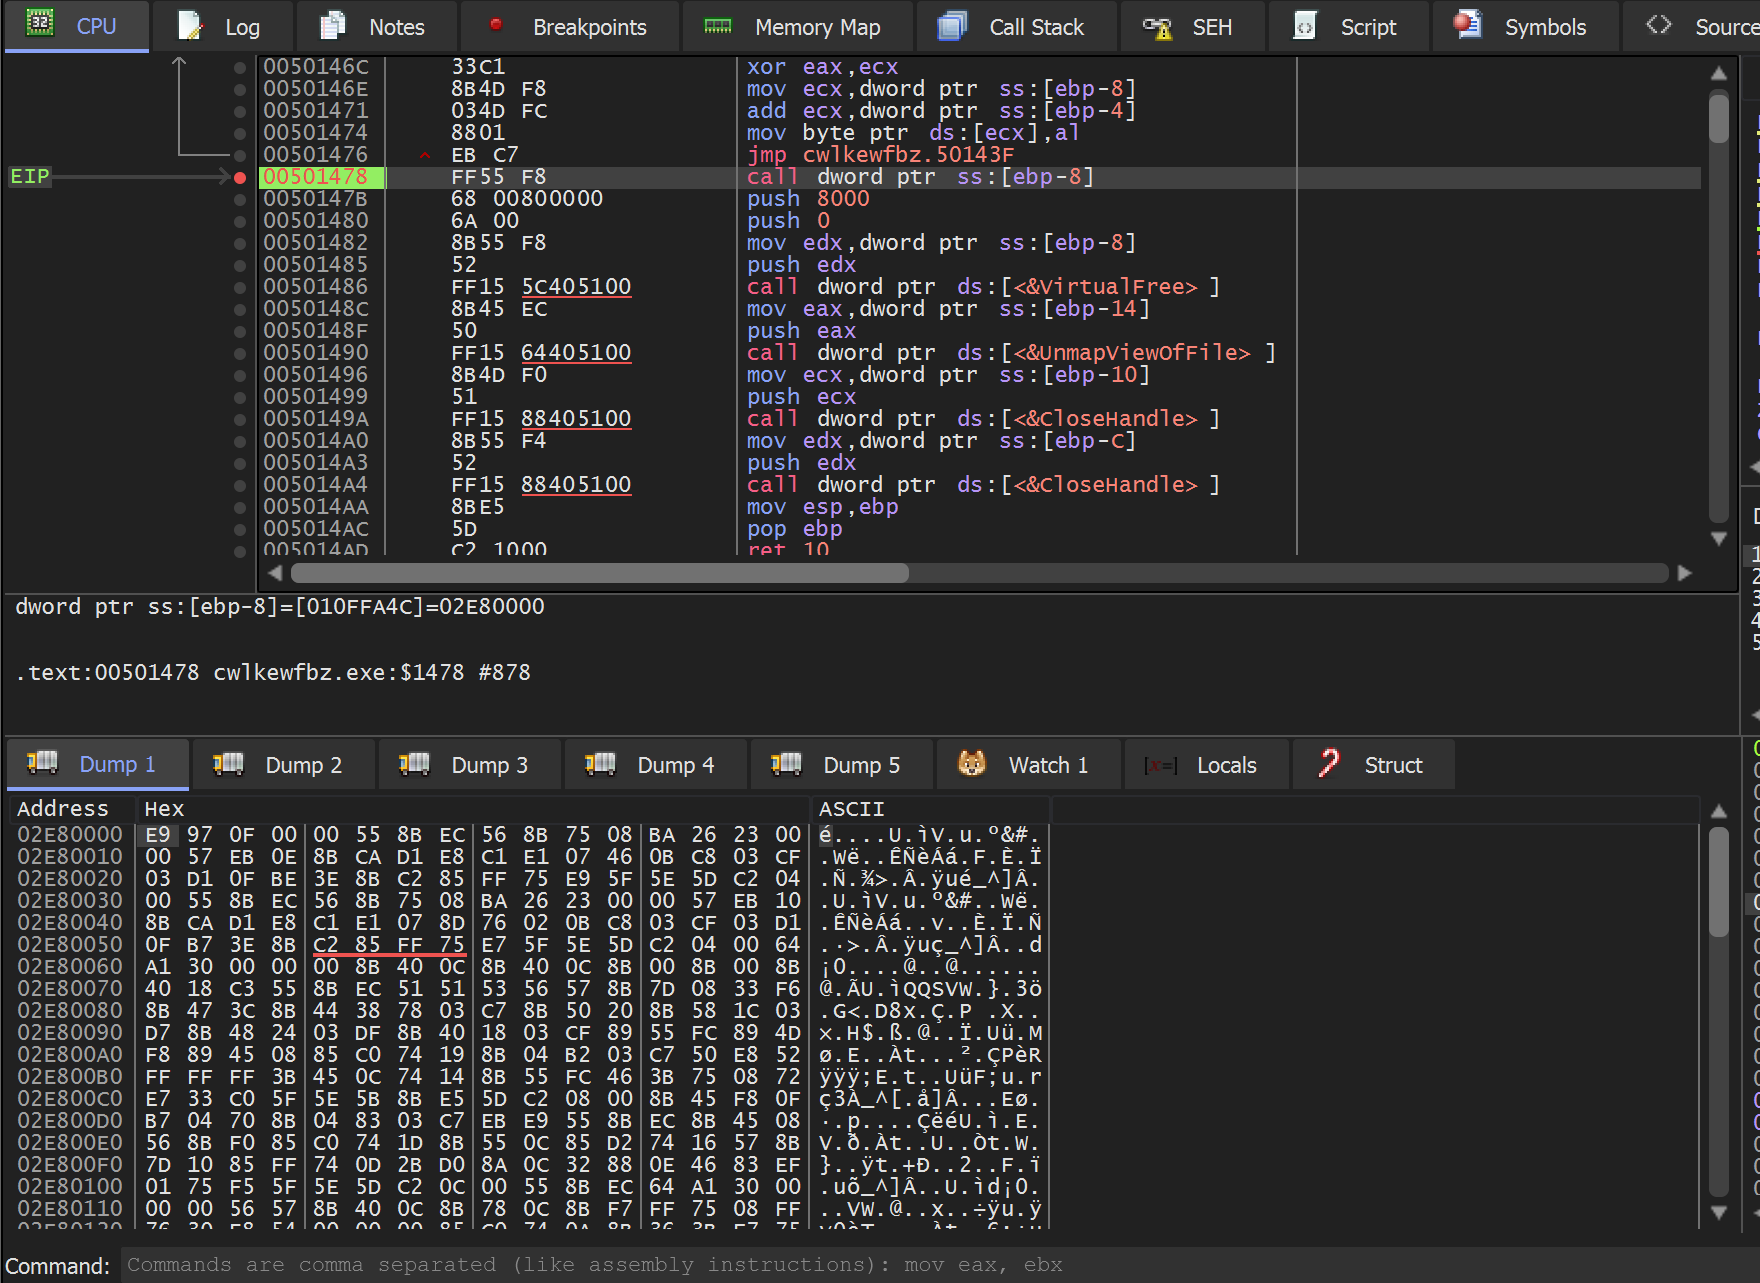
We can validate that this is shellcode by using Follow in Disassemblerto view the contents as disassembled code.
This time there are no glaring red ??? or other shenanigans.
At this point, you could allow the shellcode to execute. However, we will be analyzing the shellcode manually.
Continuing execution at this point will trigger breakpoints on api’s that are shared between the shellcode and initial cwlkewfbz.exe which is still loaded into x32dbg. If you continue execution this way - you can generally continue to debug the shellcode as if it were a regular process. The drawback is that you will not trigger breakpoints on any new api’s imported and/or executed by the shellcode.This section was admittedly confusing. If you have gotten lost at any point, restart the process and set a Hardware Breakpoint (Execute) on the return value from VirtualAlloc. This will take you straight to the current point of analysis.
How to Save Shellcode Using X32dbg
Since this is an education-focused post - I will instead be dumping the shellcode and analyzing it manually.
You can do the same by reaching the point where the shellcode is executed.
Then selecting Follow in Memory Map and Dump Memory to File
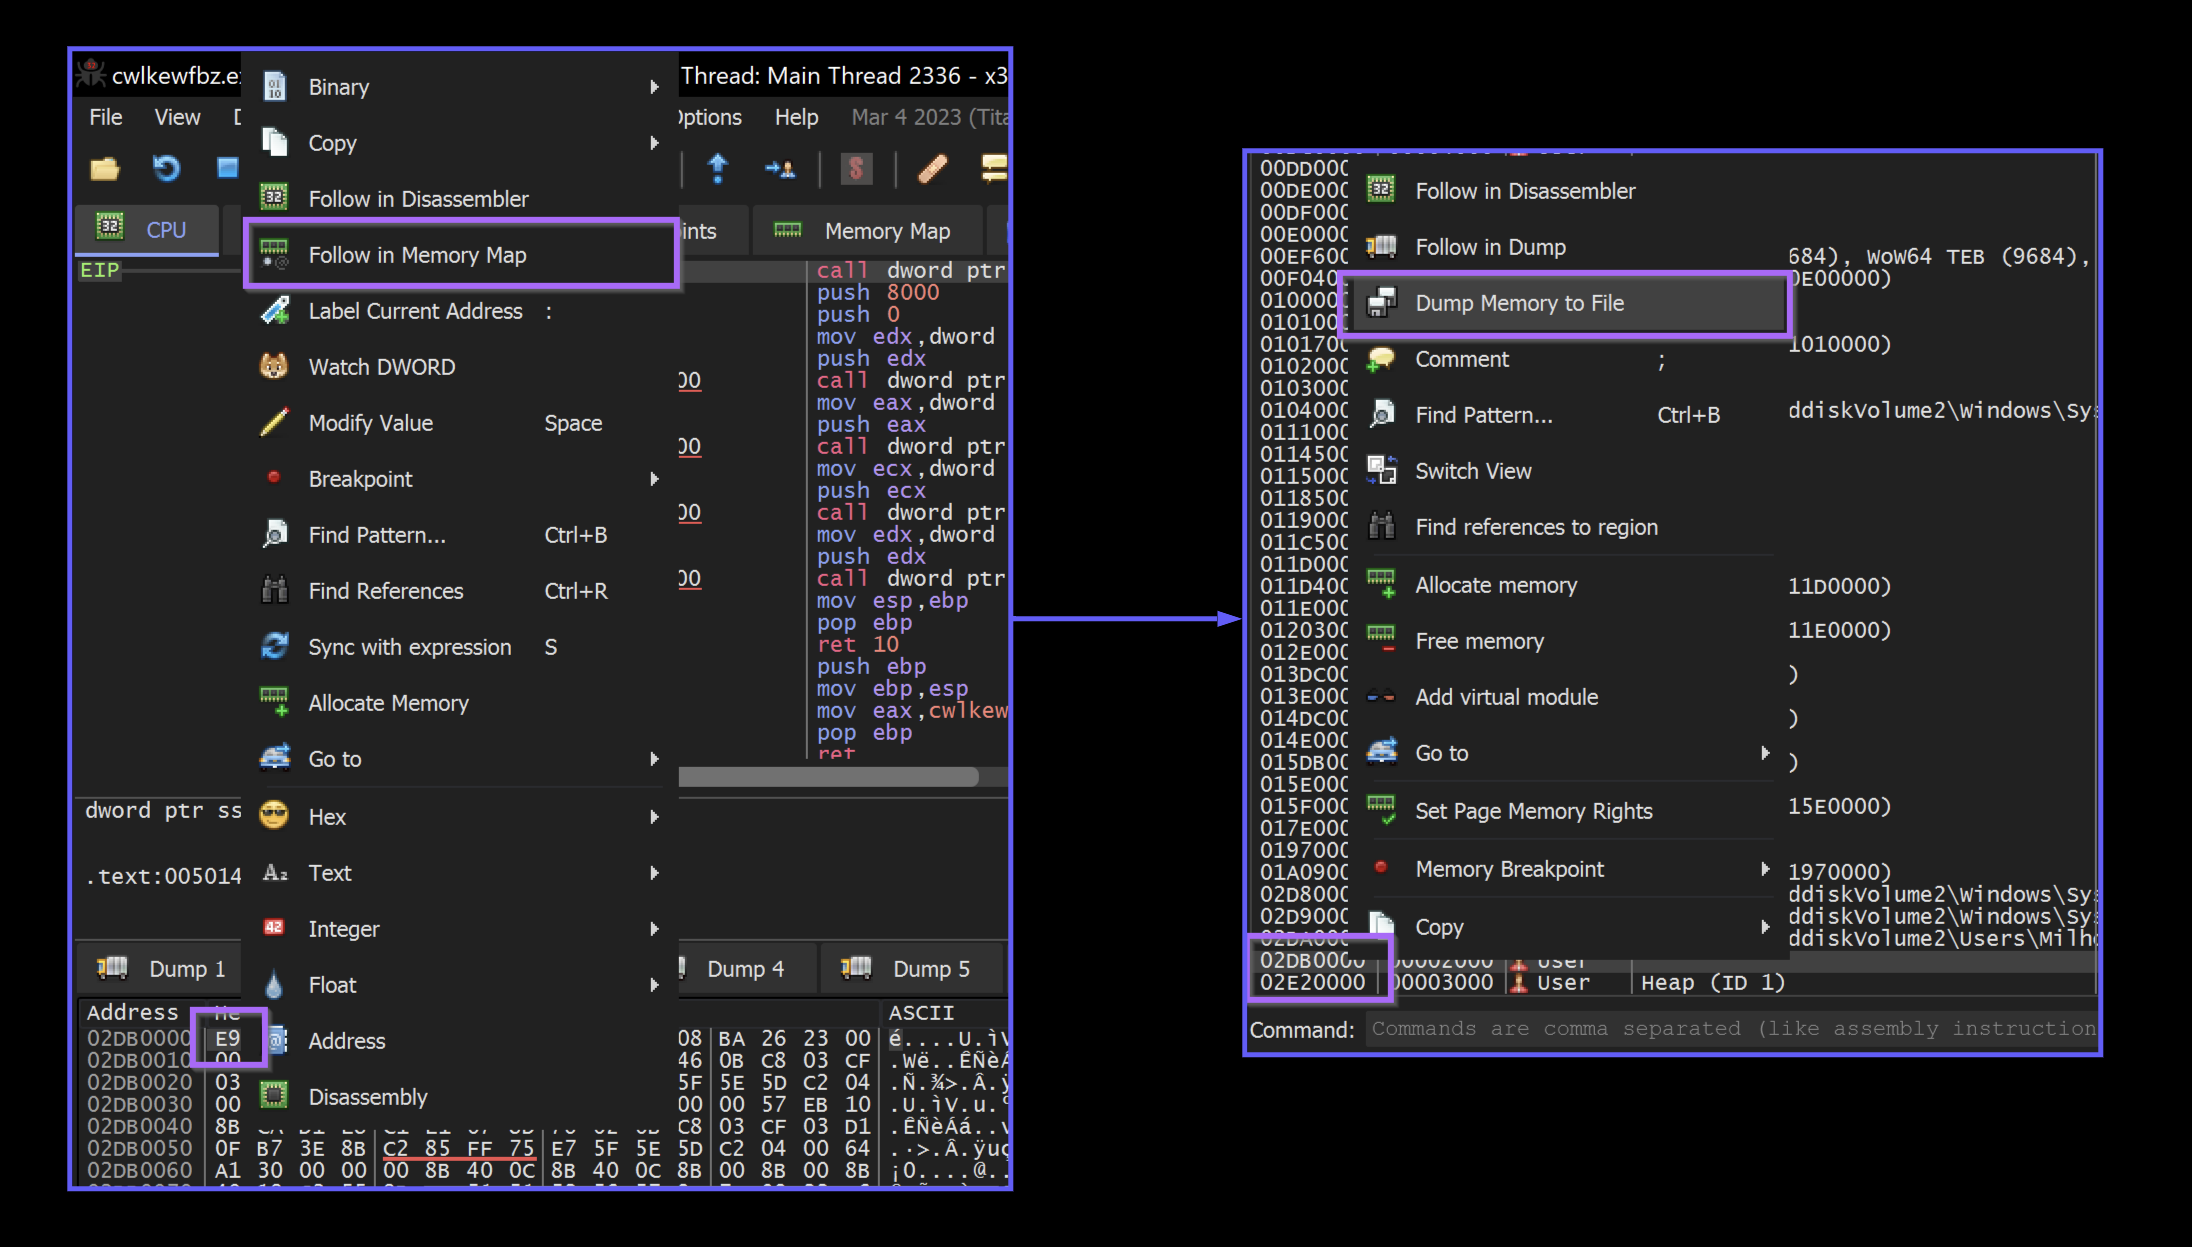
I then saved the content as shellcode.bin
How to Manually Analyse the Shellcode
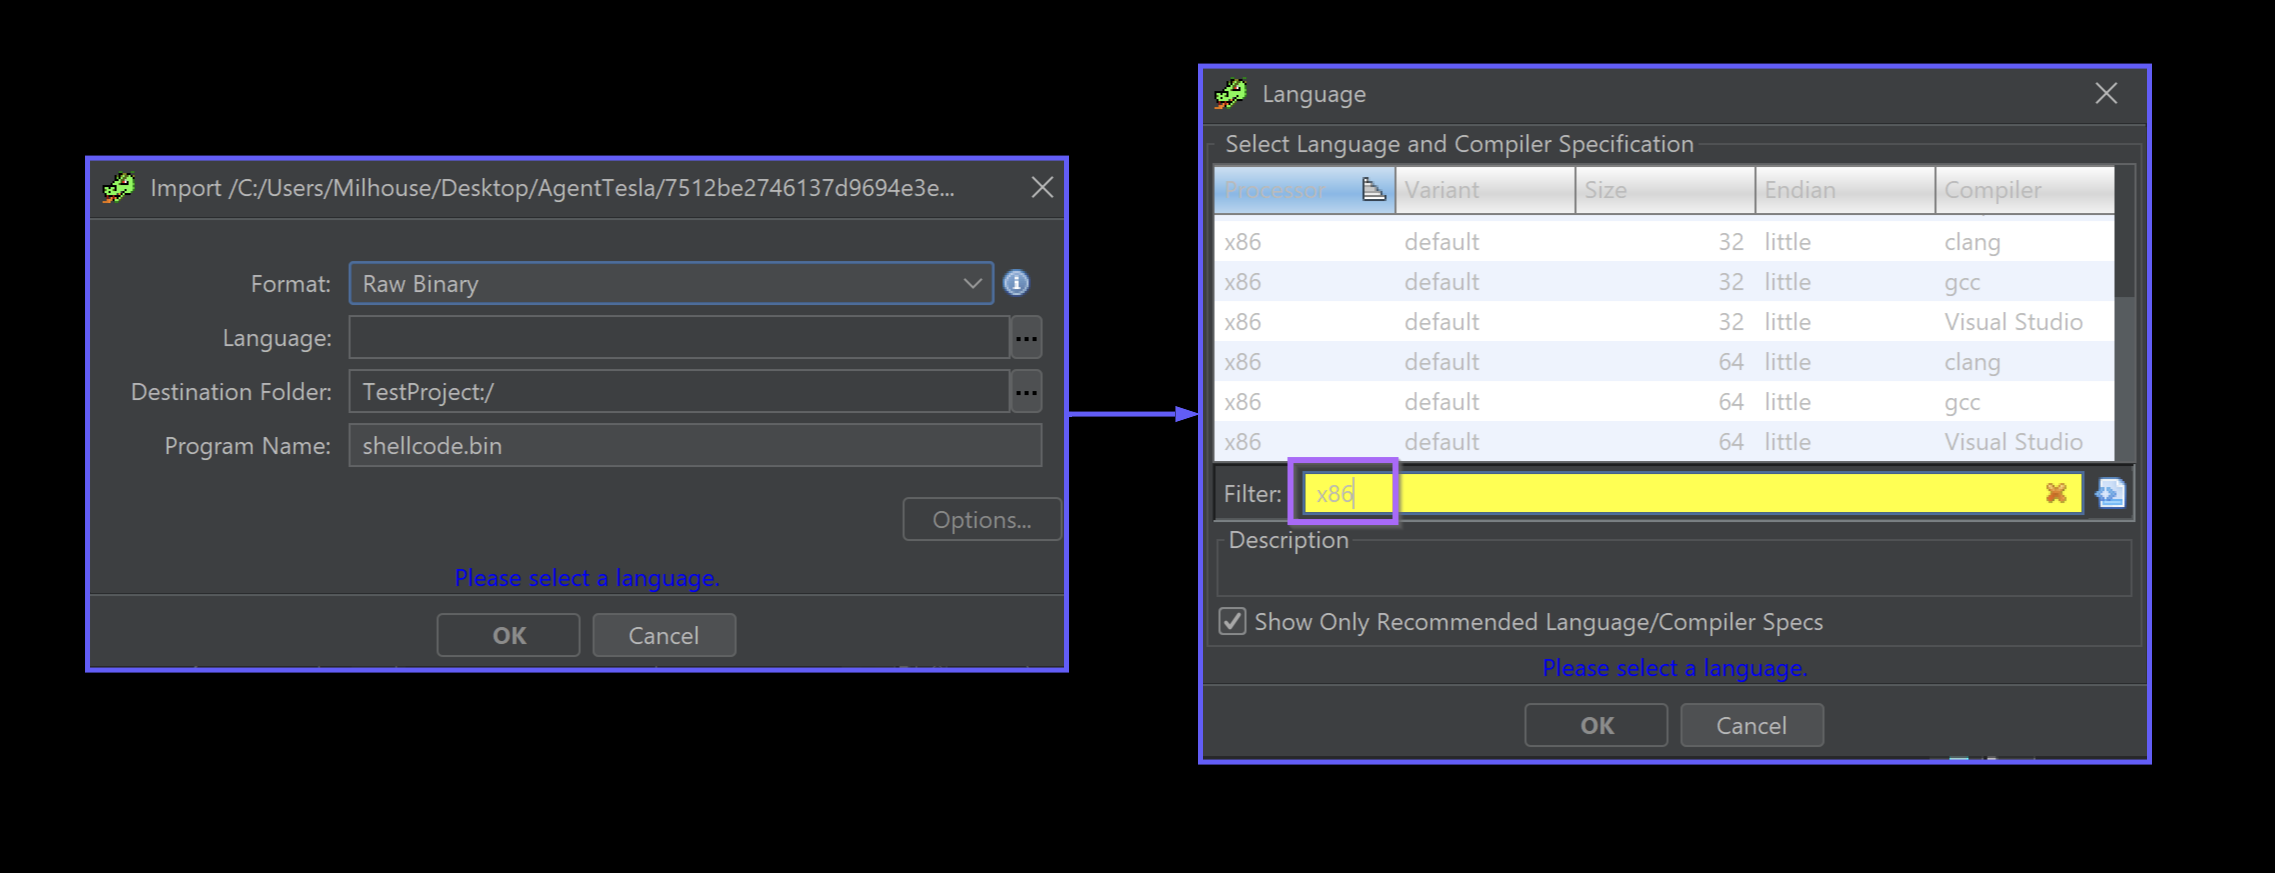
At this point, I loaded the shellcode.bin file into Ghidra for further analysis.
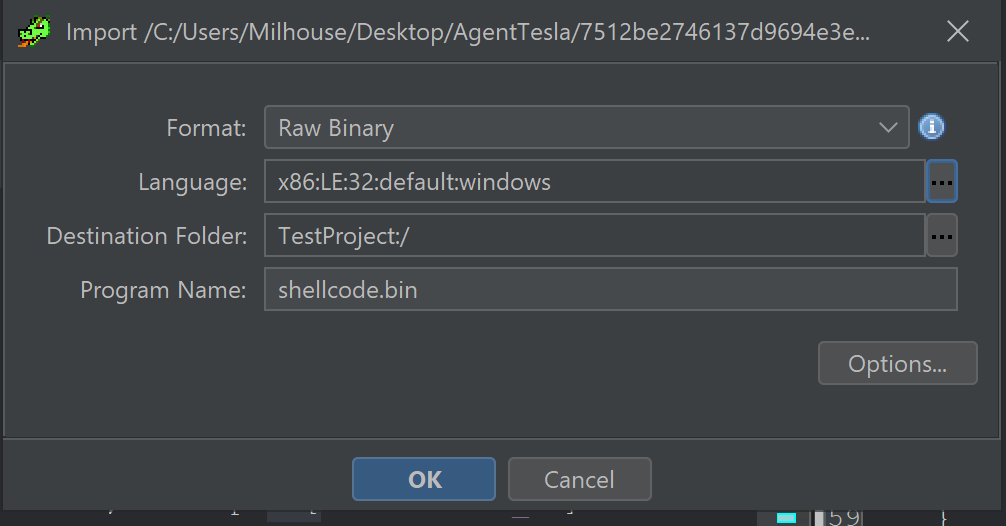
Since this is shellcode - The architecture will need to be manually speAnalysiso that Ghidra can load it successfully.
For the majority of Windows shellcode you will encounter. You can simply enter x86 into the filter. Then select a size based on the architecture of process which initially loaded the shellcode.
In this case - the initial file cwlkewfbz.exeis LE (little endian) and 32-bit. This information can be obtained using detect-it-easy.
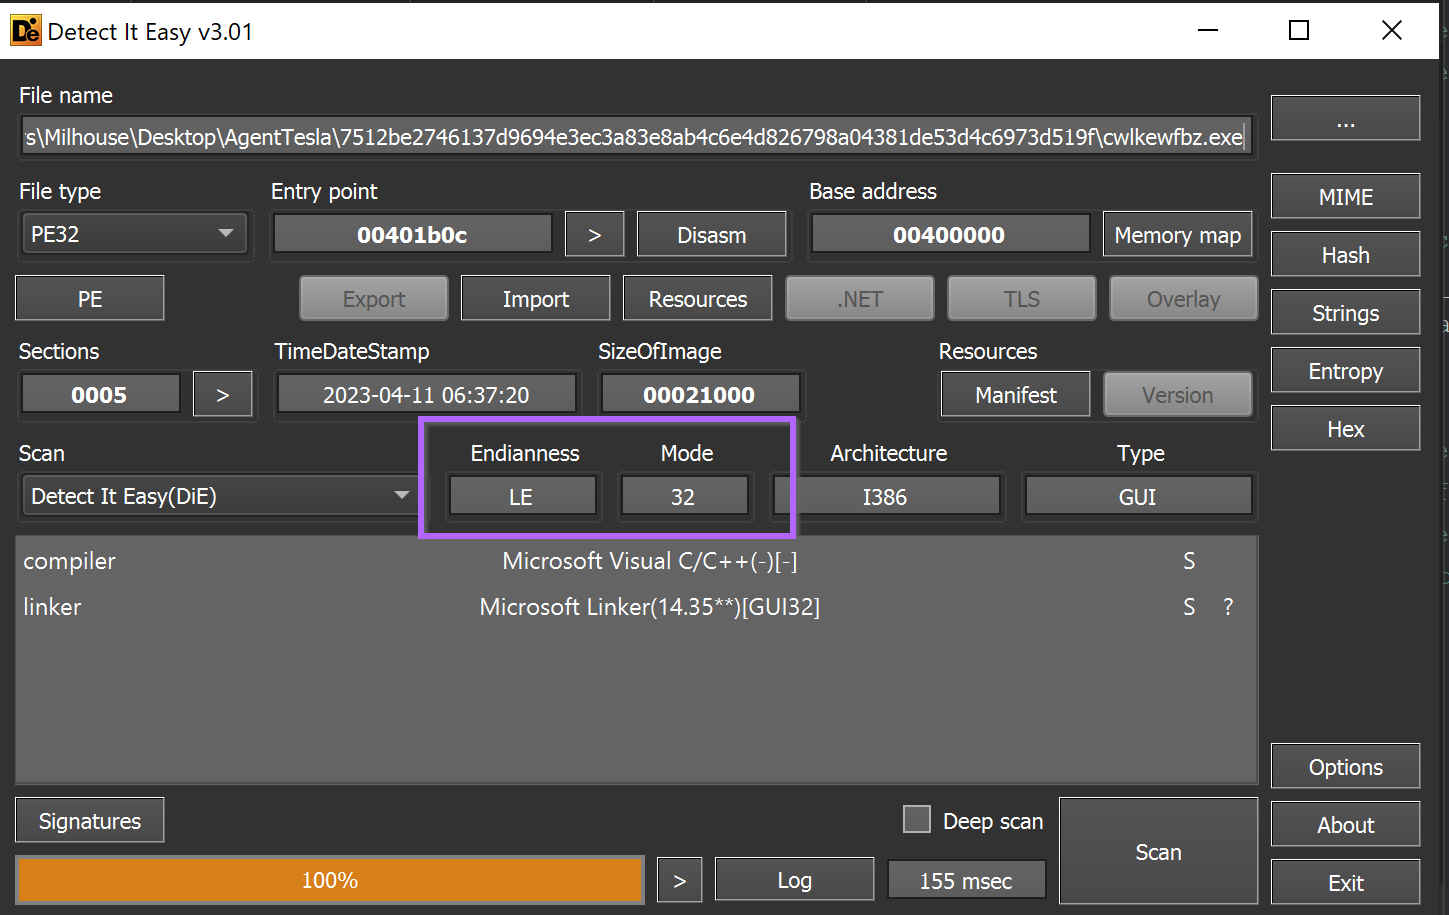
Any option that is both little and 32-bit will be suitable.
I have generally found that the Compiler column makes no difference for shellcode. Only the Endian , Size and Processor columns matter.
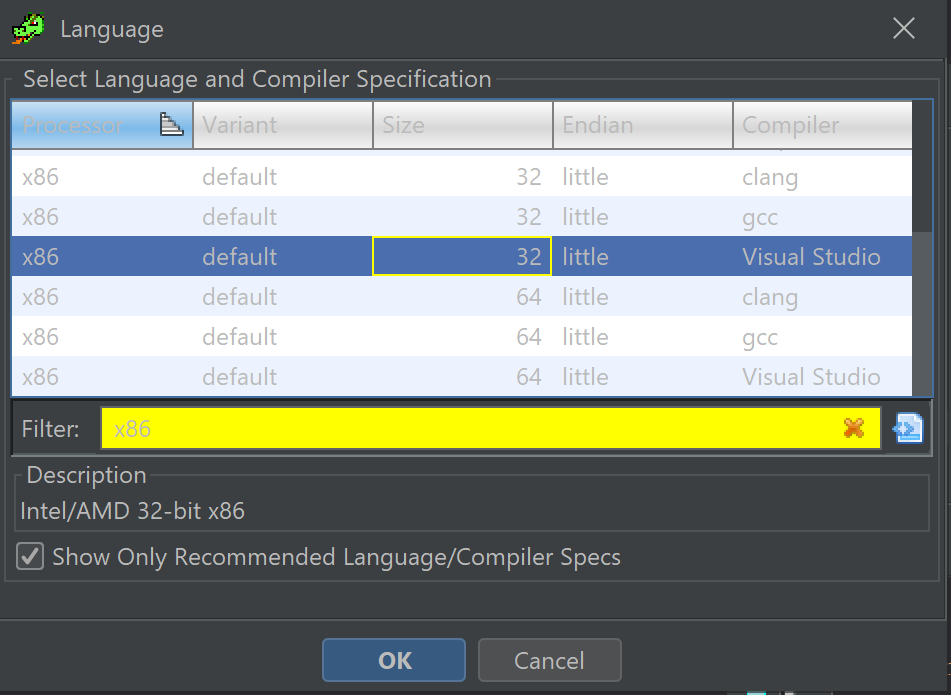
Once the options have been selected - you can click ok and continue (OK) with the file analysis.
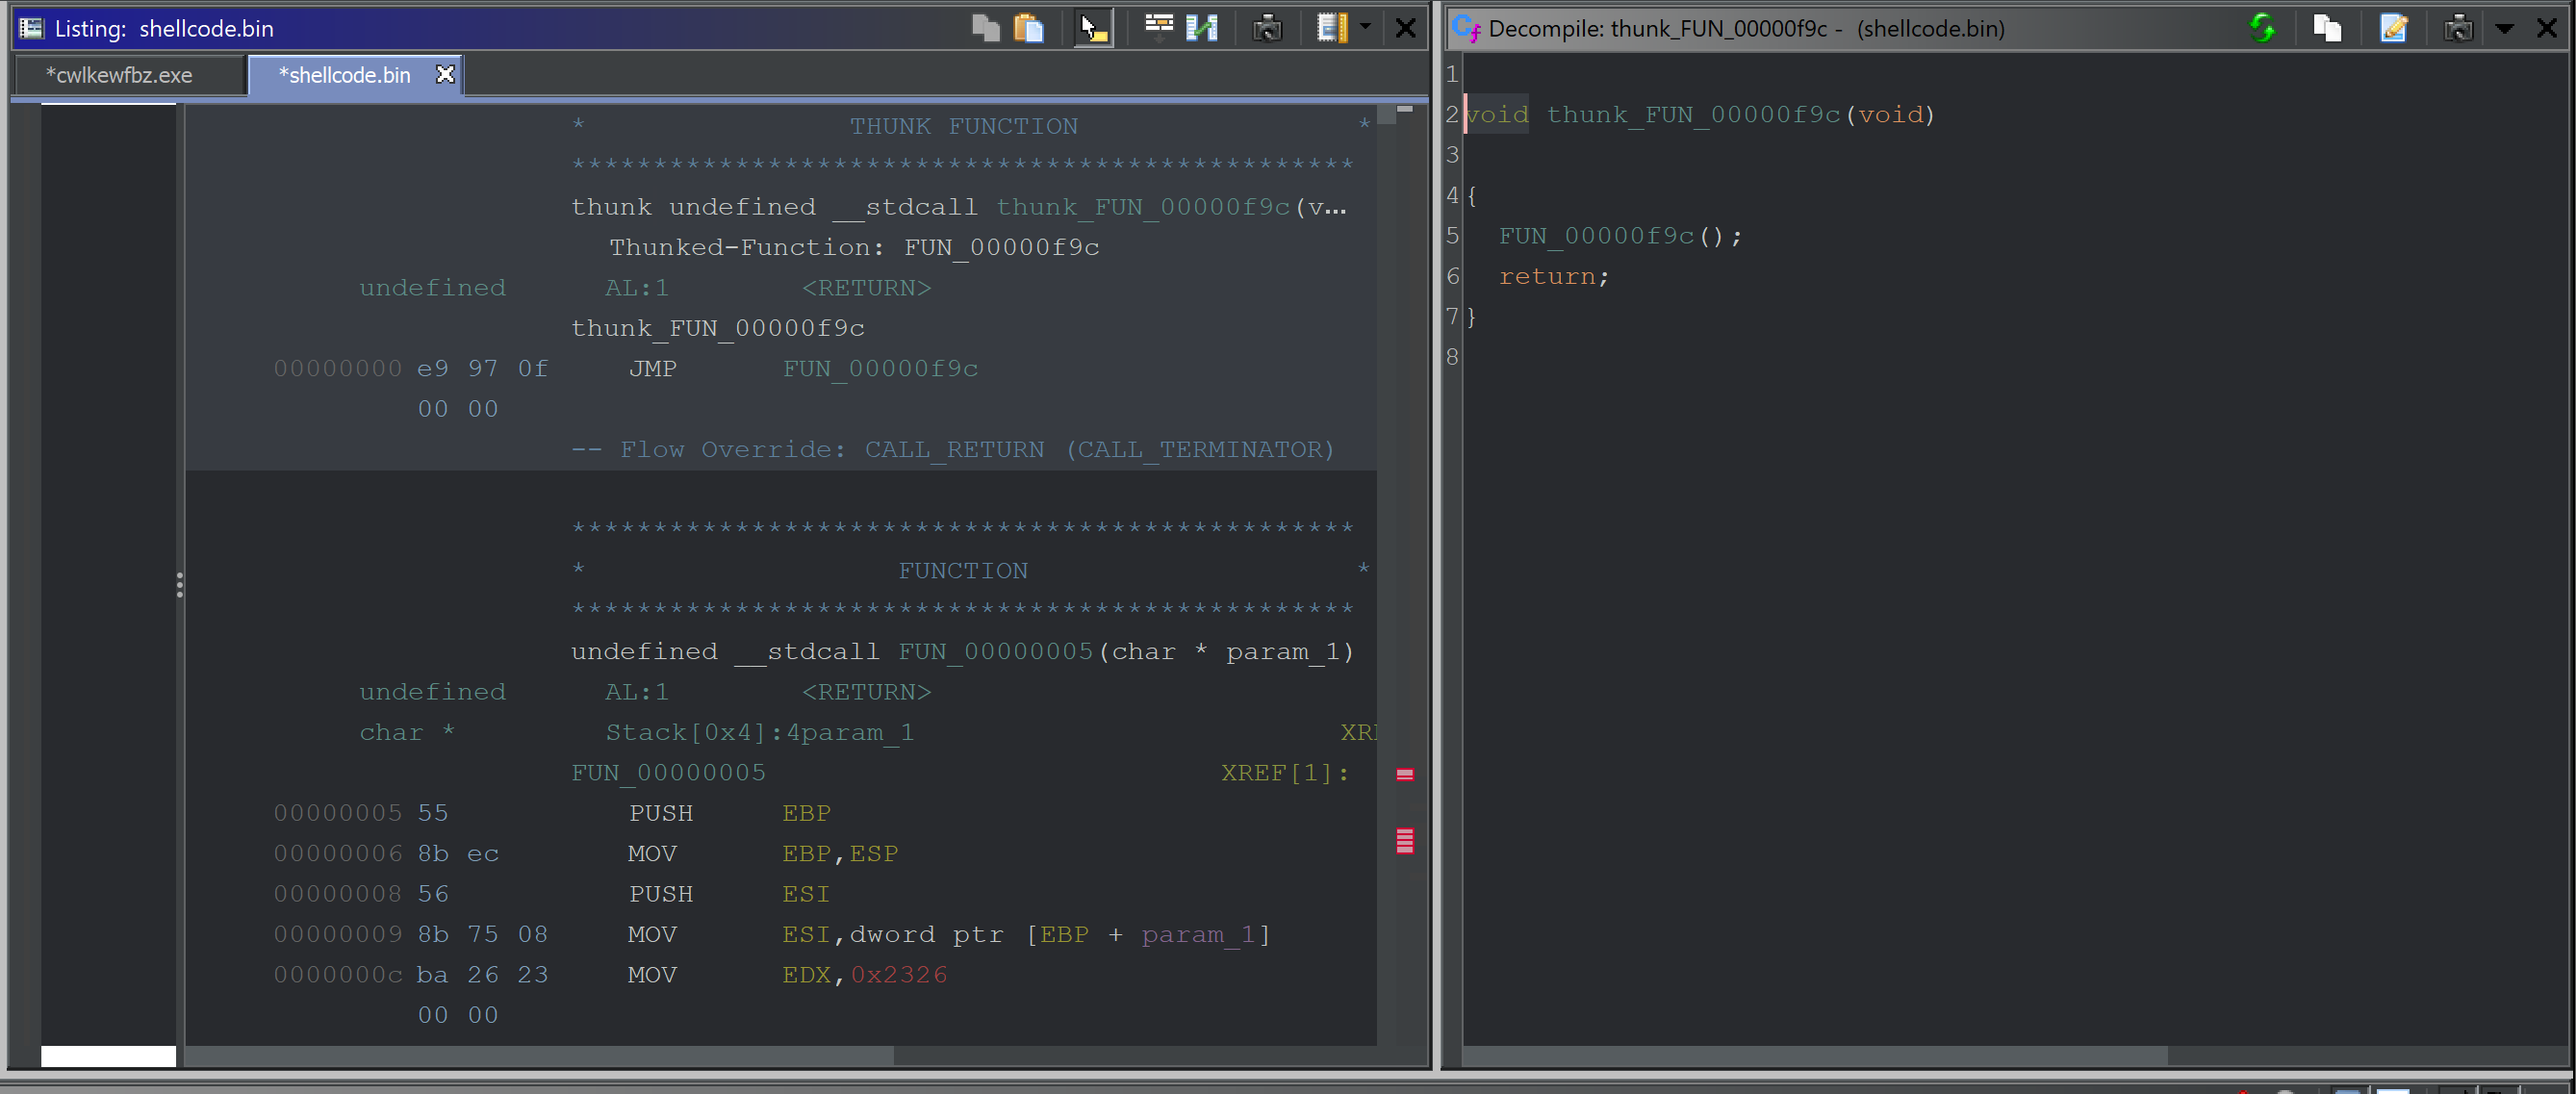
Once completed - Ghidra will proceed to decompile the code and it should look like this. Note how there are functions and annotations in both the decompiler and disassembler windows.
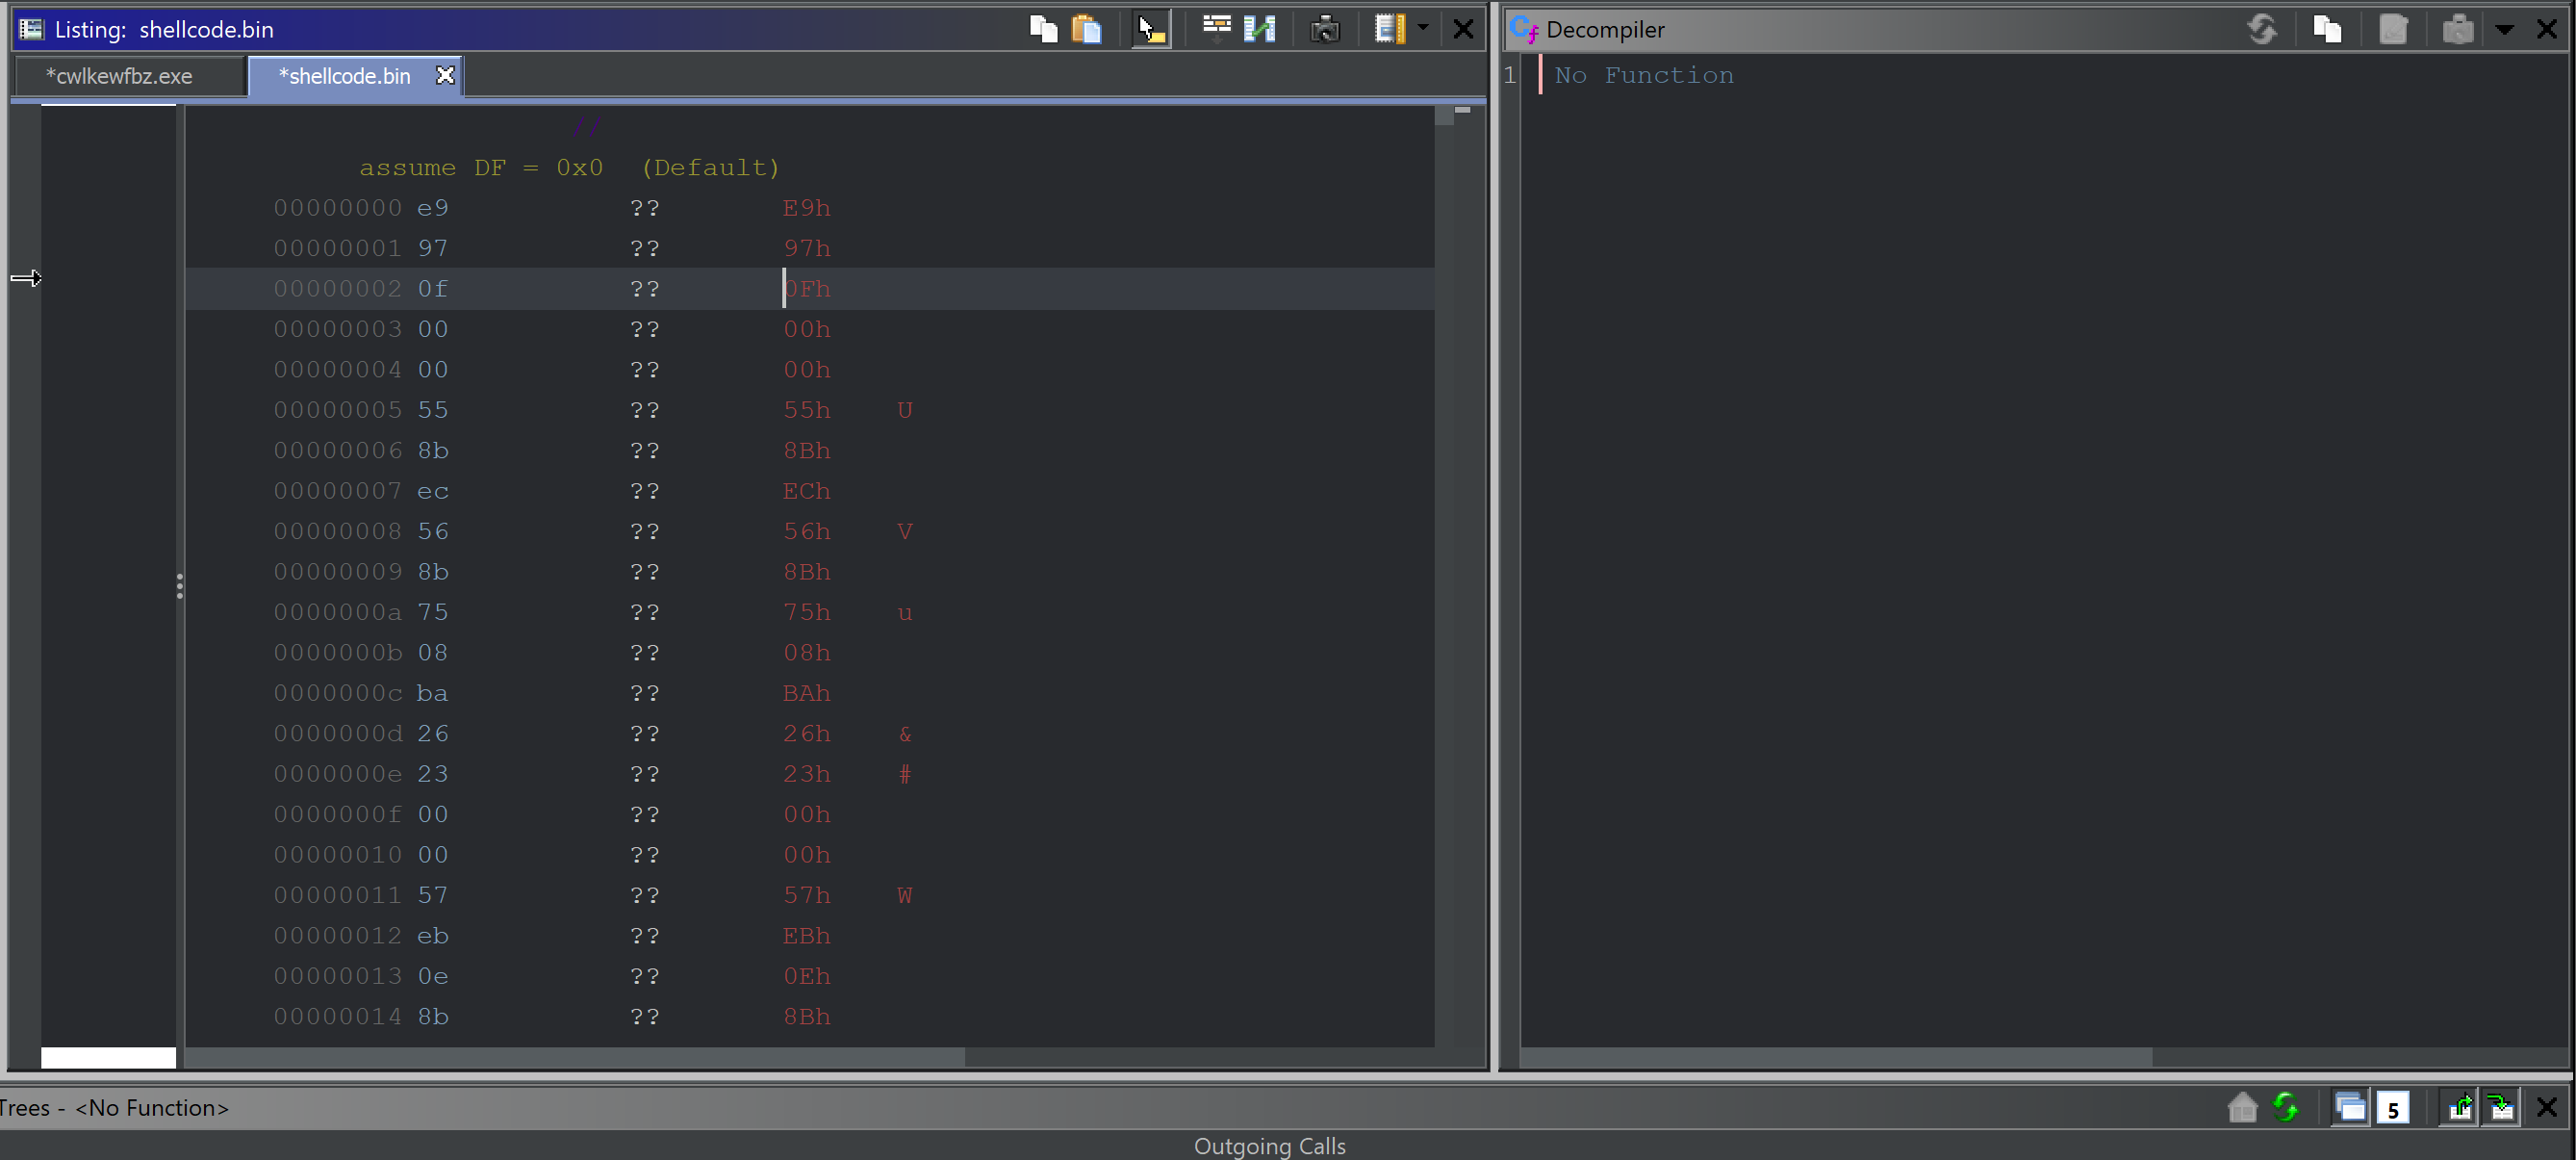
How to Force Disassembly of Shellcode With Ghidra
If there are no functions or annotations present in your shellcode, Ghidra failed to recognize the start of the code.
You can easily correct this by selecting the first byte, right-click and Disassemble.
If anything still looks funny or the decompiler window remains empty - Right-Click again and select Create Function
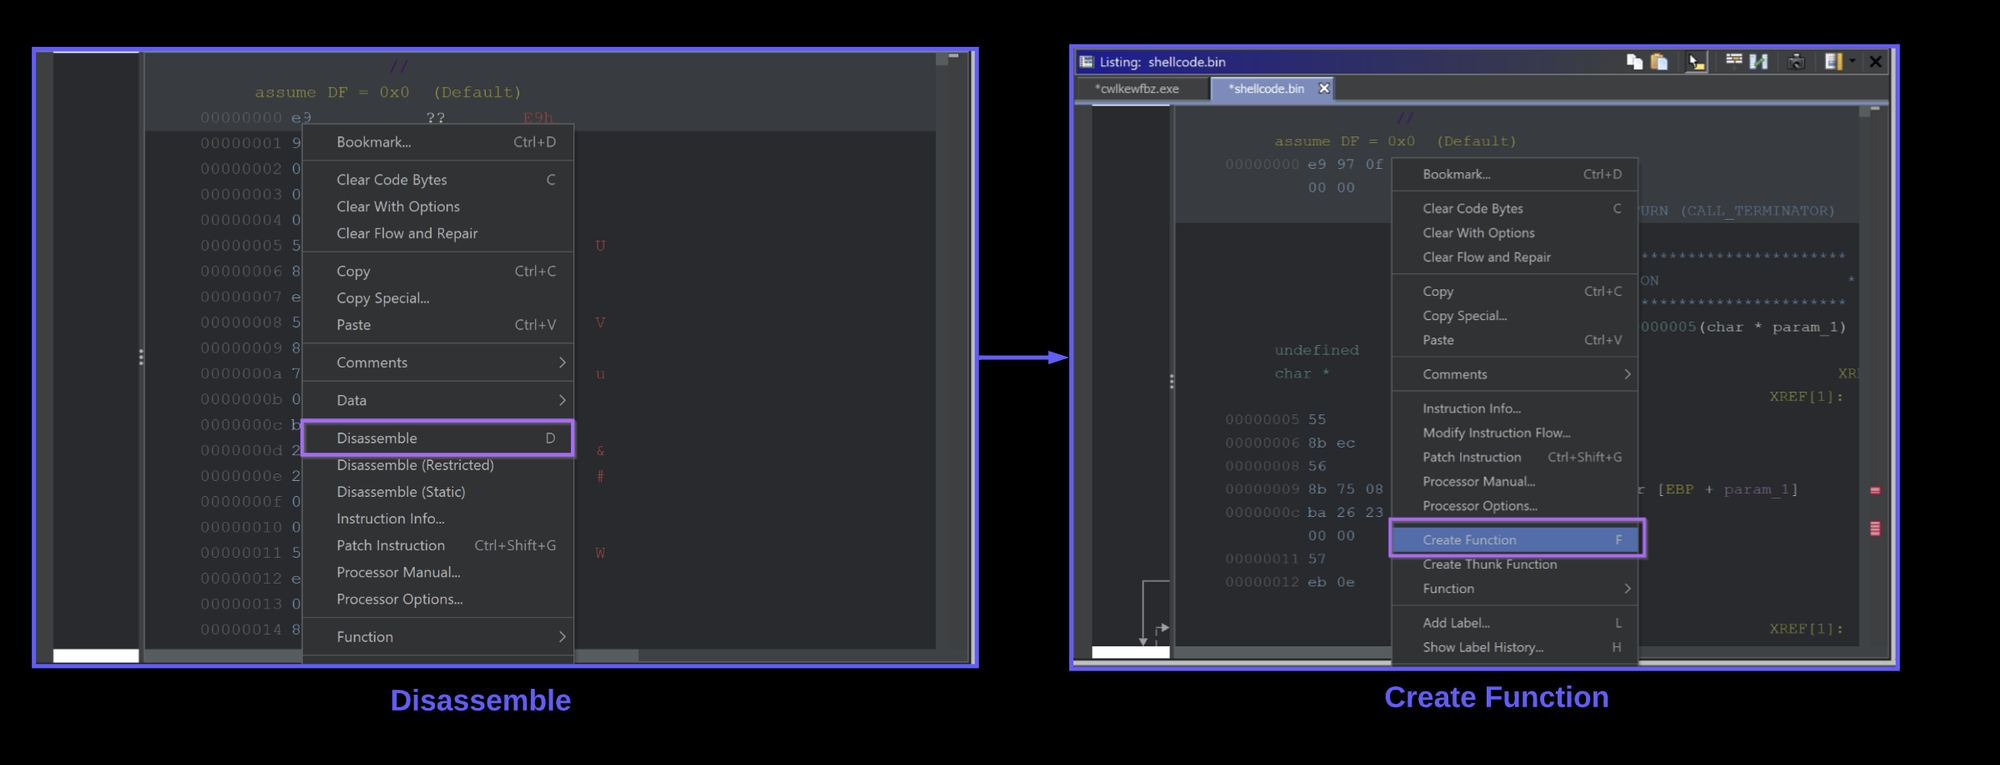
The decompiler view should go from left to right in the screenshot below.
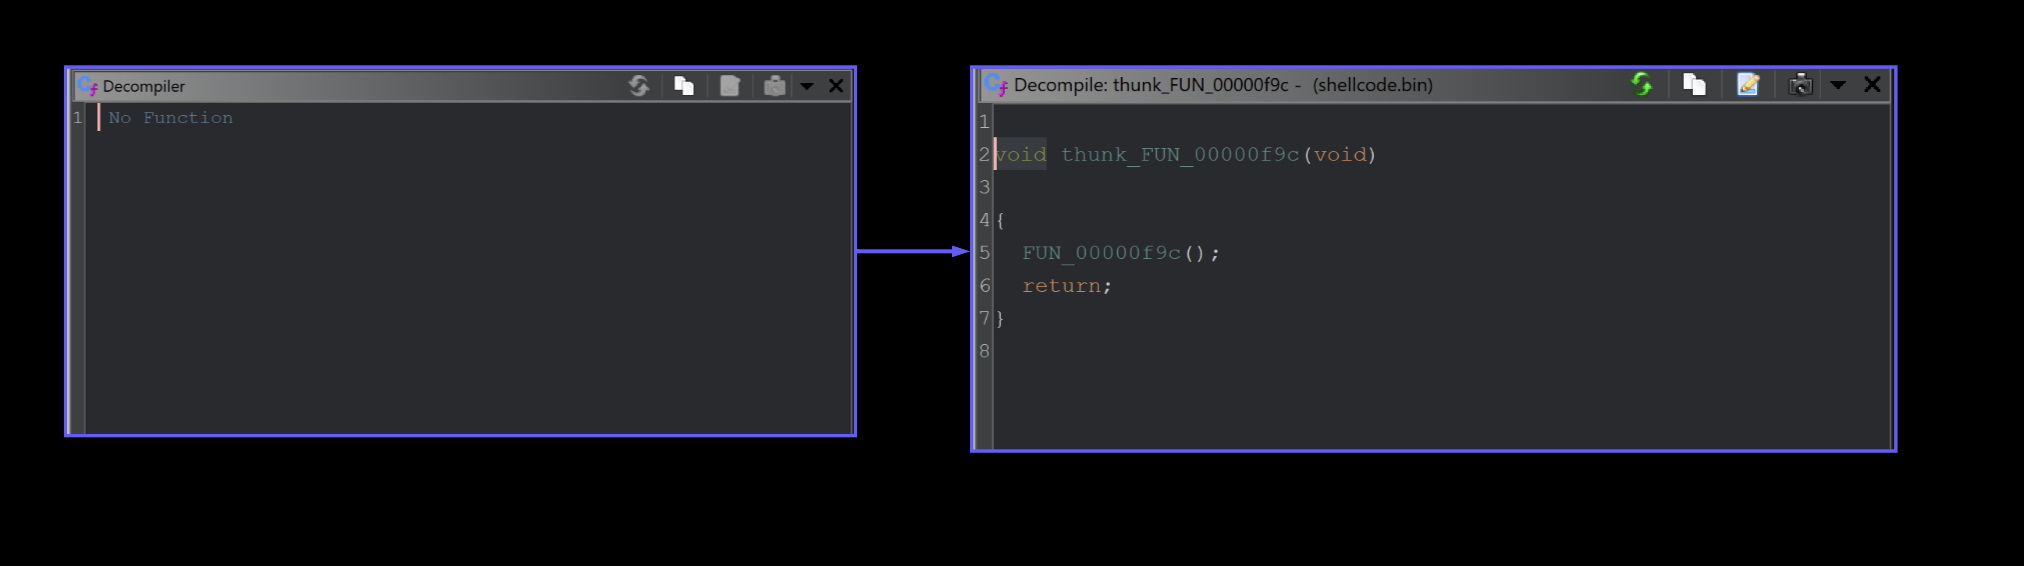
Once this is setup - You can click the one and only available function.
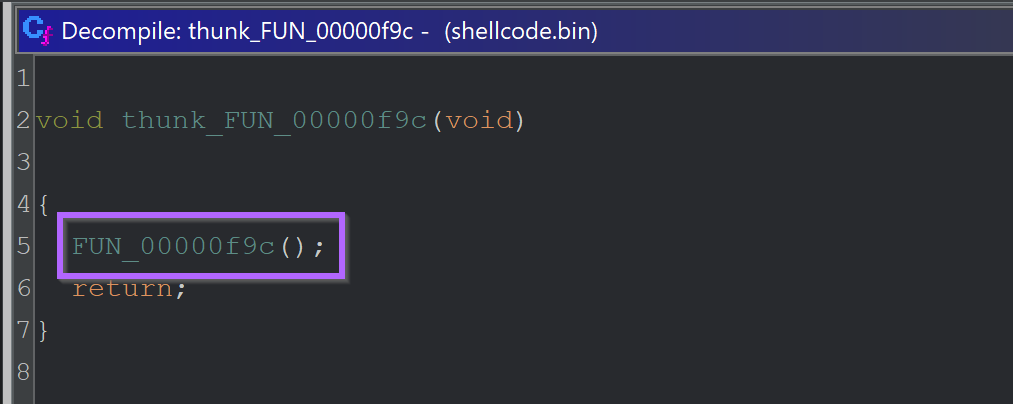
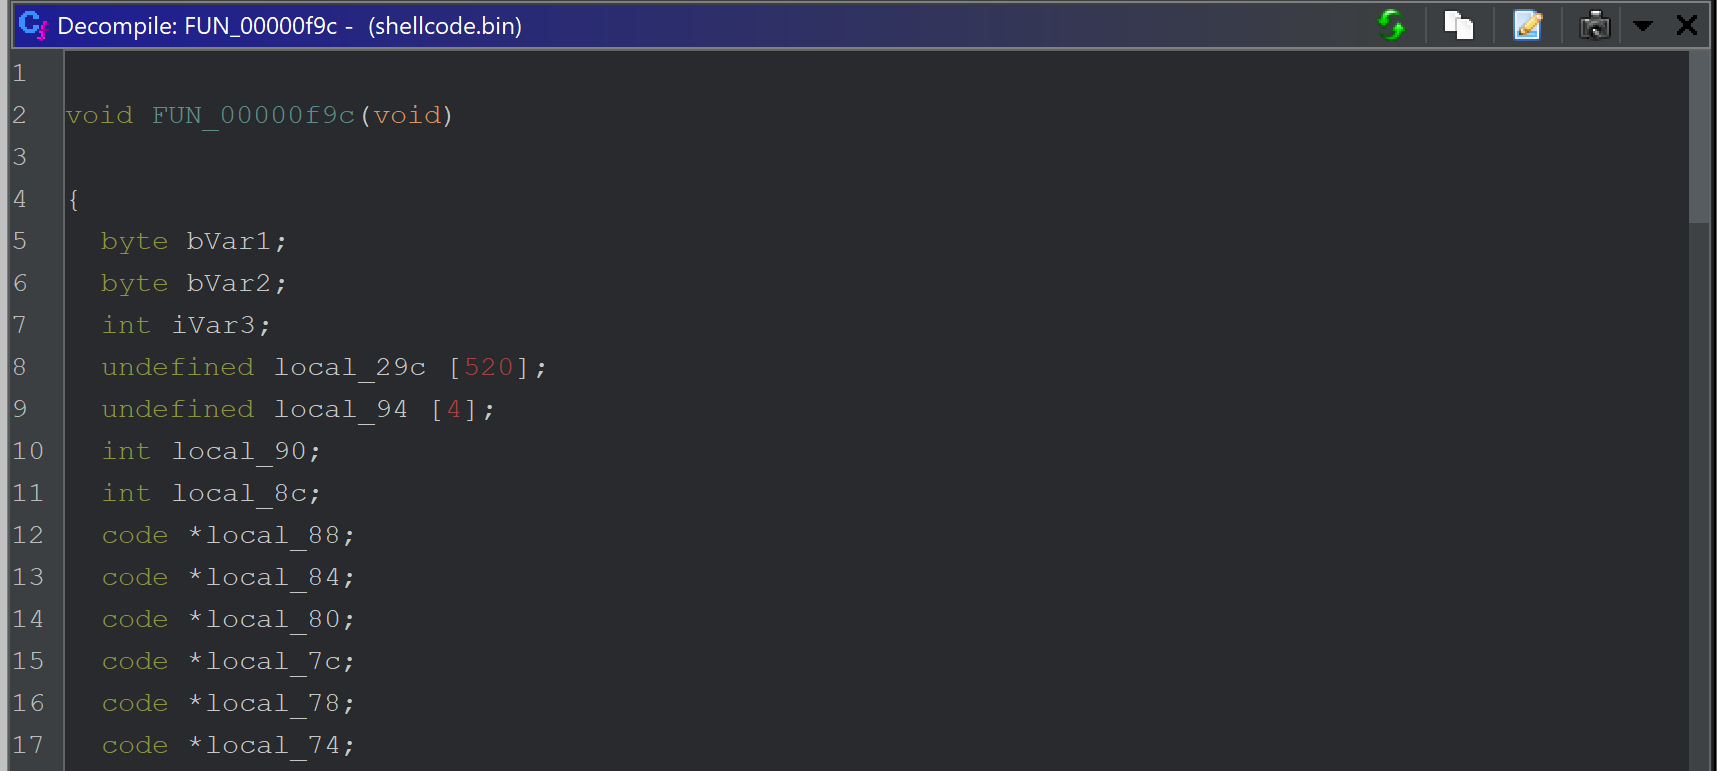
Analysis of The Shellcode Using Ghidra
This reveals a function FUN_00000f9c that begins by initialising a bunch of stack variables which can largely be ignored for now.
Scrolling down further, we can see some potential stack strings.
Identifying Stack Strings in Ghidra
You can generally suspect stack strings when you see lots of hex or decimal values being set on stack variables.
Since null bytes are used to terminate each string - this is also a dead giveaway.
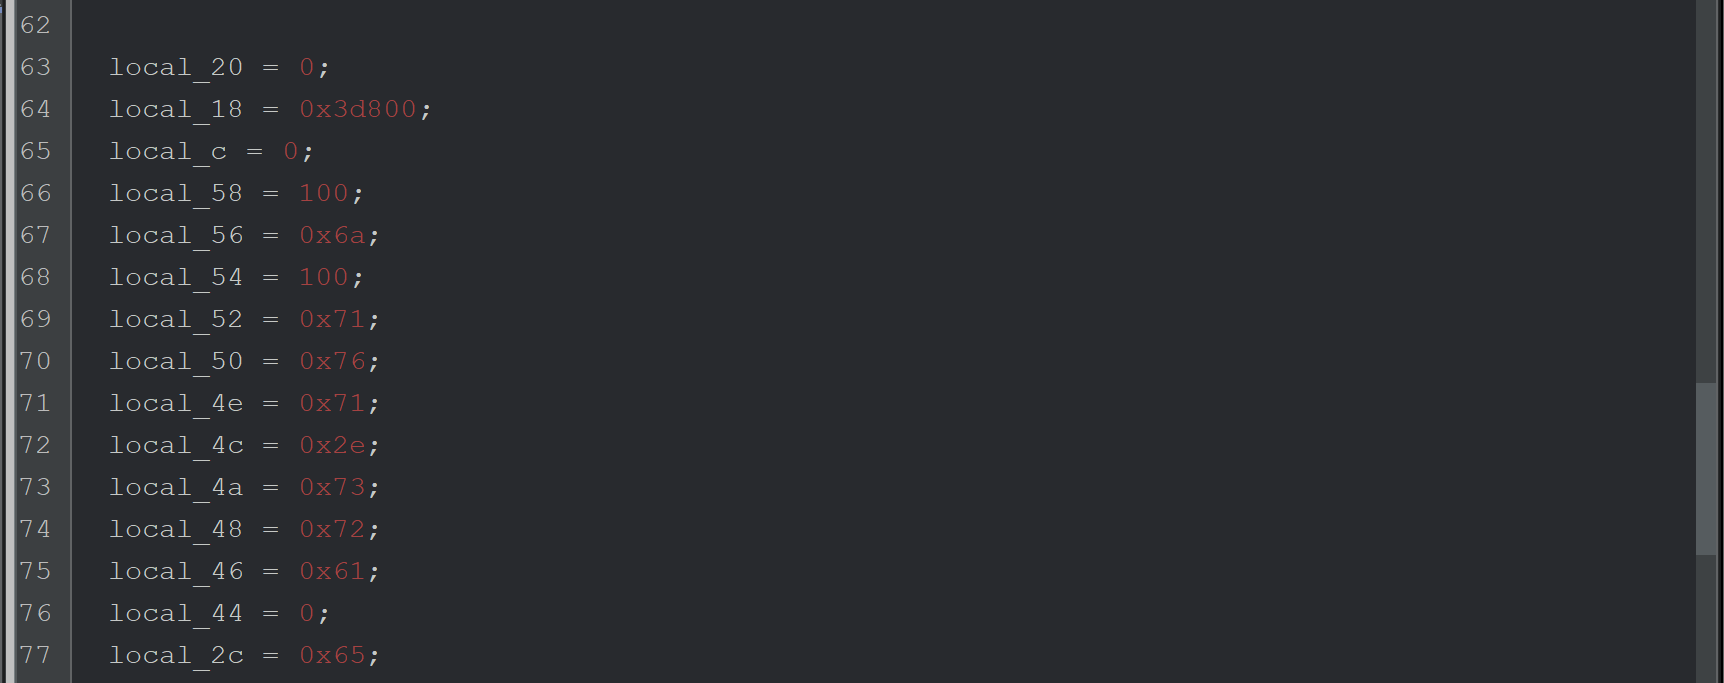
These stack strings can be decoded in Ghidra by right-clicking on each value and selecting char.
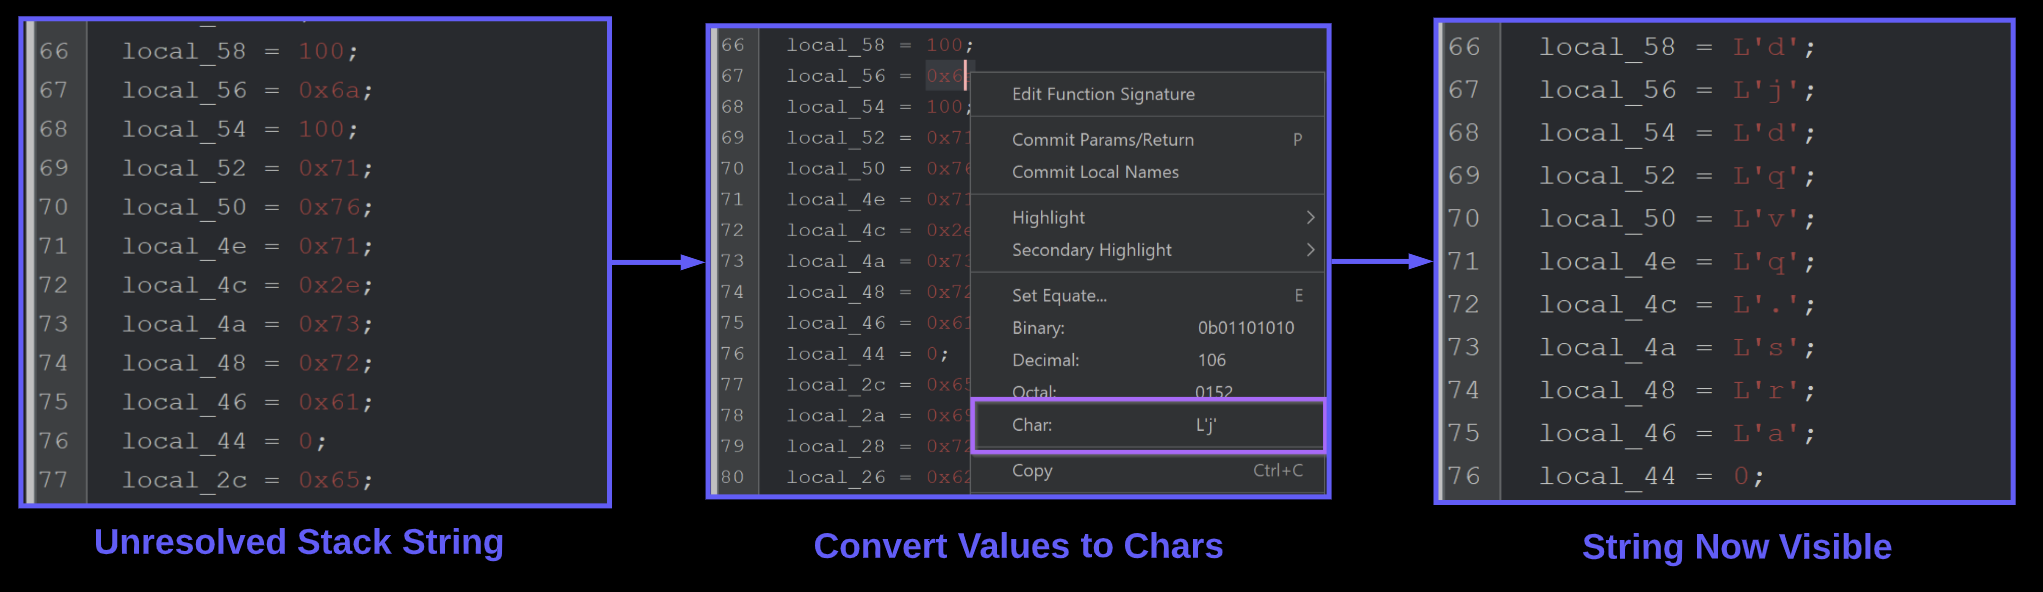
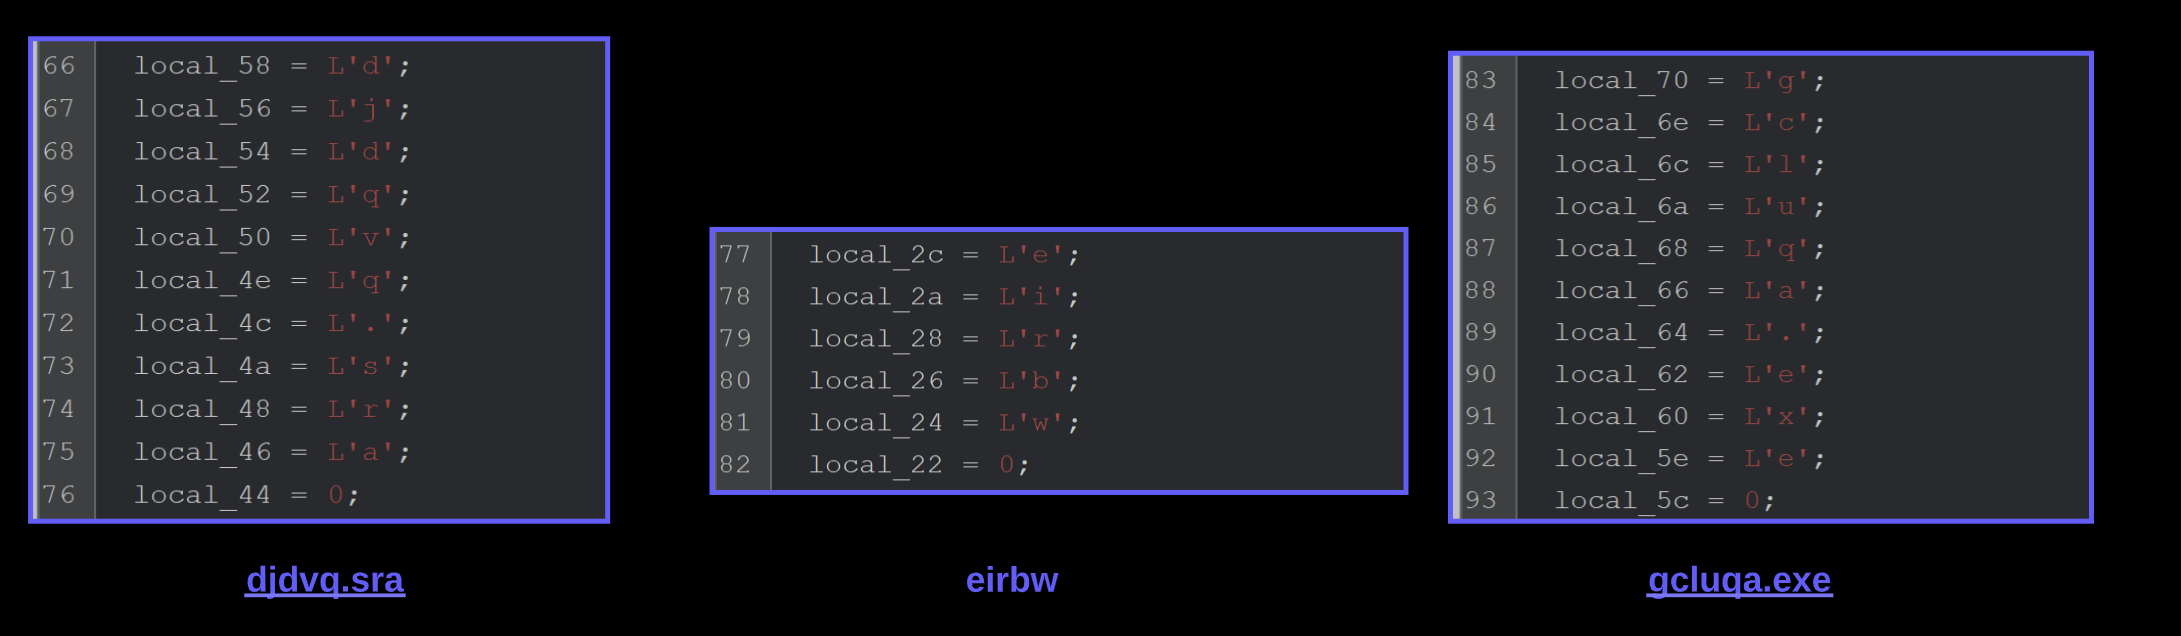
Once the first stack string is decoded, we can see a value of djdqvq.sra. Which is the remaining file in our unzipped nullsoft folder.
After this value - are a few more stack strings which I presume to be folder and file names for later use.
Identifying API Hashing in Shellcode
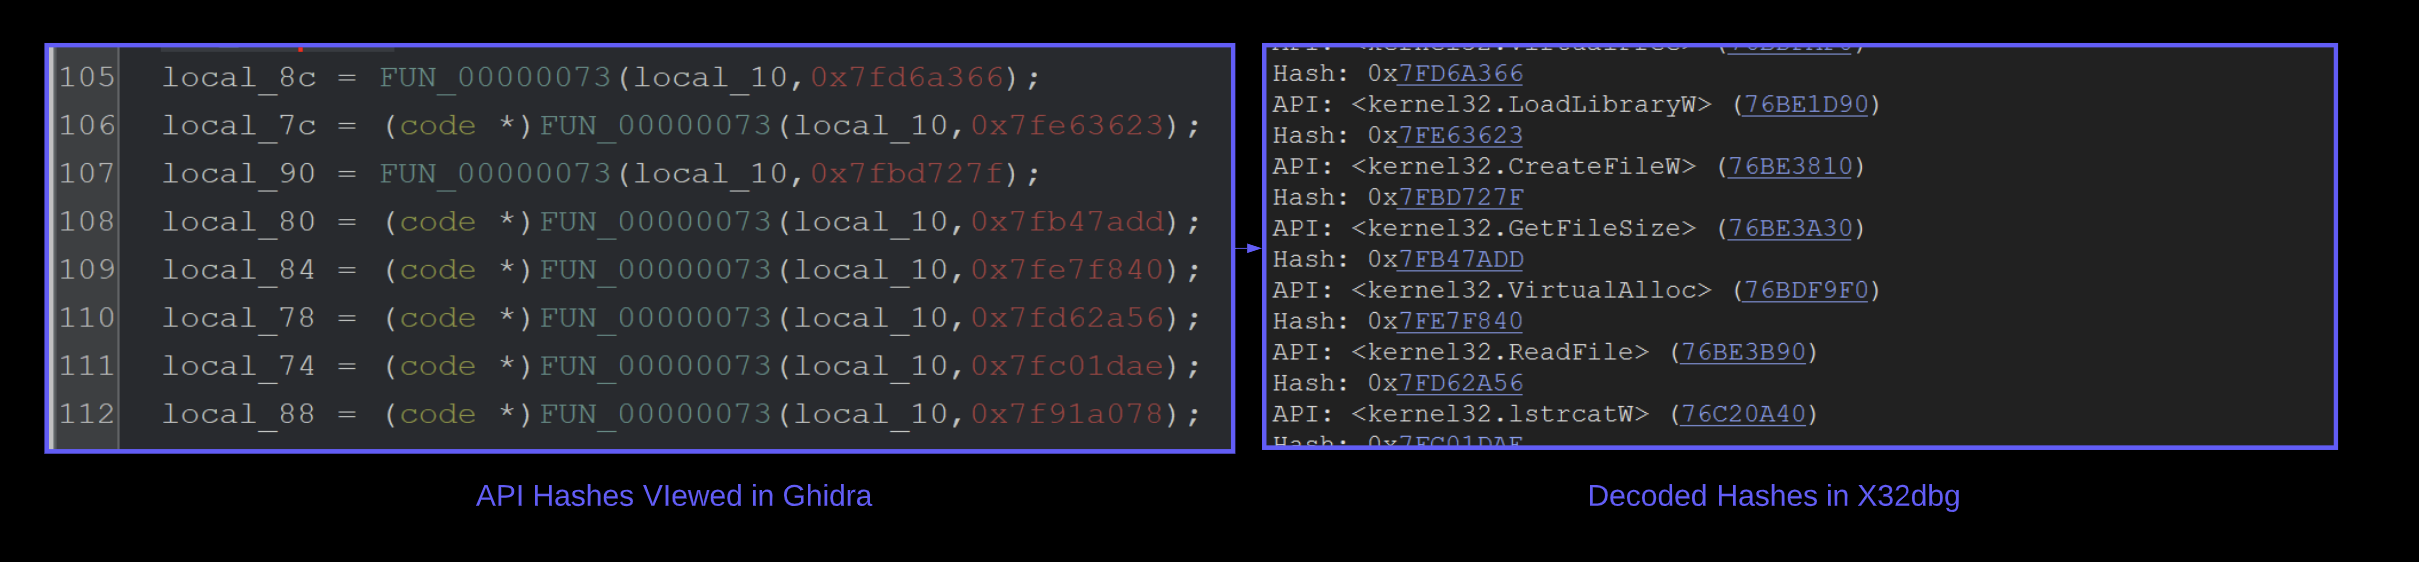
Immediately following the stack strings - there is a suspicious function FUN_00000073that is called repeatedly. Each call to FUN_00000073 contains the same first argument, as well as a second argument containing hash-like value.
On lines 111 and 113 - We can see that a returned result is executed as code. This is an extremely strong indicator that FUN_00000073 is an API hashing function.
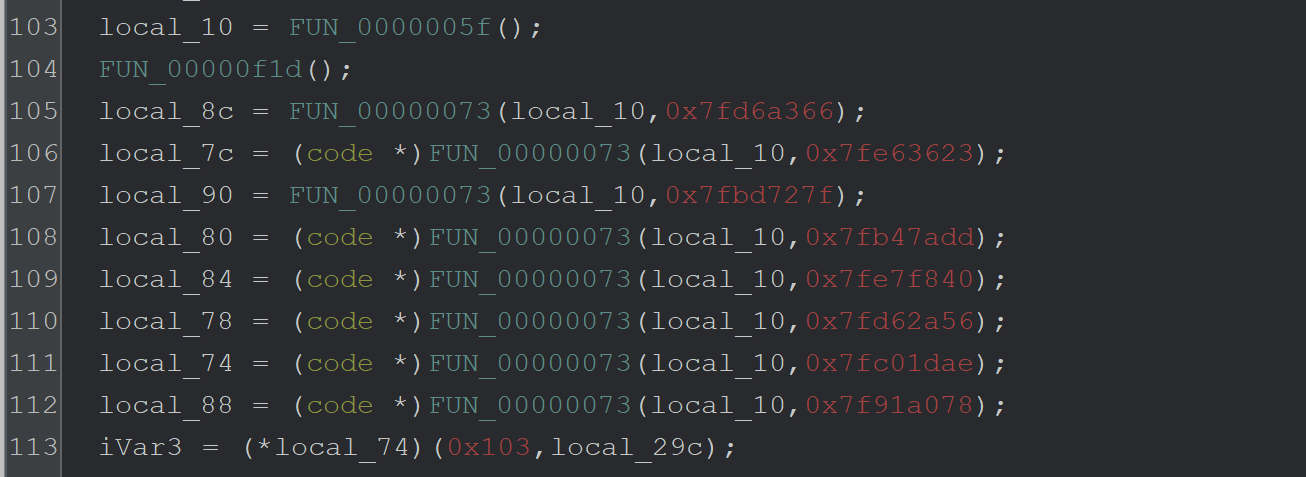
Based on the above analysis - we have enough information to determine that the function performs api Analysisand resolution. You could always manually inspect the function to determine the exact hashing type, but this is a manual process for a future blog post.
Instead - I will focus on a repeatable method to resolve unknown api hashes using a debugger. This method should work regardless of the api hashing method used and does not rely on 3rd party scripts or an internet connection.
How to Defeat API Hashes With A Debugger
A debugger (x32dbg/x64dbg) can be used to monitor the input and output of the API-hashing function and easily obtain the decoded APIs and their corresponding hashes. This is primarily achieved using the logging feature of x64dbg.
To Do This
- Load shellcode into a debugger using blobrunner
- Set Breakpoints on the api hashing function
FUN_00000073 - One breakpoint for the beginning (containing the hashed api name)
- One breakpoint for the end (containing the resolved api)
- Once working - convert the breakpoints into conditional breakpoints that log the interesting values.
- View the log window for hashes as well as decoded api’s
How to Load Shellcode Into a Debugger (x32dbg)
Since shellcode can not be loaded directly into a debugger - I will use Blobrunner from OALabs.
The purpose of Blobrunner is to load the shellcode and provide a process that can be attached to using a debugger.
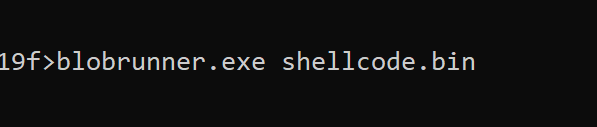
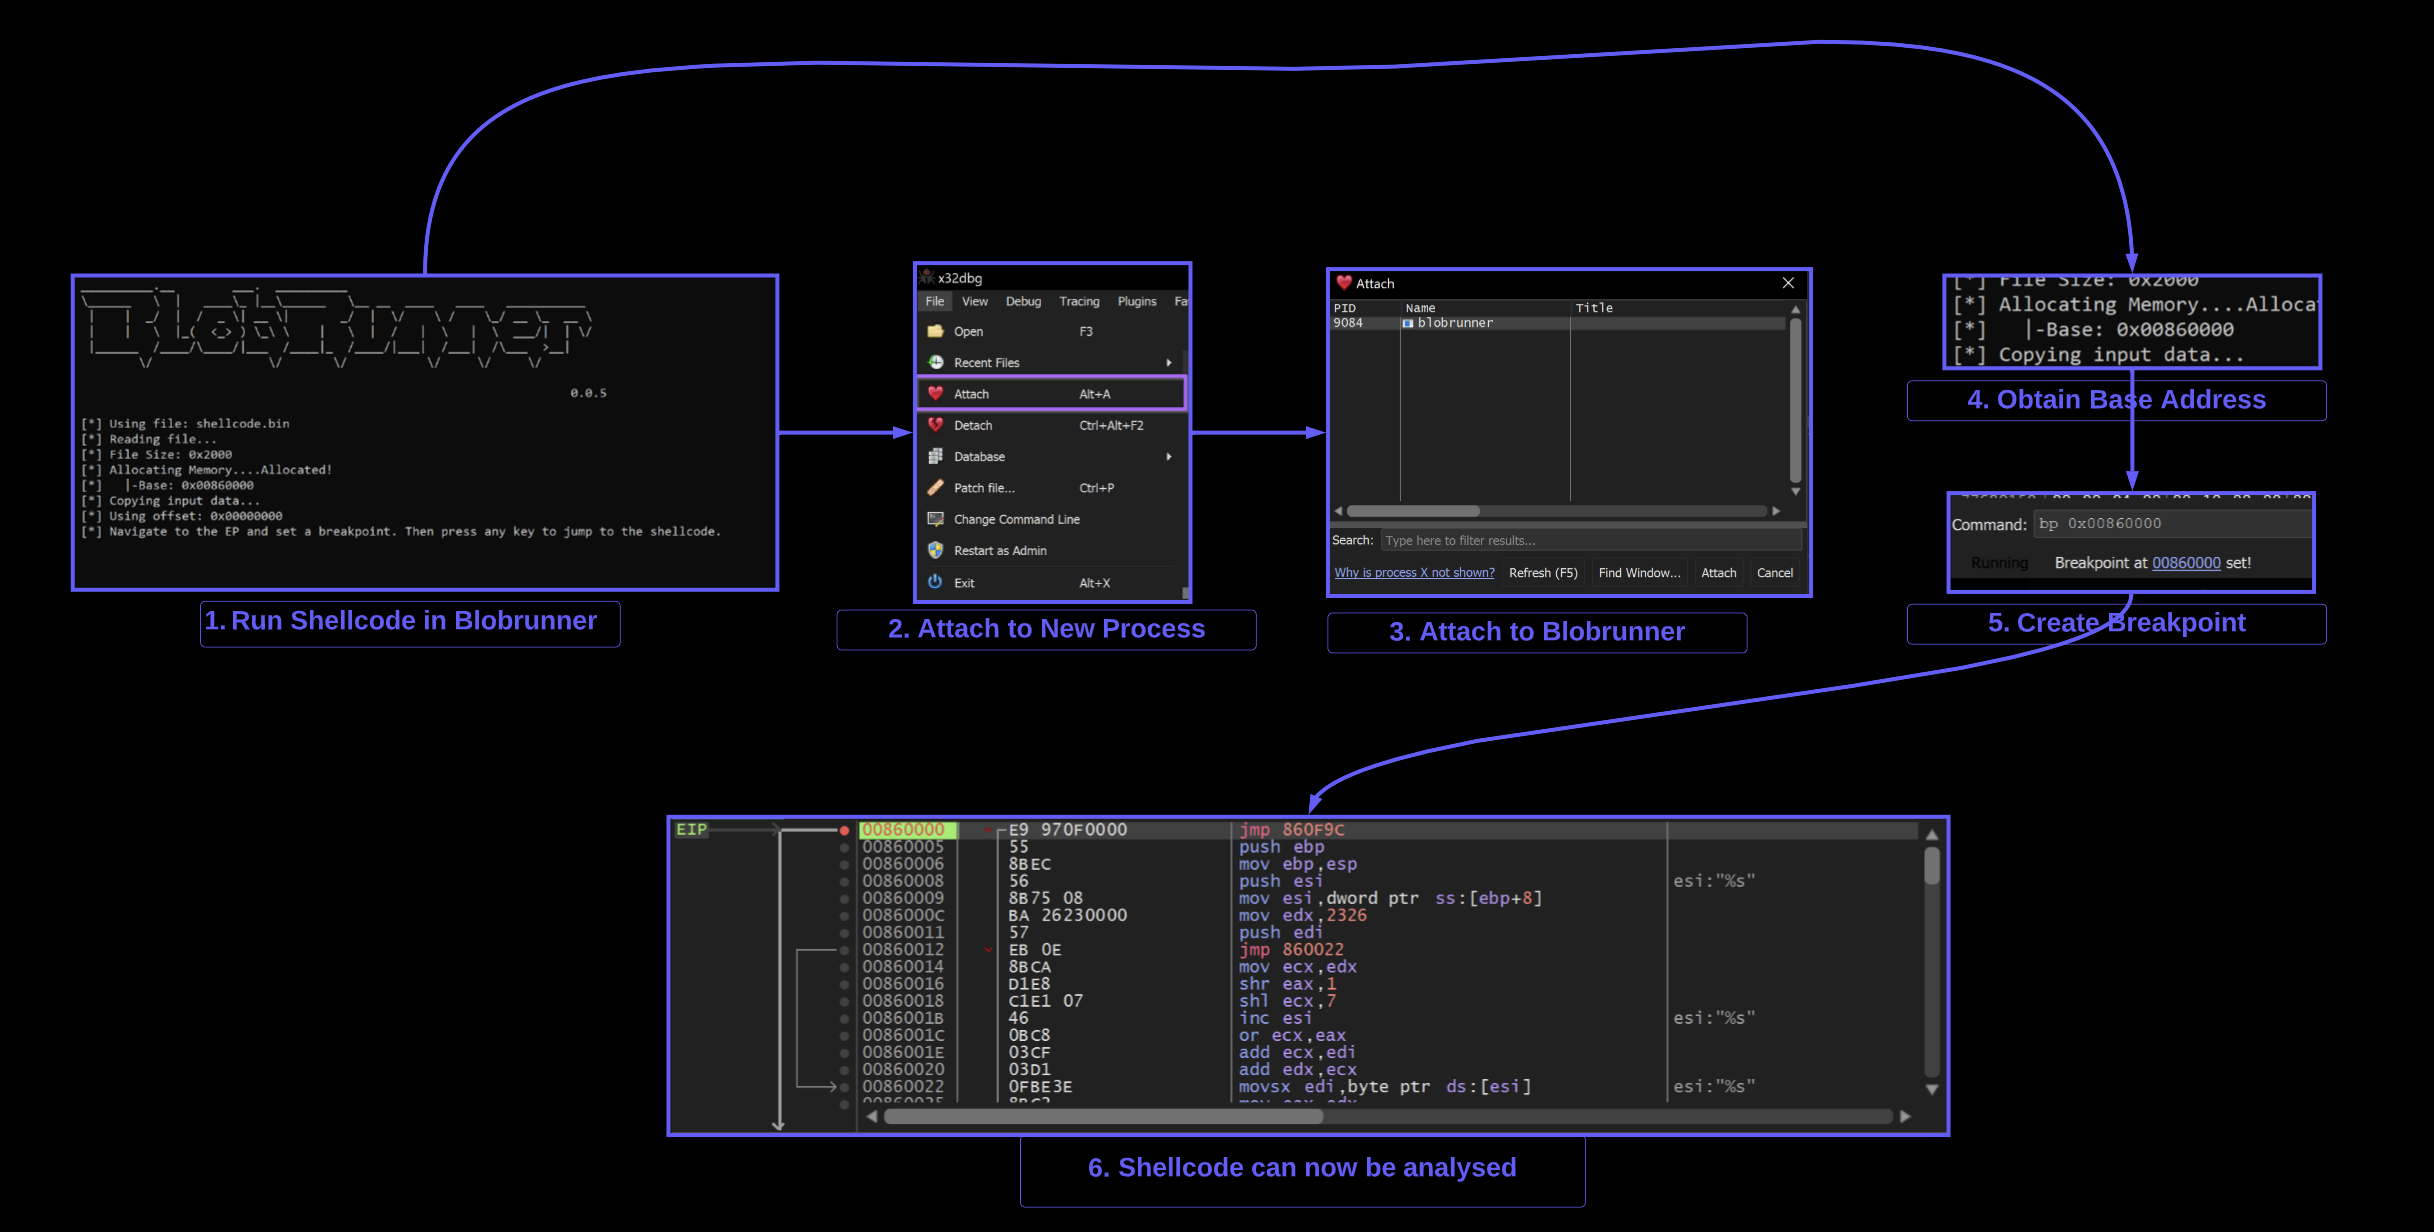
To do this - you can download blobrunner from GitHub, copy it to the same directory as your shellcode, then open a command line and run blobrunner.exe shellcode.bin
(Make sure to place the blobrunner files in the same folder as your shellcode, and use the 32-bit version blobrunner.exe and not blobrunner64.exe)
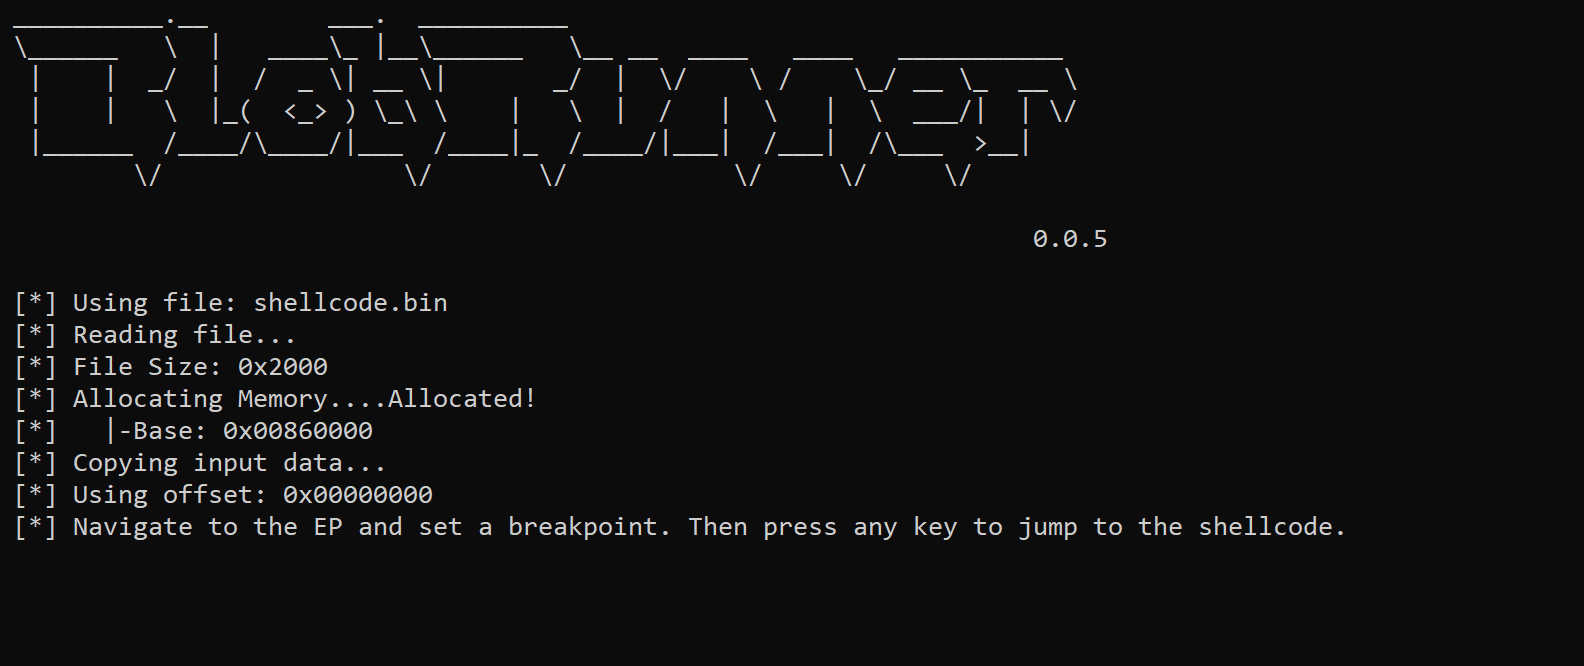
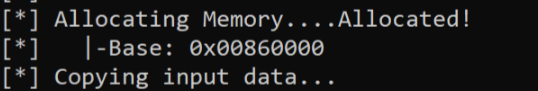
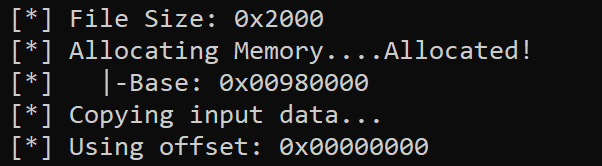
Successful execution will show a small window containing a base address 0x00860000 where the shellcode has been loaded into.
Note that the base address will be different for each execution.
Once the base address 0x00860000 of the shellcode has been obtained- you can open x32dbg and attach it to Blobrunner
Attaching to Blobrunner using X32dbg
X32dbg can be used to attach to the blobrunner process containing shellcode.
File -> Attach -> Blobrunner.exe
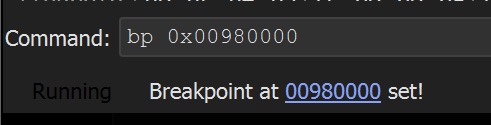
Once attached - a breakpoint should be created on the base address containing the shellcode.
In this case - the address was 0x00860000
The command bp 0x00860000 will create the breakpoint.
At this point - you can press any button in the Blobrunner command window and the shellcode breakpoint should be triggered.
Setting a Breakpoint on the API Hashing Function
At this point - A breakpoint should be set on the API hashing function FUN_00000073
To set the breakpoint - we can either
- Sync the addresses between x32dbg and Ghidra (see my previous blog).
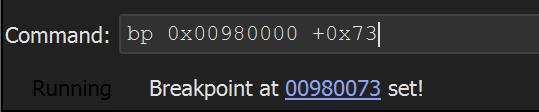
- Set a breakpoint on the base address + 0x73.
The easiest way to is to set a breakpoint on the base address 0x00860000 + 0x73
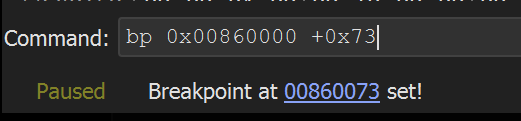
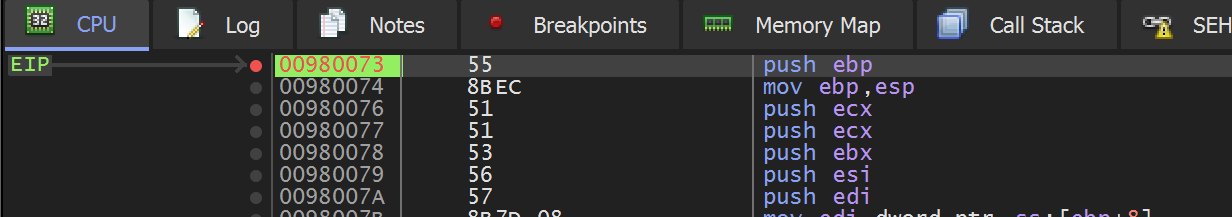
Allowing the shellcode to execute the program - the breakpoint on the API hashing function 0x00860073 is triggered.
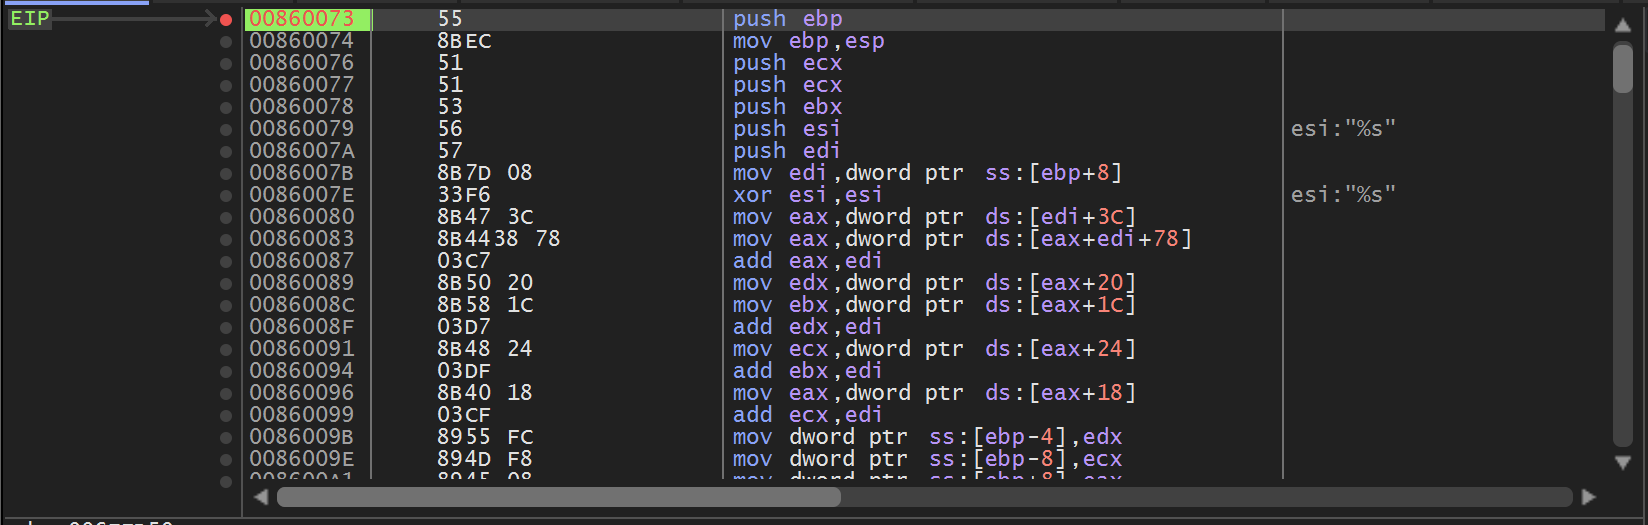
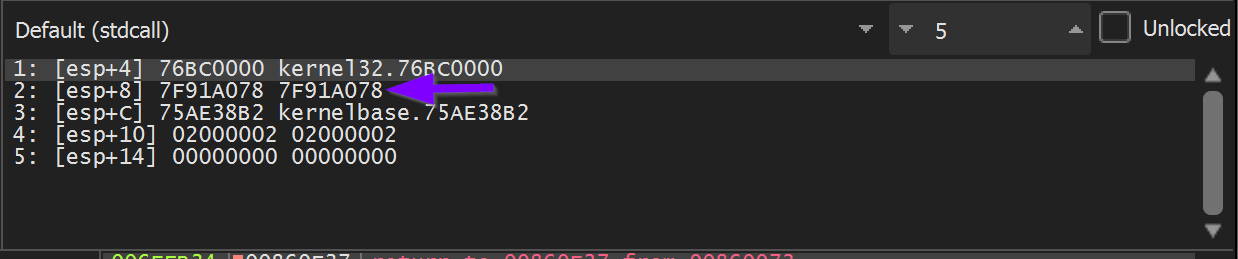
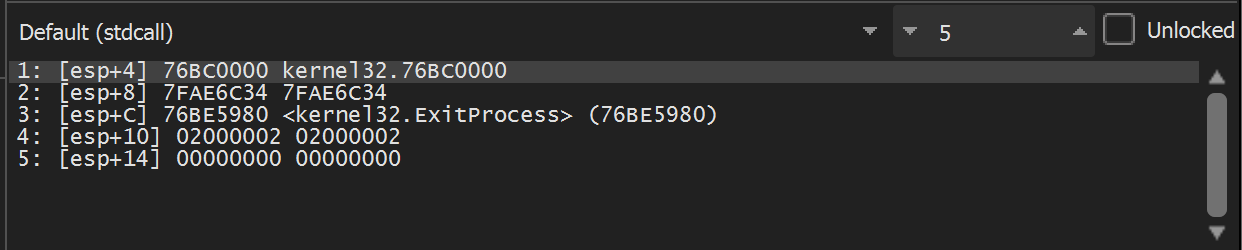
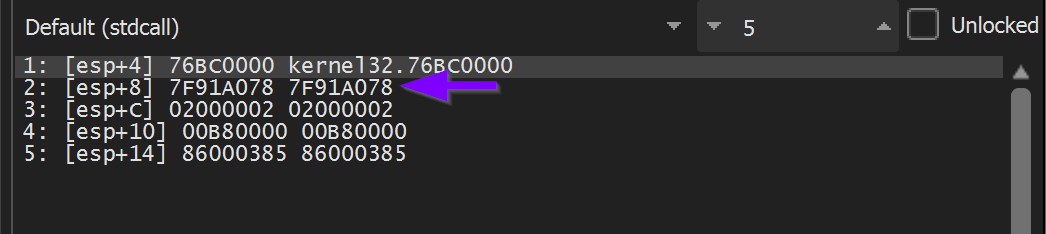
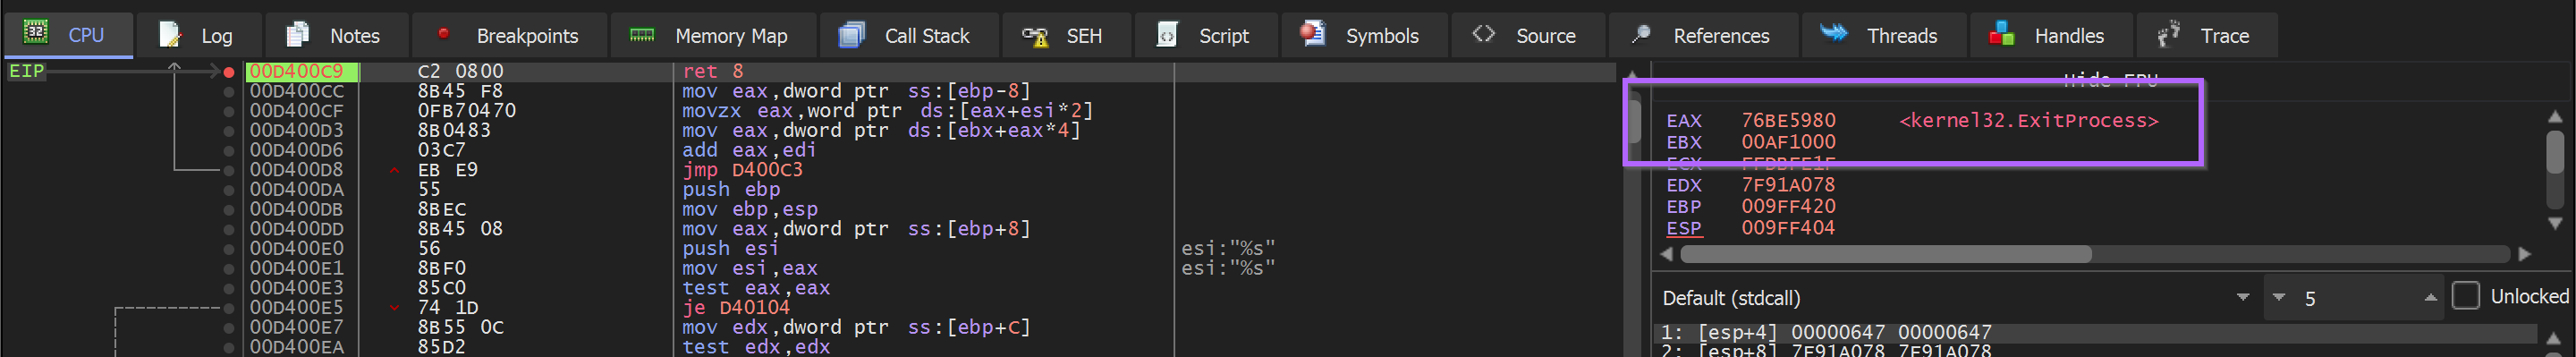
At the point where the breakpoint is triggered, we can see the first API hash of 0x7f91a078 contained in the second argument to 0x00860073
(Note that x32dbg assumes 5 arguments by default, we can ignore args 3,4 and 5 as we know the function only takes two)
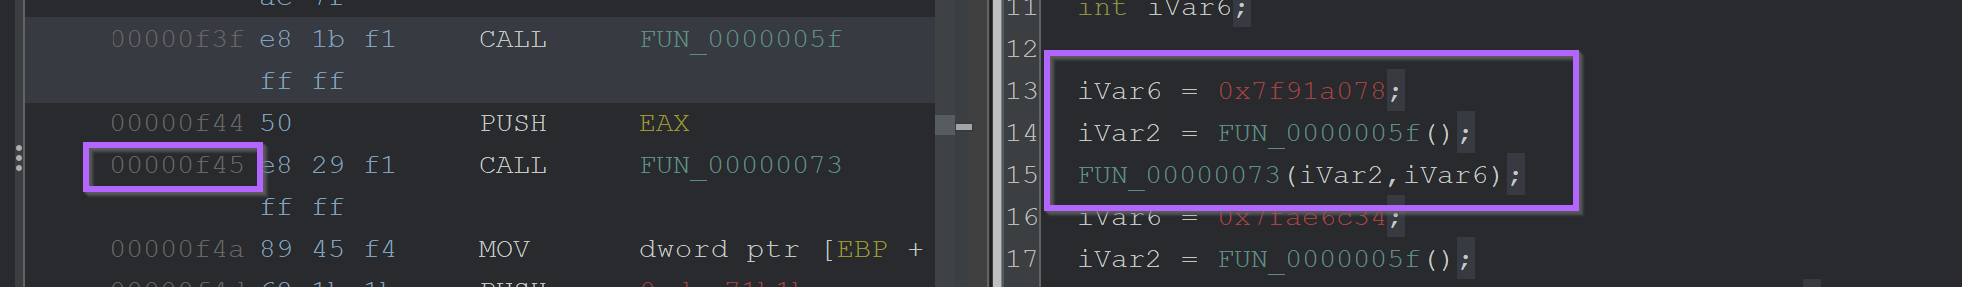
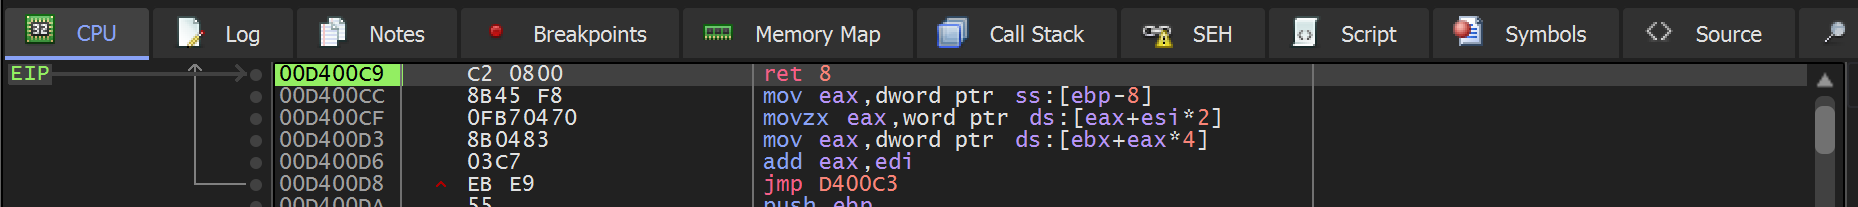
This first hash of 0x7f91a078 corresponds to the first call at 0x00000f45
To obtain the decoded API name - Execute Until Return and monitor the return value in EAX.
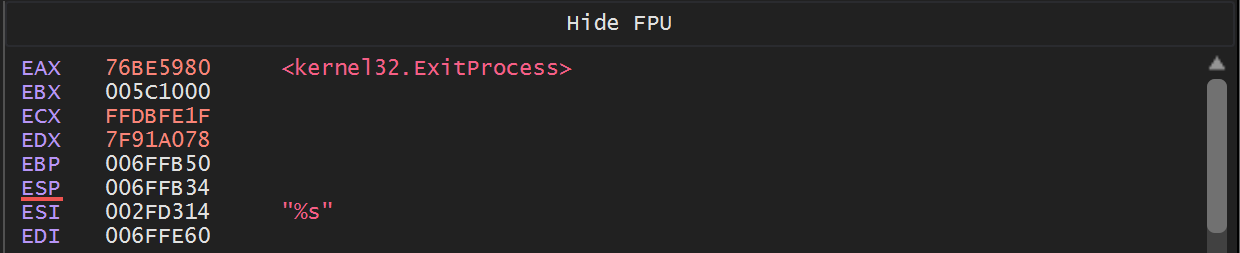
This reveals that the first hash of 0x7f91a078 corresponds to Kernel32.ExitProcess.
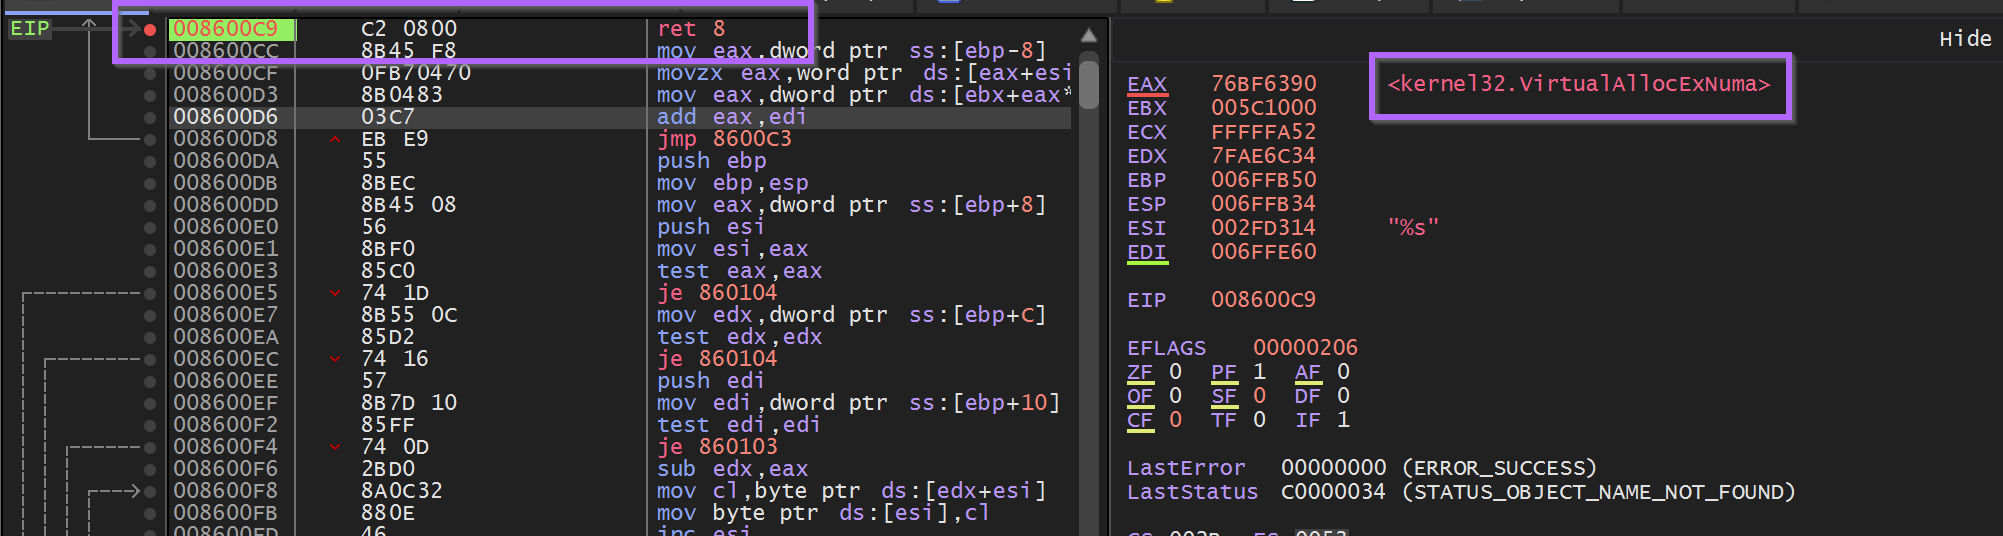
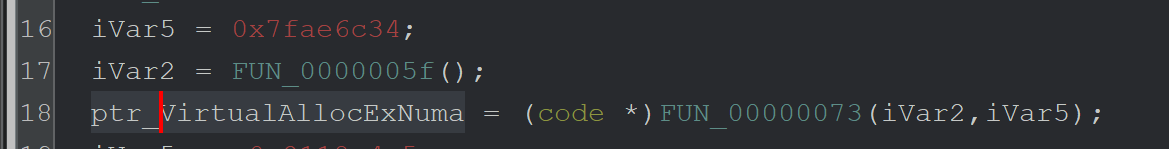
Allowing the Malware to continue to execute - the API hashing function is triggered again. This time with a hash of 0x7fae6c34.
Executing until return - we see that 0x7fae6c34 resolves to kernel32.VirtualAllocExNuma.
It is now worth noting that the decoded API hash resides in the return value EAX whenever EIP is at the end of the API hashing function 0x008600c9.
- if EIP == 0x008600c9 → then EAX == Decoded API name
At this point - A Ghidra database could be modified with the first two resolved api names.
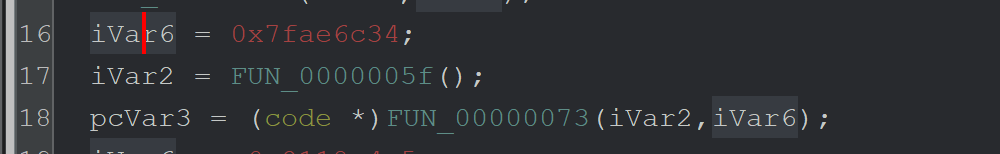
For example - by converting Line 18 (above) the above to this (below)
Marking up Ghidra is not a complicated process - but it is somewhat tedious and hence will be left as an exercise.
How to Automate API Hashing with A Debugger (x32dbg)
At this point, we now know a few key pieces of information
- The exact location where the API resolving function starts
<base> + 0x73 - The exact location containing the hashed API name (2nd arg,
[esp+8]) - The exact location where the decoded API name can be found
<base> + 0xc9
We can now simply create breakpoints with log conditions to obtain the hashes and decoded values.
This will require two primary conditional breakpoints.
- On the API hashing function
<base> + 0x73- This is to log the hash - On the End of the API hashing function
<base> + 0xc9- To log the decoded value
This can be achieved by restarting blobrunner (Making sure to set breakpoints according to the new base address)
As well as setting a breakpoint on the new address of the API resolving function.
Blobrunner can now be executed - Which will trigger a breakpoint on the start of the api resolving function <base> + 0x73
Remember the hashed value contained the second argument [esp+8]. This is the first value that should be logged.,
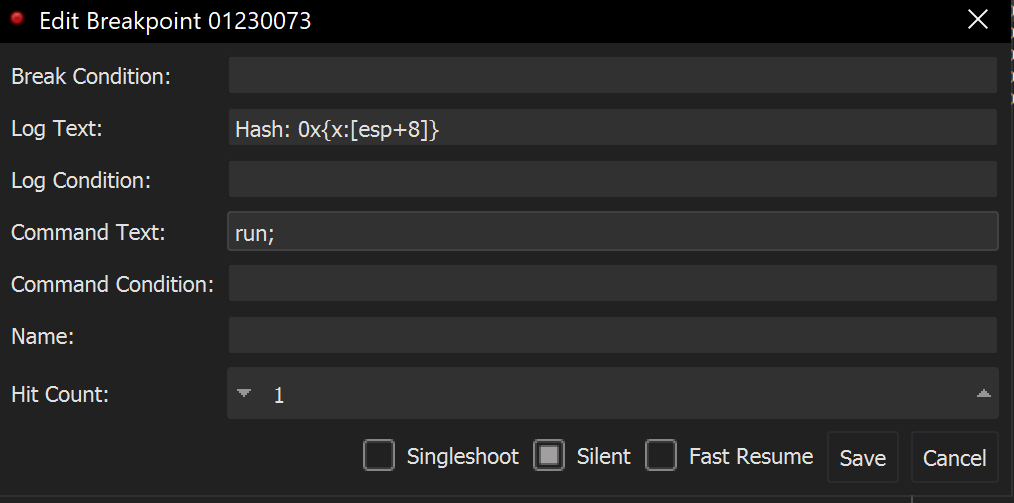
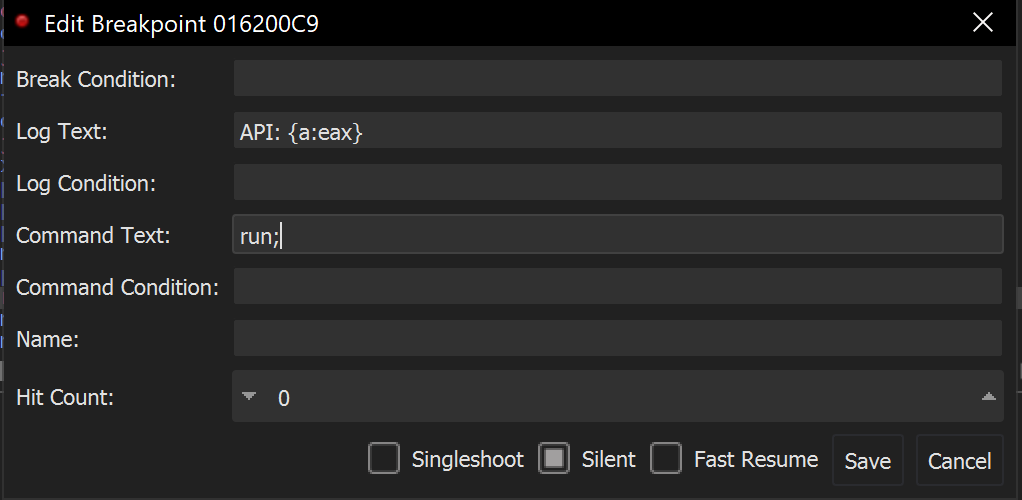
We can go ahead and EDIT the breakpoint. Adding the following conditions.
- Log Text -
Hash: 0x{x:[esp+8]}- This will log the hex value contained at[esp+8] Hash:this is just generic text for readability0xprepend a0xto each printed hex value{x:[esp+8]}- print the hexxrepresentation of the value at[esp+8]- Command Text -
run;- this will continue execution instead of pausing at the breakpoint.
The conditional breakpoint should look like the below screenshot.
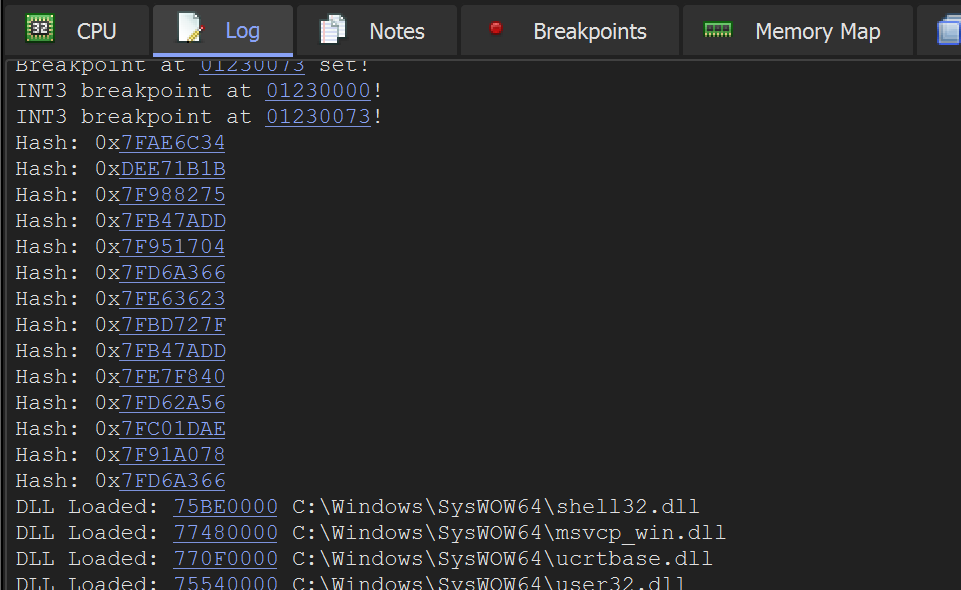
Now when the Malware executes - Hashed values will be printed to the Log Window.
Next, we’ll add a second breakpoint to log the decoded values.
Let's now take it a step further and print the decoded API names.
We can do this by restarting the program and recreating the initial conditional breakpoint.
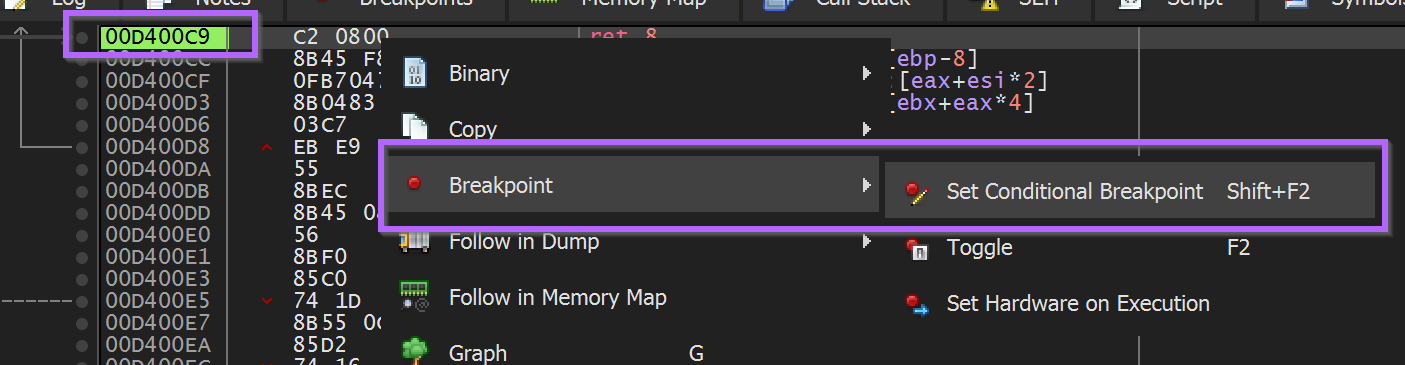
A second conditional breakpoint will need to be created at the end of the API hashing function <base> +0xc9.
Once the end of the api hashing function <base> + 0xc9 has been located - A second conditional breakpoint can be created.
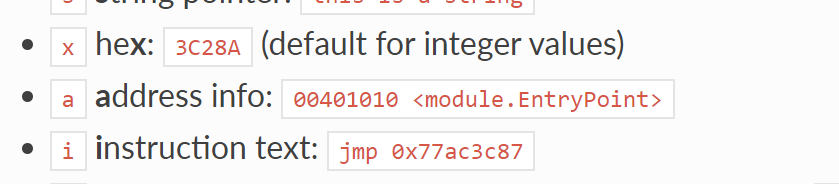
(Remembering that we want to log the API name at EAX, but not the actual value of EAX). This can be done by using {a:eax}
The syntax of {a:eax} can be obtained from the x64dbg documentation - this will print the address information which contains any relevant function names. (As per the x64dbg documentation)
We can use this to set the following conditional breakpoint at the return address <base> + 0xc9.
Now when the Malware is executed - A list of hashes and their decoded values can be observed in the Log Window.
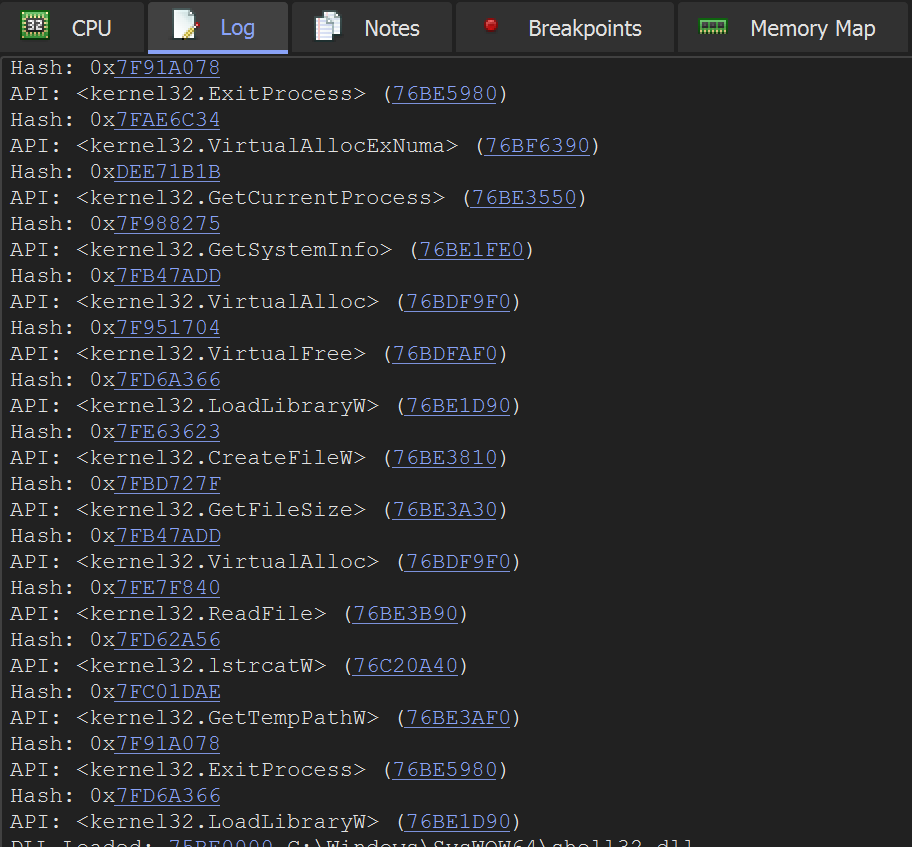
This information can be used to further markup a Ghidra database.
Alternatively - You can start adding breakpoints on the future functionality of the Malware.
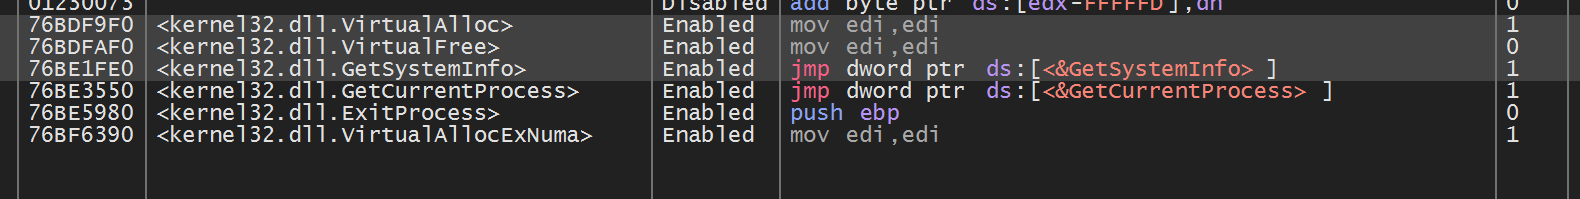
Eg Setting breakpoints on newly resolved API's ReadFile , VirtualAlloc etc.
Auto-creating breakpoints on Hashed APIs
Additional breakpoints can be created manually eg bp ReadFile - but they can also be auto-created by modifying the command text to bp eax; run;
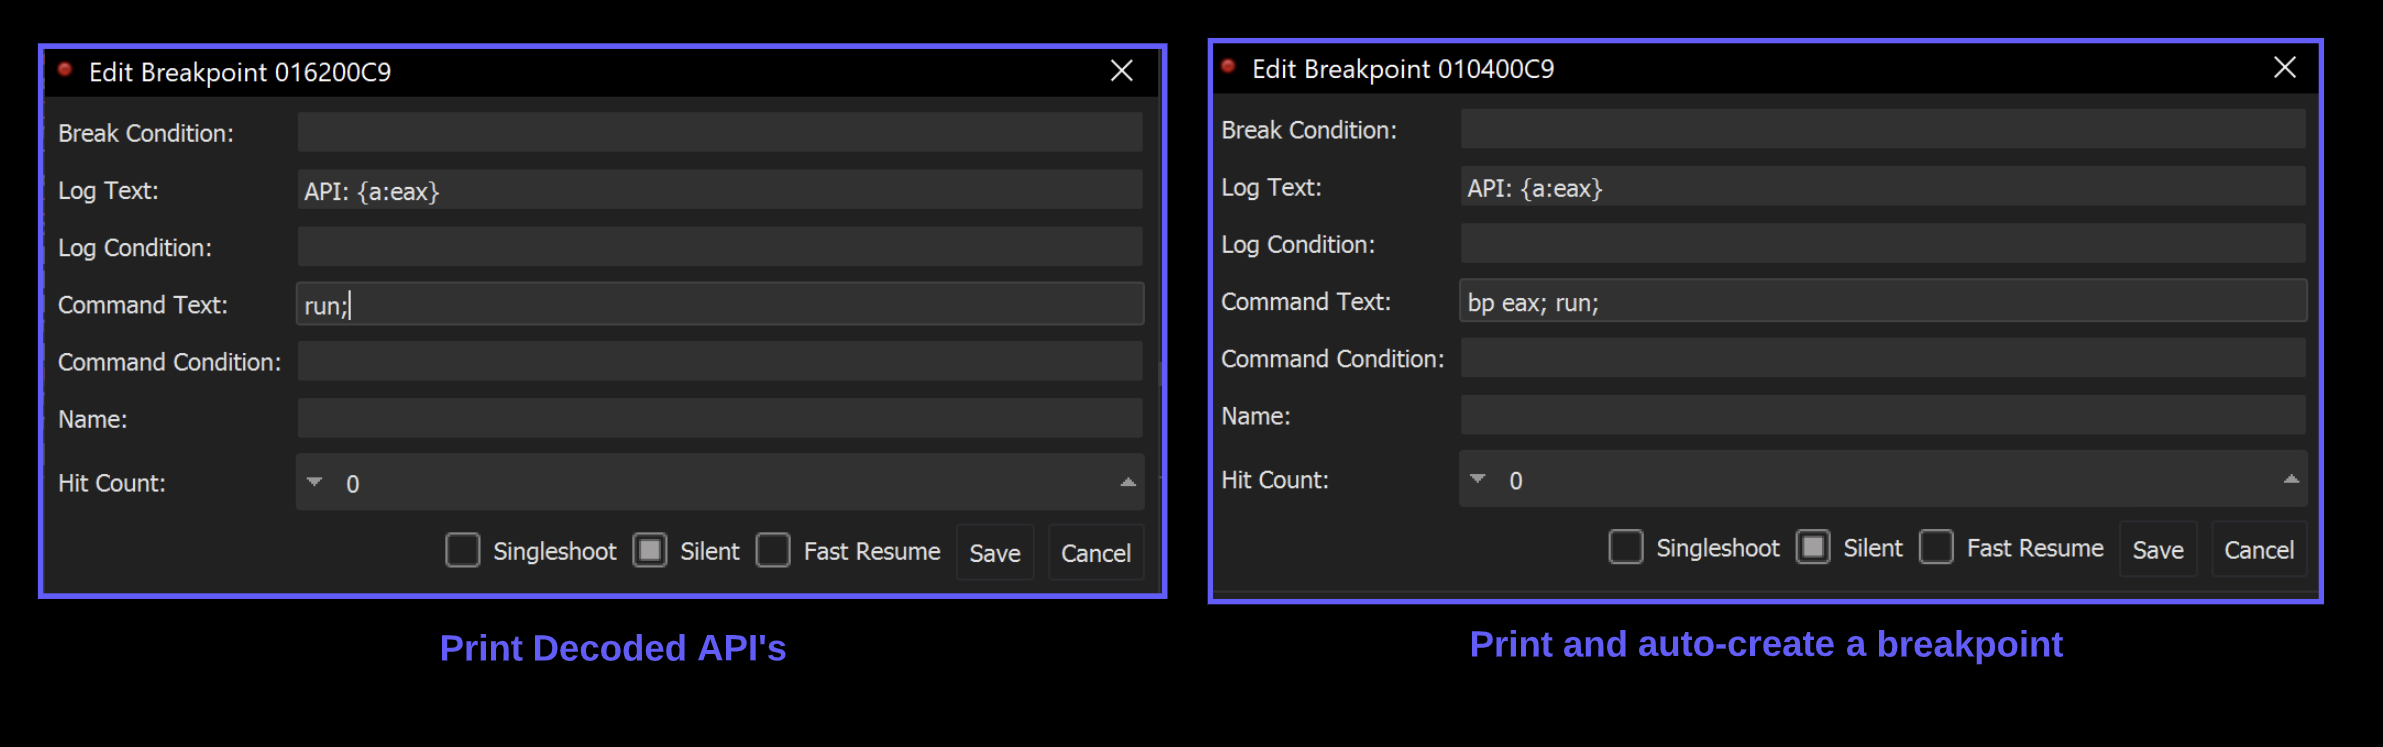
The Malware will now automatically create and trigger breakpoints on any function that was resolved via api hashing.
Since API hashing is generally used to hide suspicious imports - each new breakpoint should reveal something of interest.
Here are some short examples of information gathered from newly auto-created breakpoints.
lStrCatW - which appeared to be creating a folder path containing the final djdqvq.sra file from the original Nullsoft folder.
Here is a copy of the original Nullsoft folder.
Here are the two values being concatenated by lstrcatW - They combine to create C:\\\\users\\\\<user>\\\\Appdata\\\\local\\\\temp\\\\djdqvq.sra
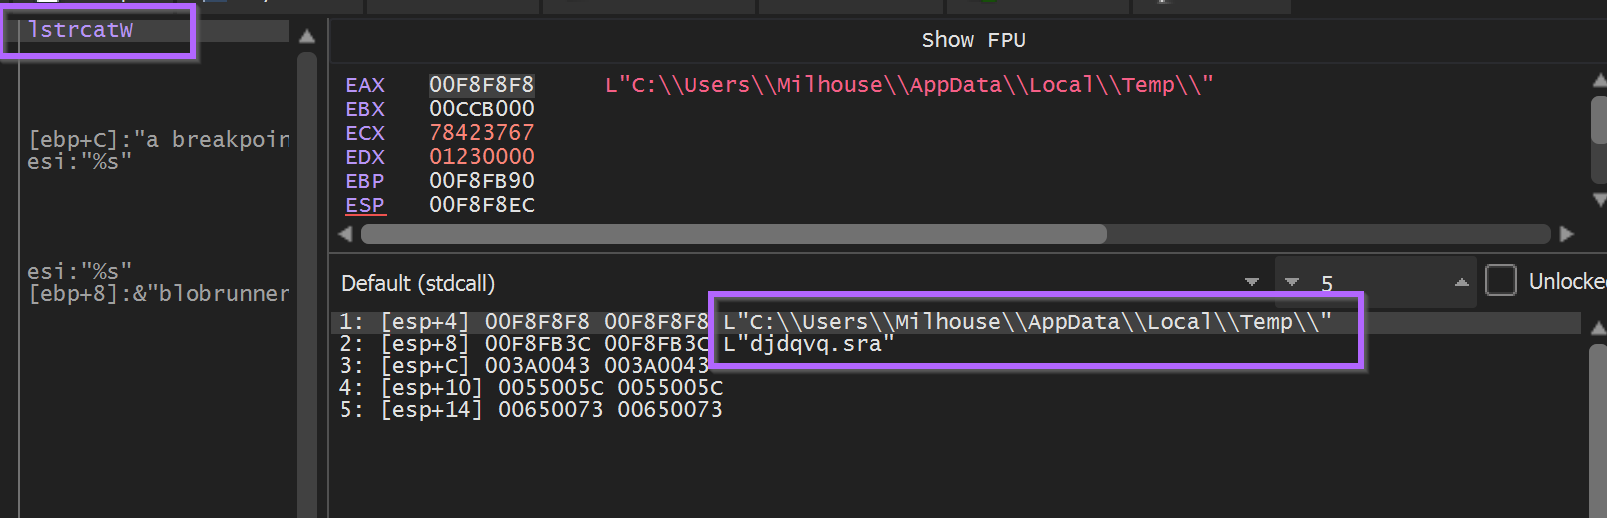
This would make a good hunting IOC if you discovered this malware sample in your environment.
PathAppendW - Revealed an interesting path for an exe file. c:\\\\users\\\\<user>\\\\appdata\\\\roaming\\\\eirbw\\\\gcluqa.exe
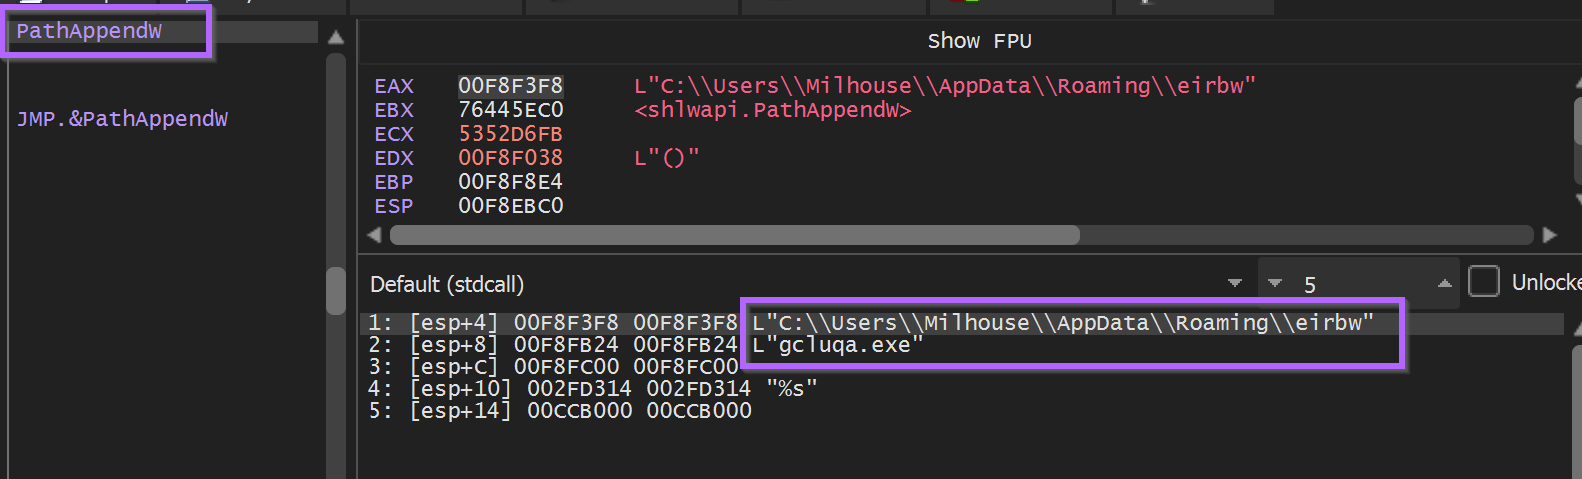
After a few more API calls related to persistence (via run key) and the creation of that eirbw folder.
An attempt was made to open the djdqvq.sra file via CreateFileW
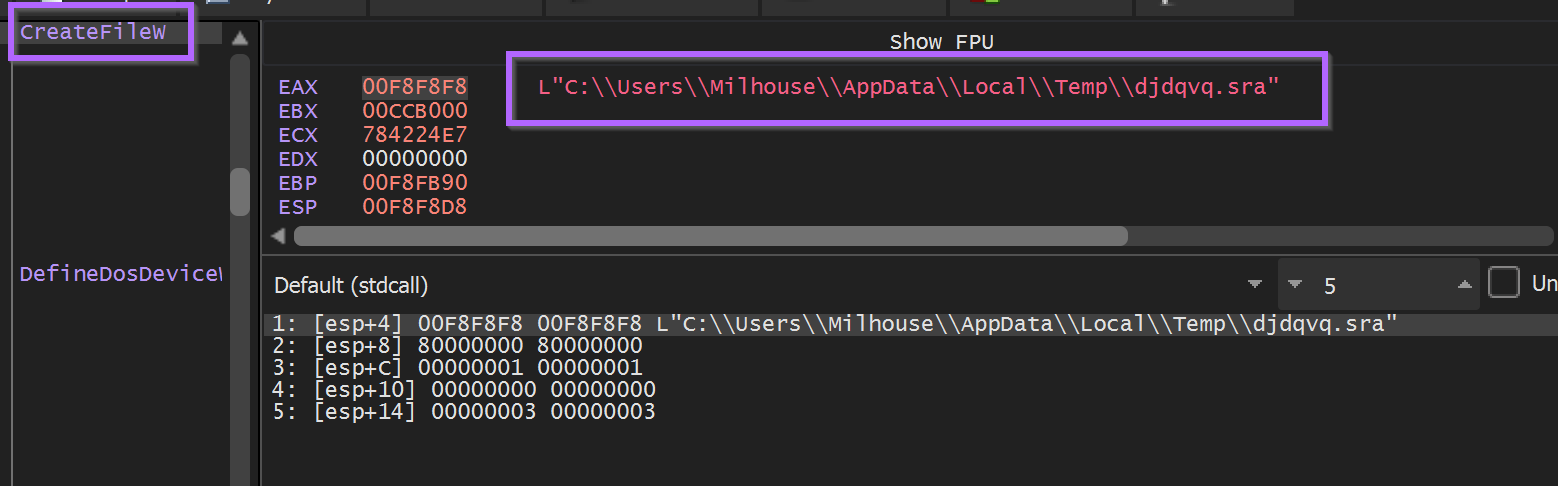
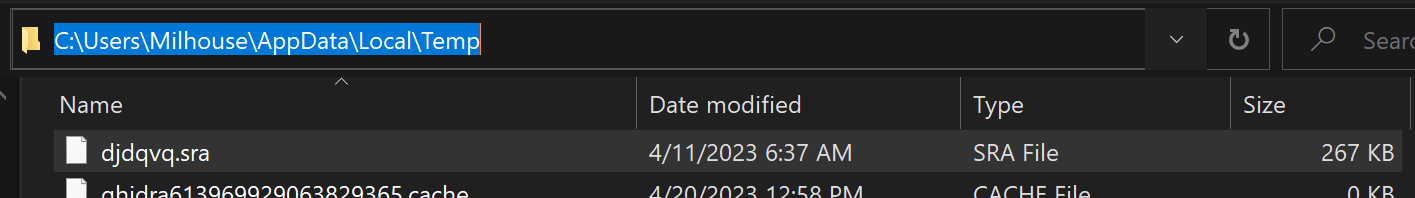
To keep the Malware happy and avoid patching memory - I copied the djdqvq.sra file to the c:\\\\users\\\\<user>\\\\appdata\\\\local\\temp folder.
The Malware was then allowed to continue to execute - at which point it hit another call to VirtualAlloc .
Execute Until Return was used obtain the resulting buffer in EAX, and then a hardware breakpoint was created to observe it’s contents.
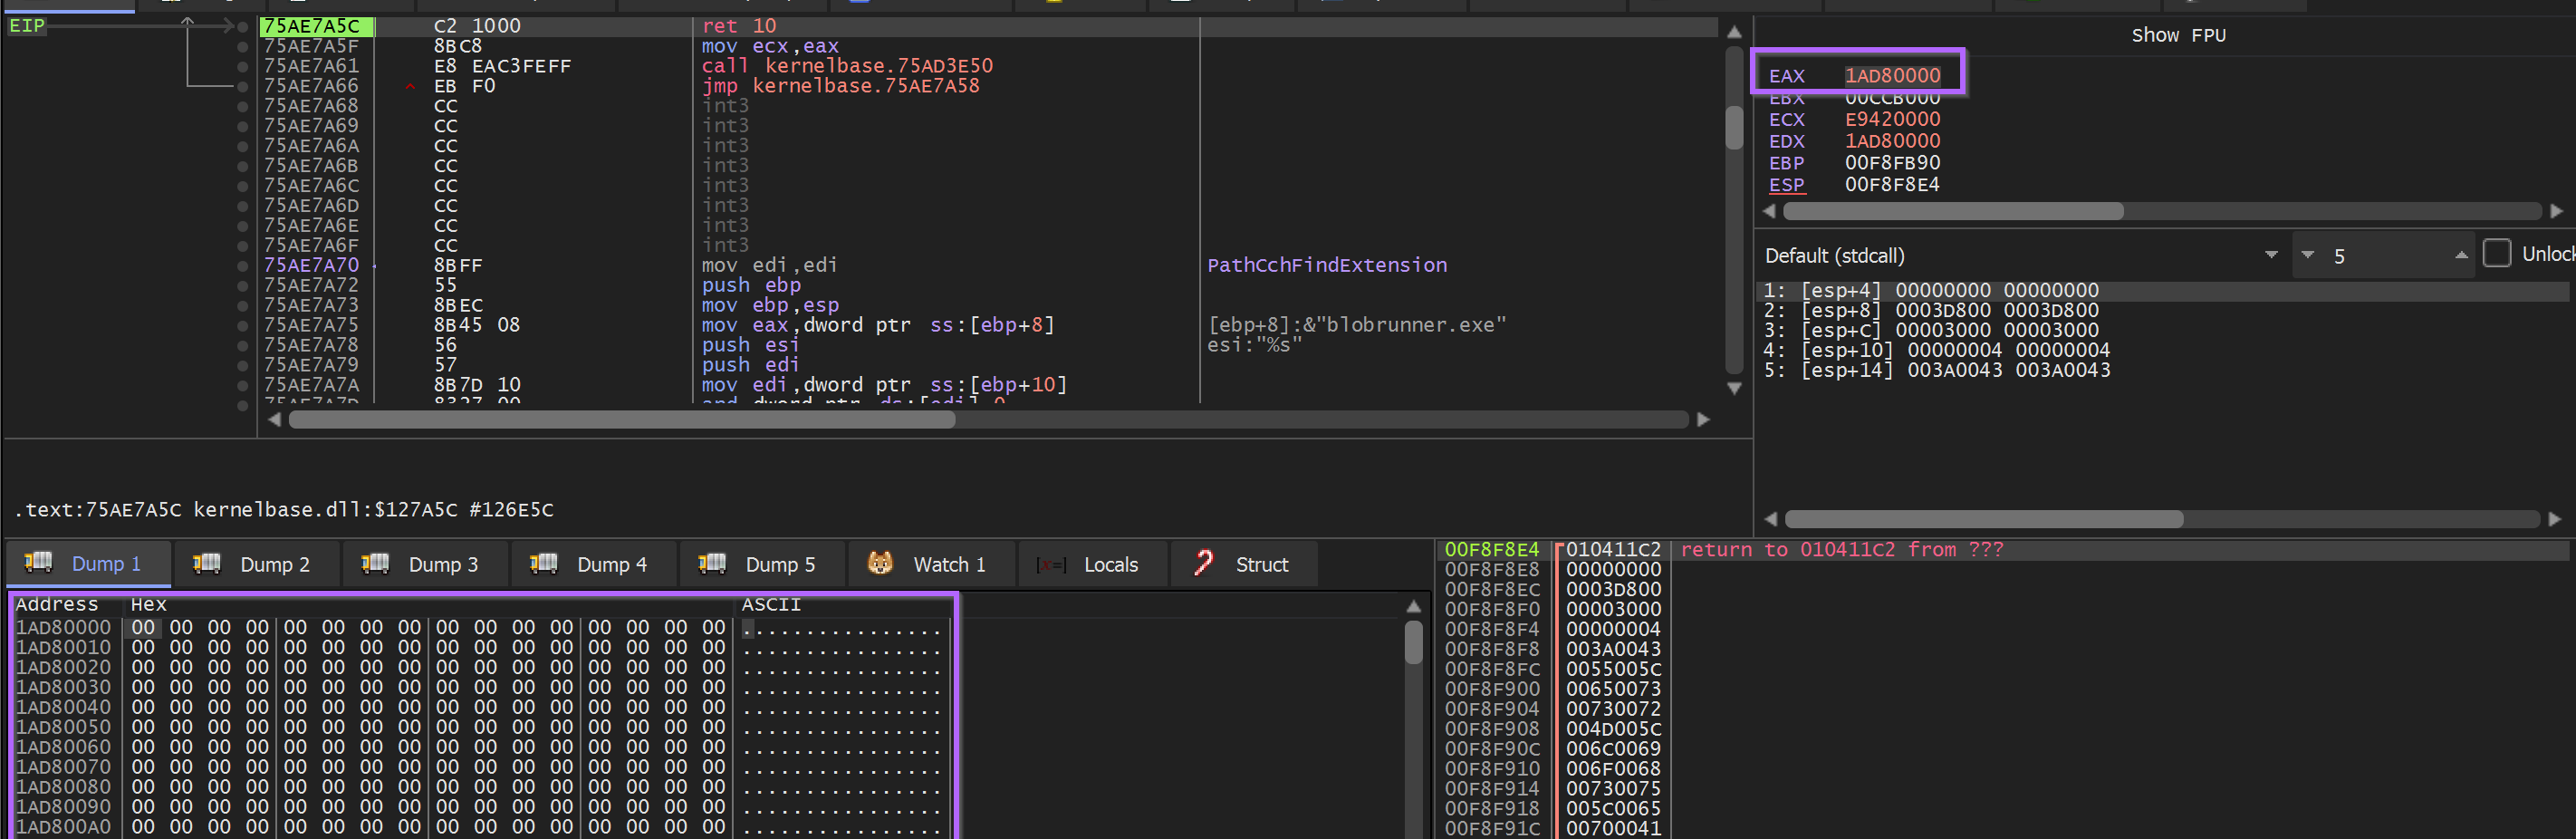
The ReadFile API is then triggered (via auto-created breakpoint) - and the contents of the djdqvq.sra file is loaded into memory in the buffer created byVirtualAlloc .
Here we can see the djdqvq.sra contents in a hex editor.
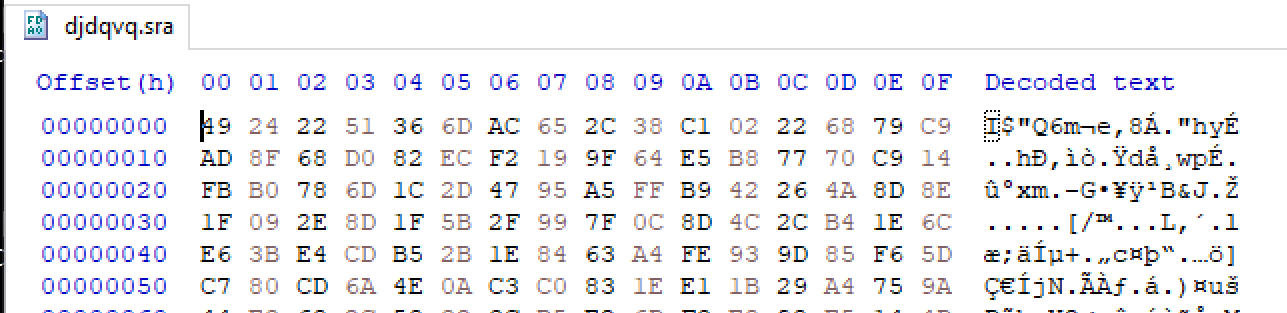
Observing the memory buffer reveals identical contents - confirming that this is djdqvq.sra
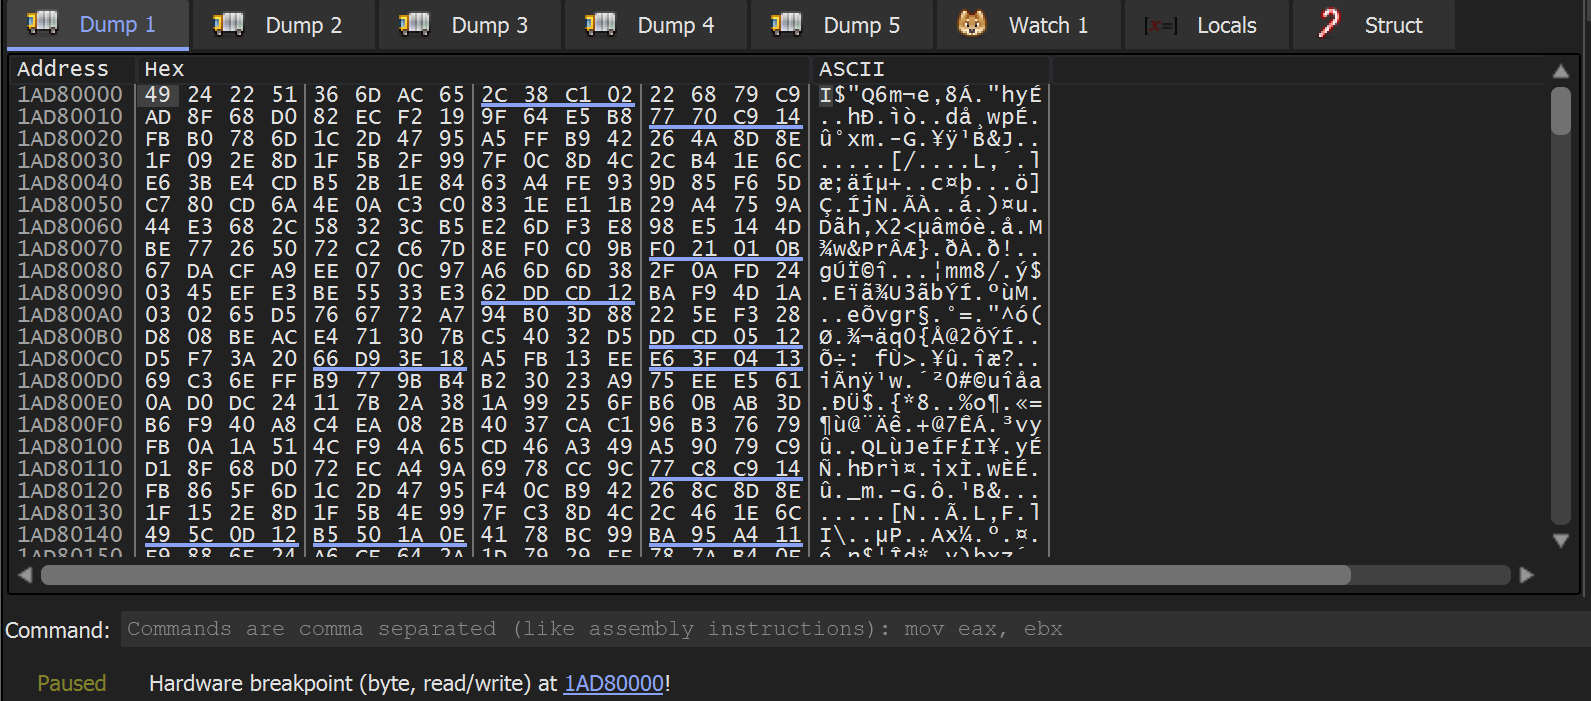
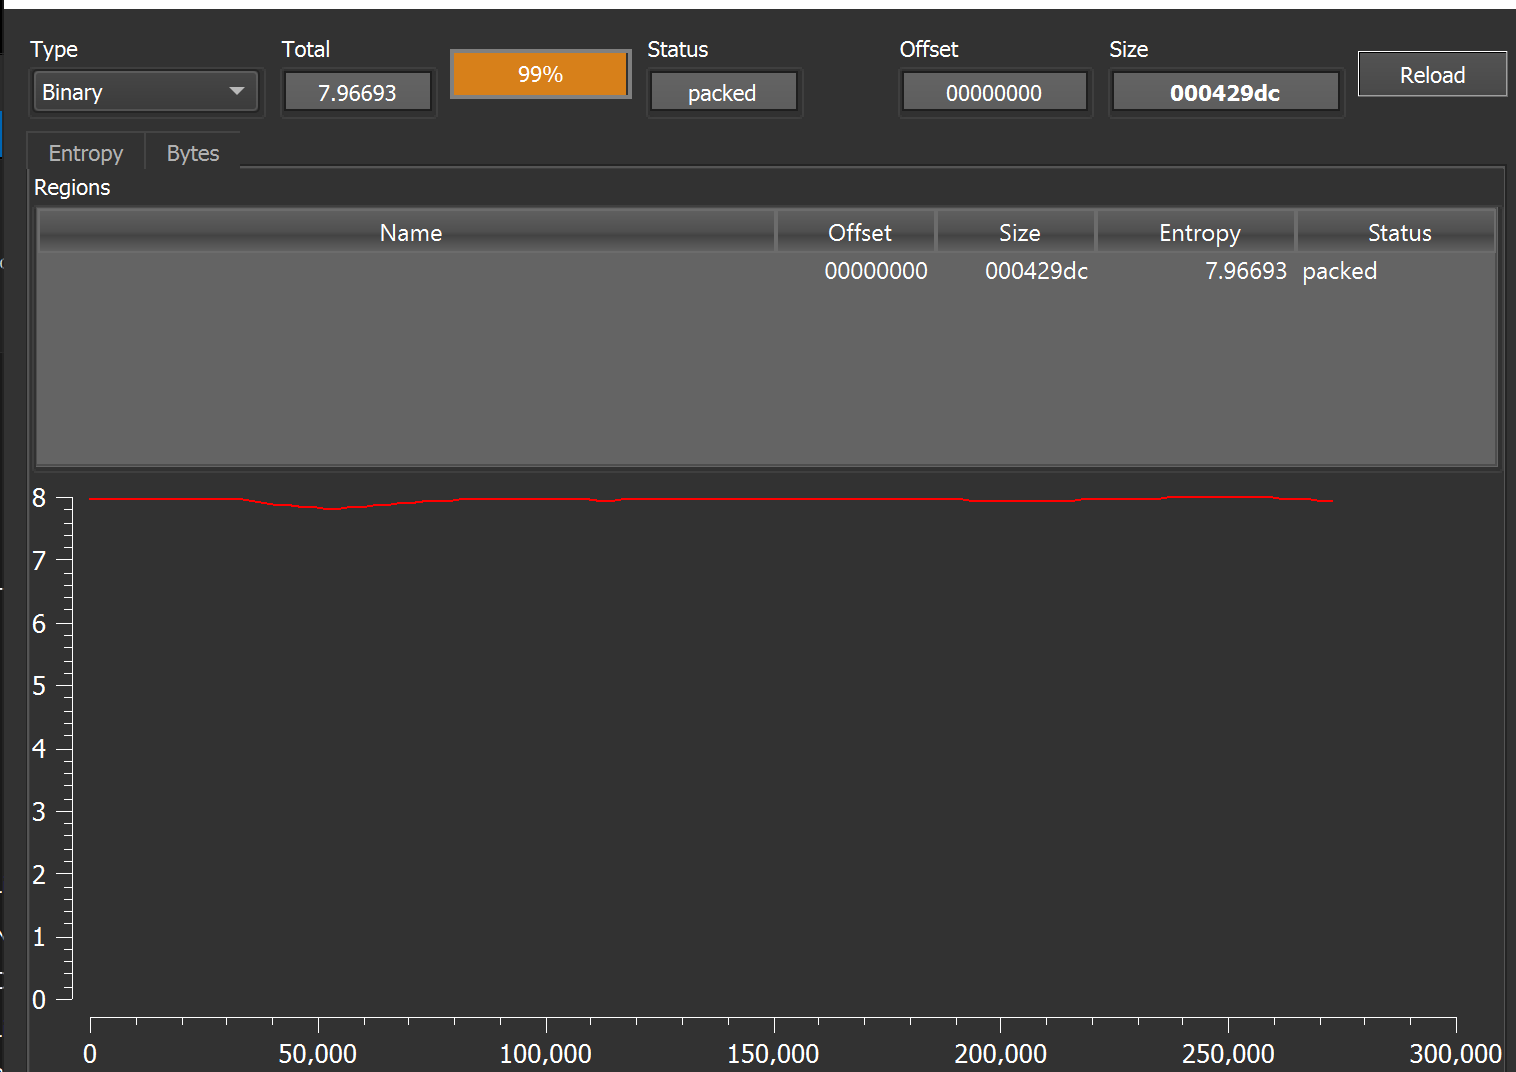
This data is likely encrypted - The Entropy graph is extremely high in detect-it-easy.
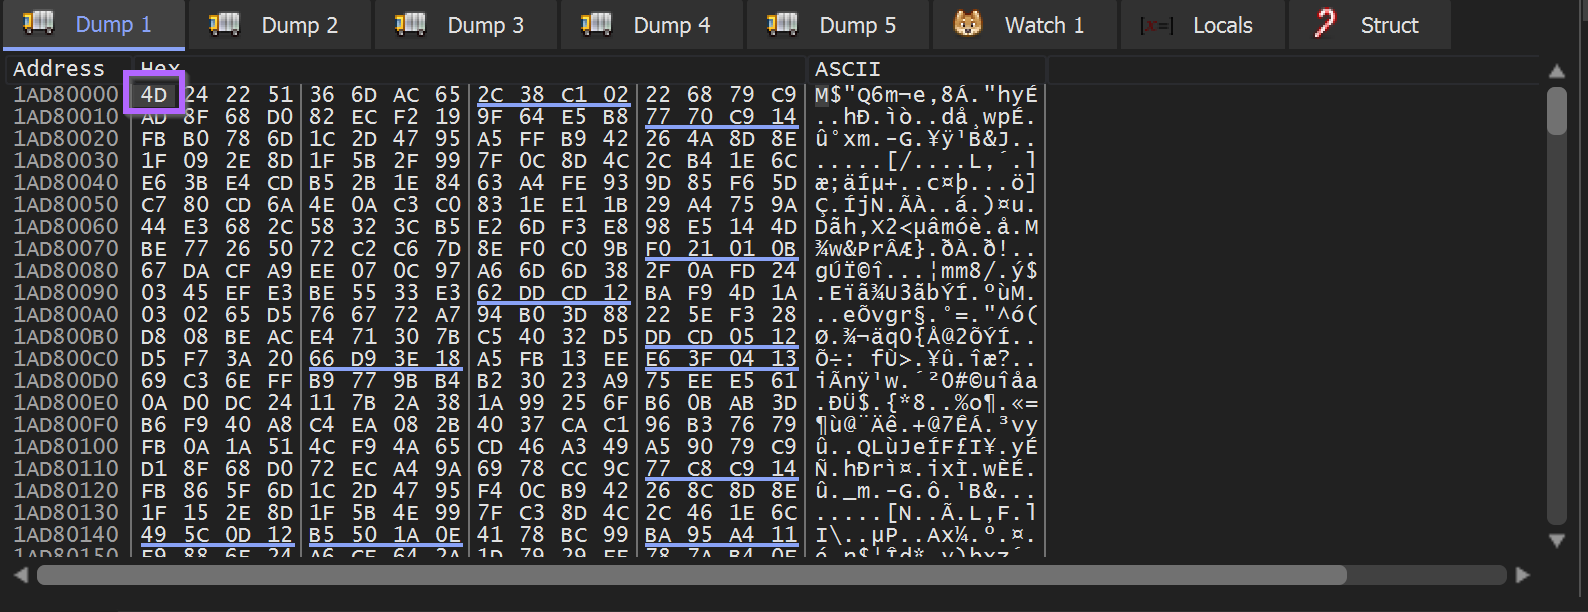
The Malware was allowed to continue execution. This was in hopes that it would trigger another hardware breakpoint during the decoding of the encrypted content.
After continuing (and clicking continue through a few exceptions) - the first byte 49 is turned into a promising 4D , the first half of an MZ 4D 5A header.
The Malware can be allowed to finish decoding using Execute Until Return.
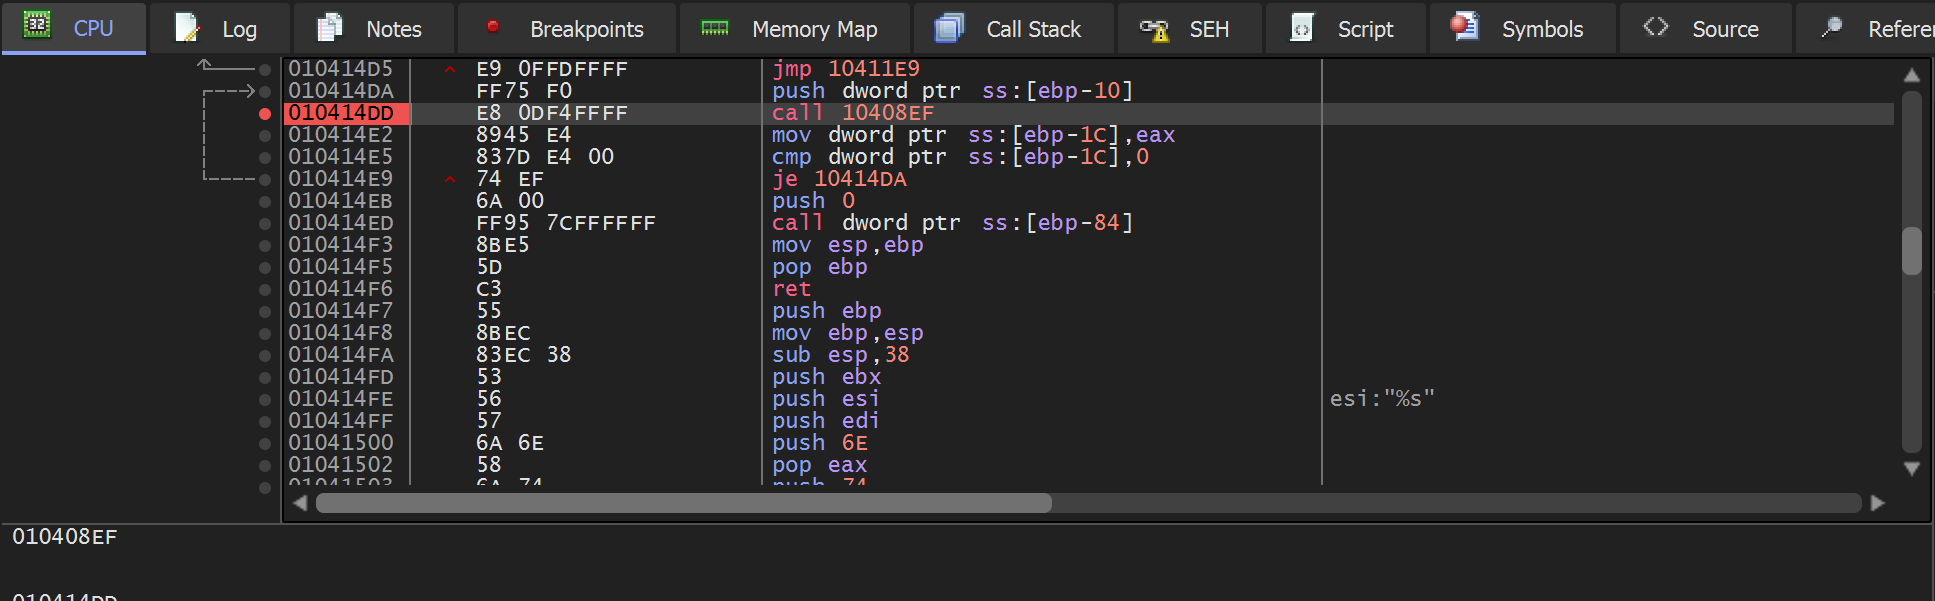
Execute Until Return will work, but can be slow. An alternative is to set a breakpoint on the next call instruction after the triggering of the hardware breakpoint.
In this case, the next call was 2 instructions after the initial hardware breakpoint was triggered.
Once this breakpoint was triggered - a full PE file could be observed in the memory buffer.
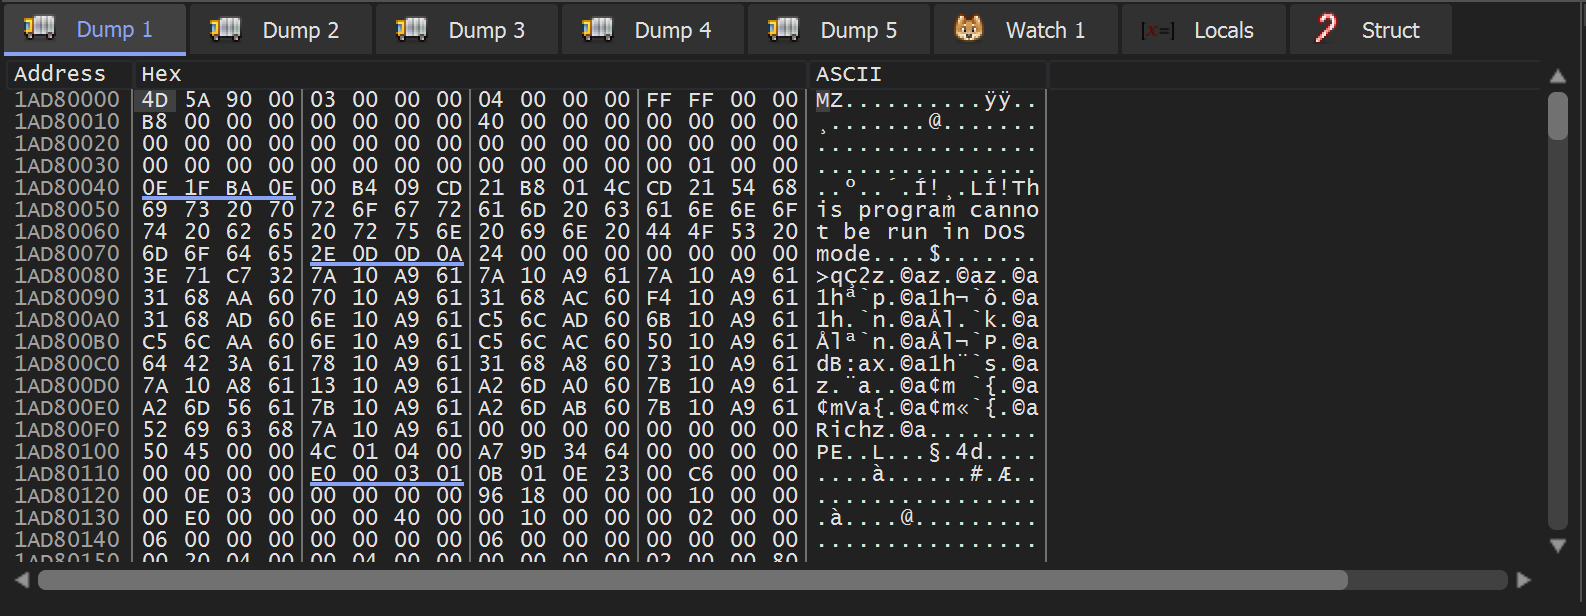
The PE File can be saved to disk using Follow in Memory map and Dump Memory To File.
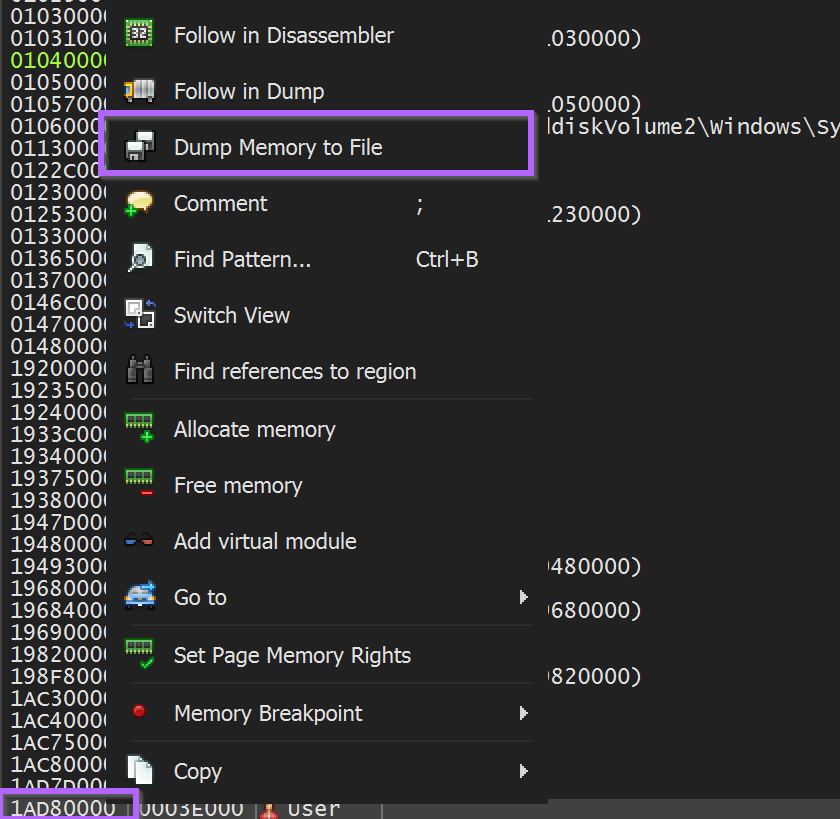
I saved the file as unpacked.bin
Analysis of unpacked.bin
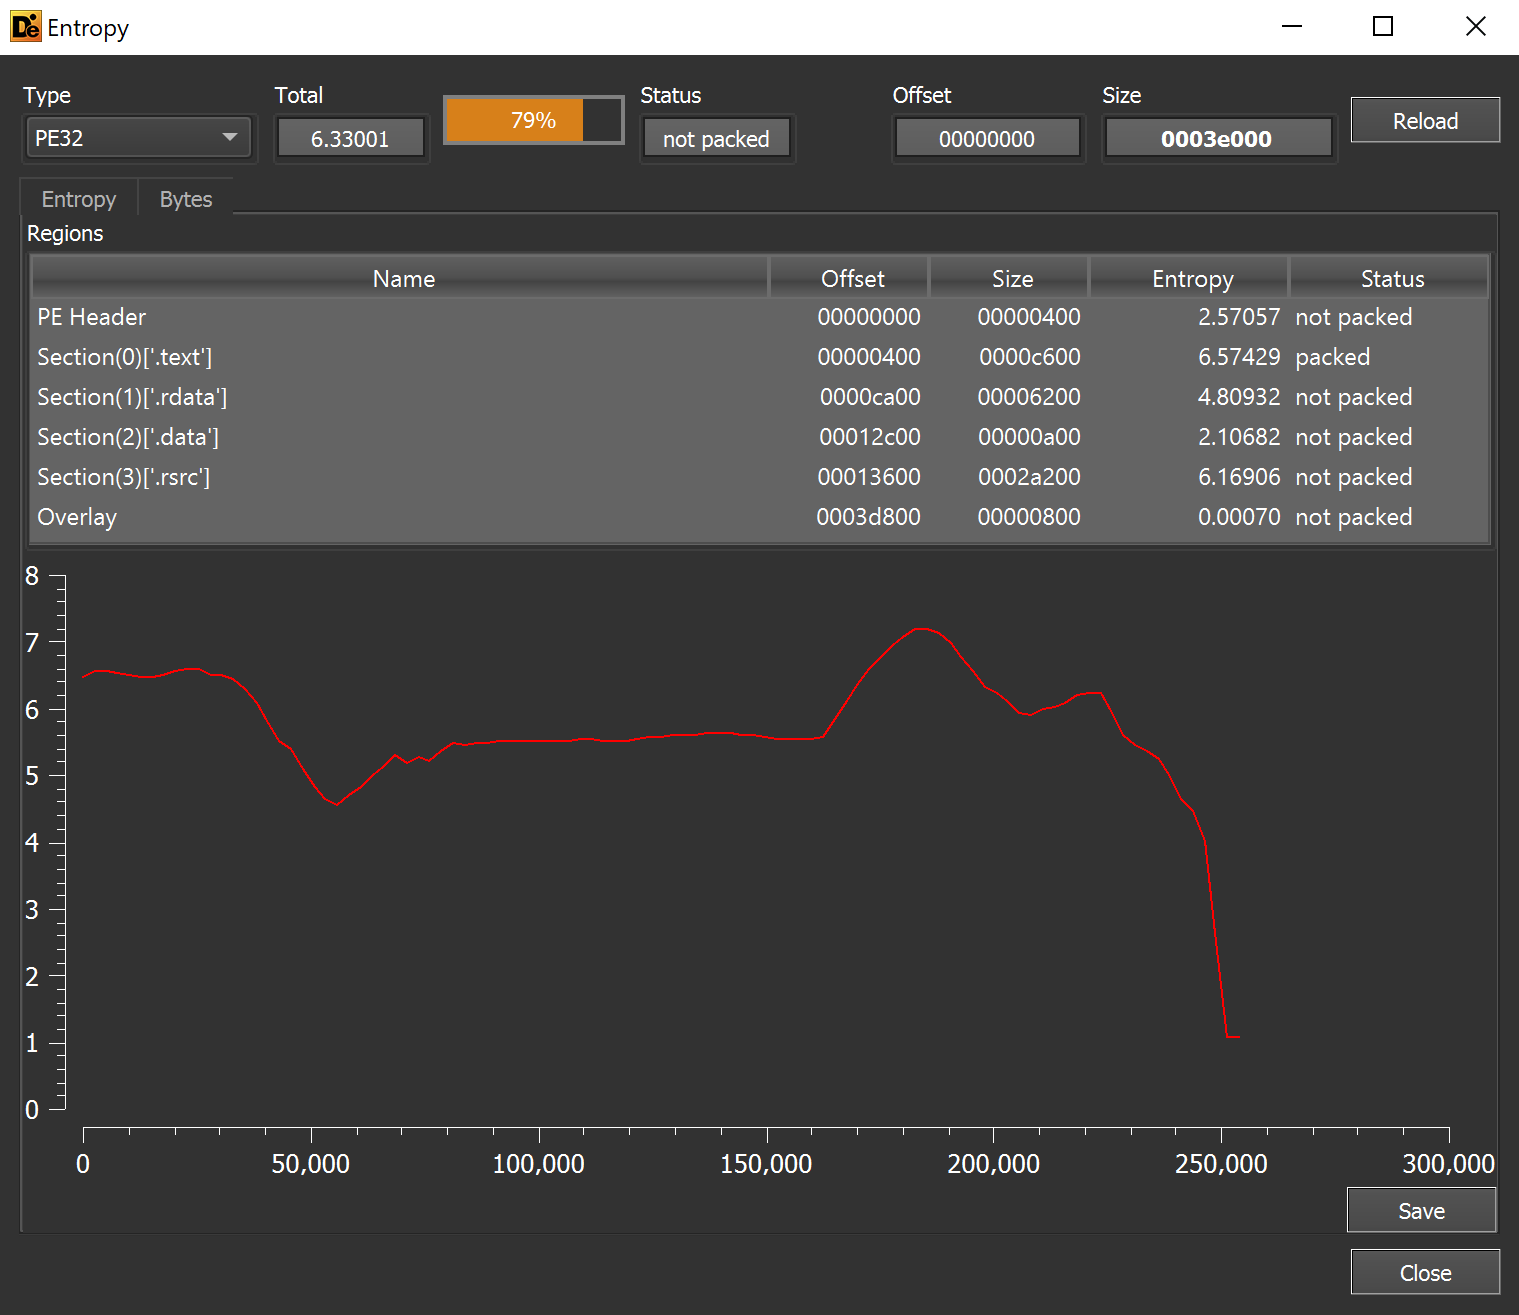
This unpacked.bin file was a 248KB PE - without any recognized packers or obfuscation.
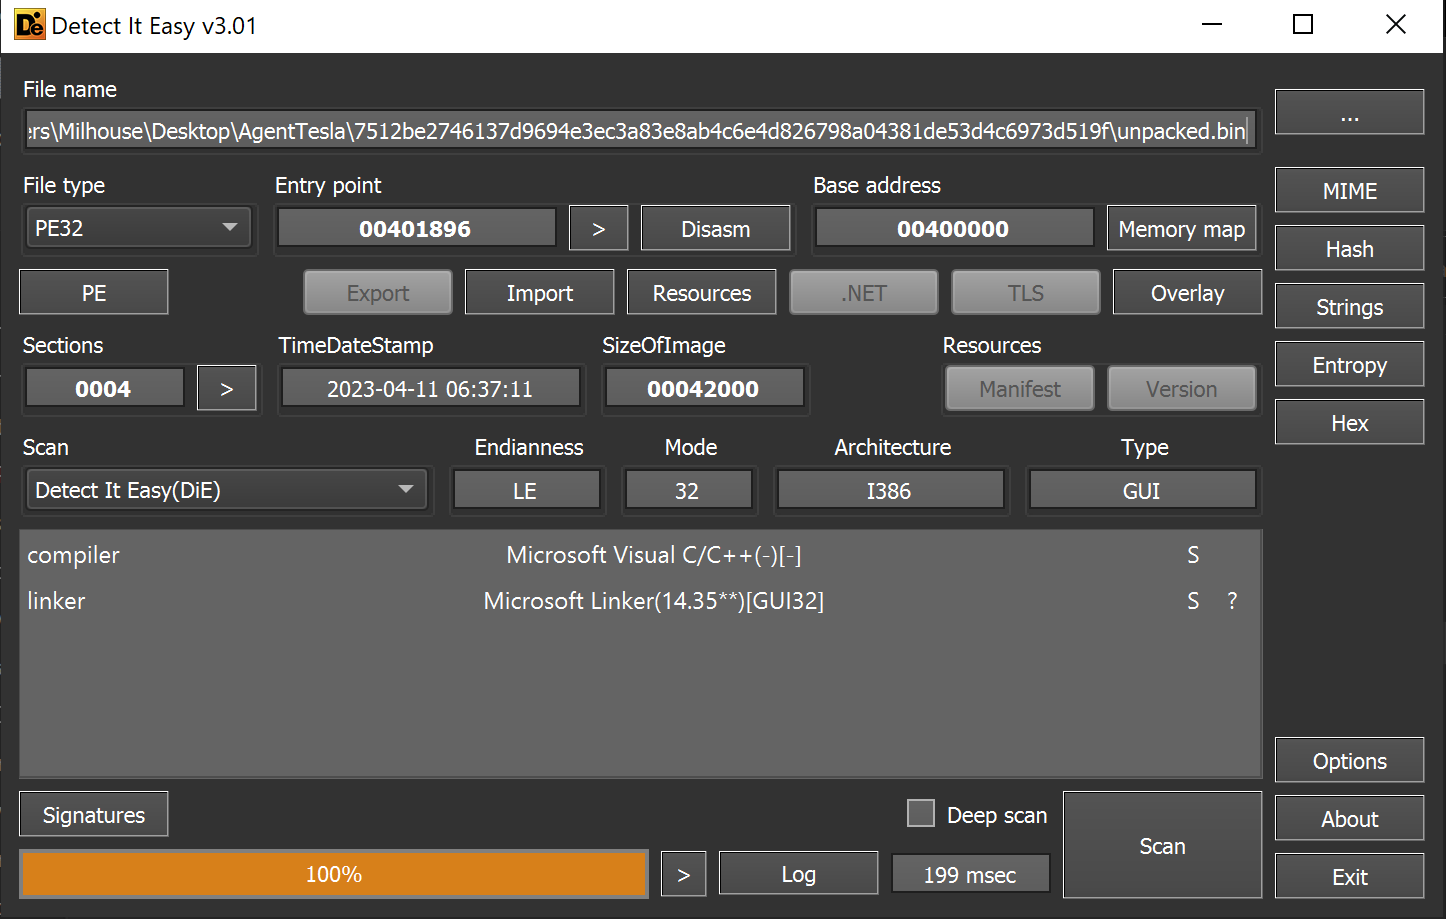
Based on the entropy graph - there were no glaring signs of hidden encrypted files or content.
Reviewing the imported functions - there was a suspicious reference to CLRCreateInstance. This is typical when a file contains an embedded .NET payload.
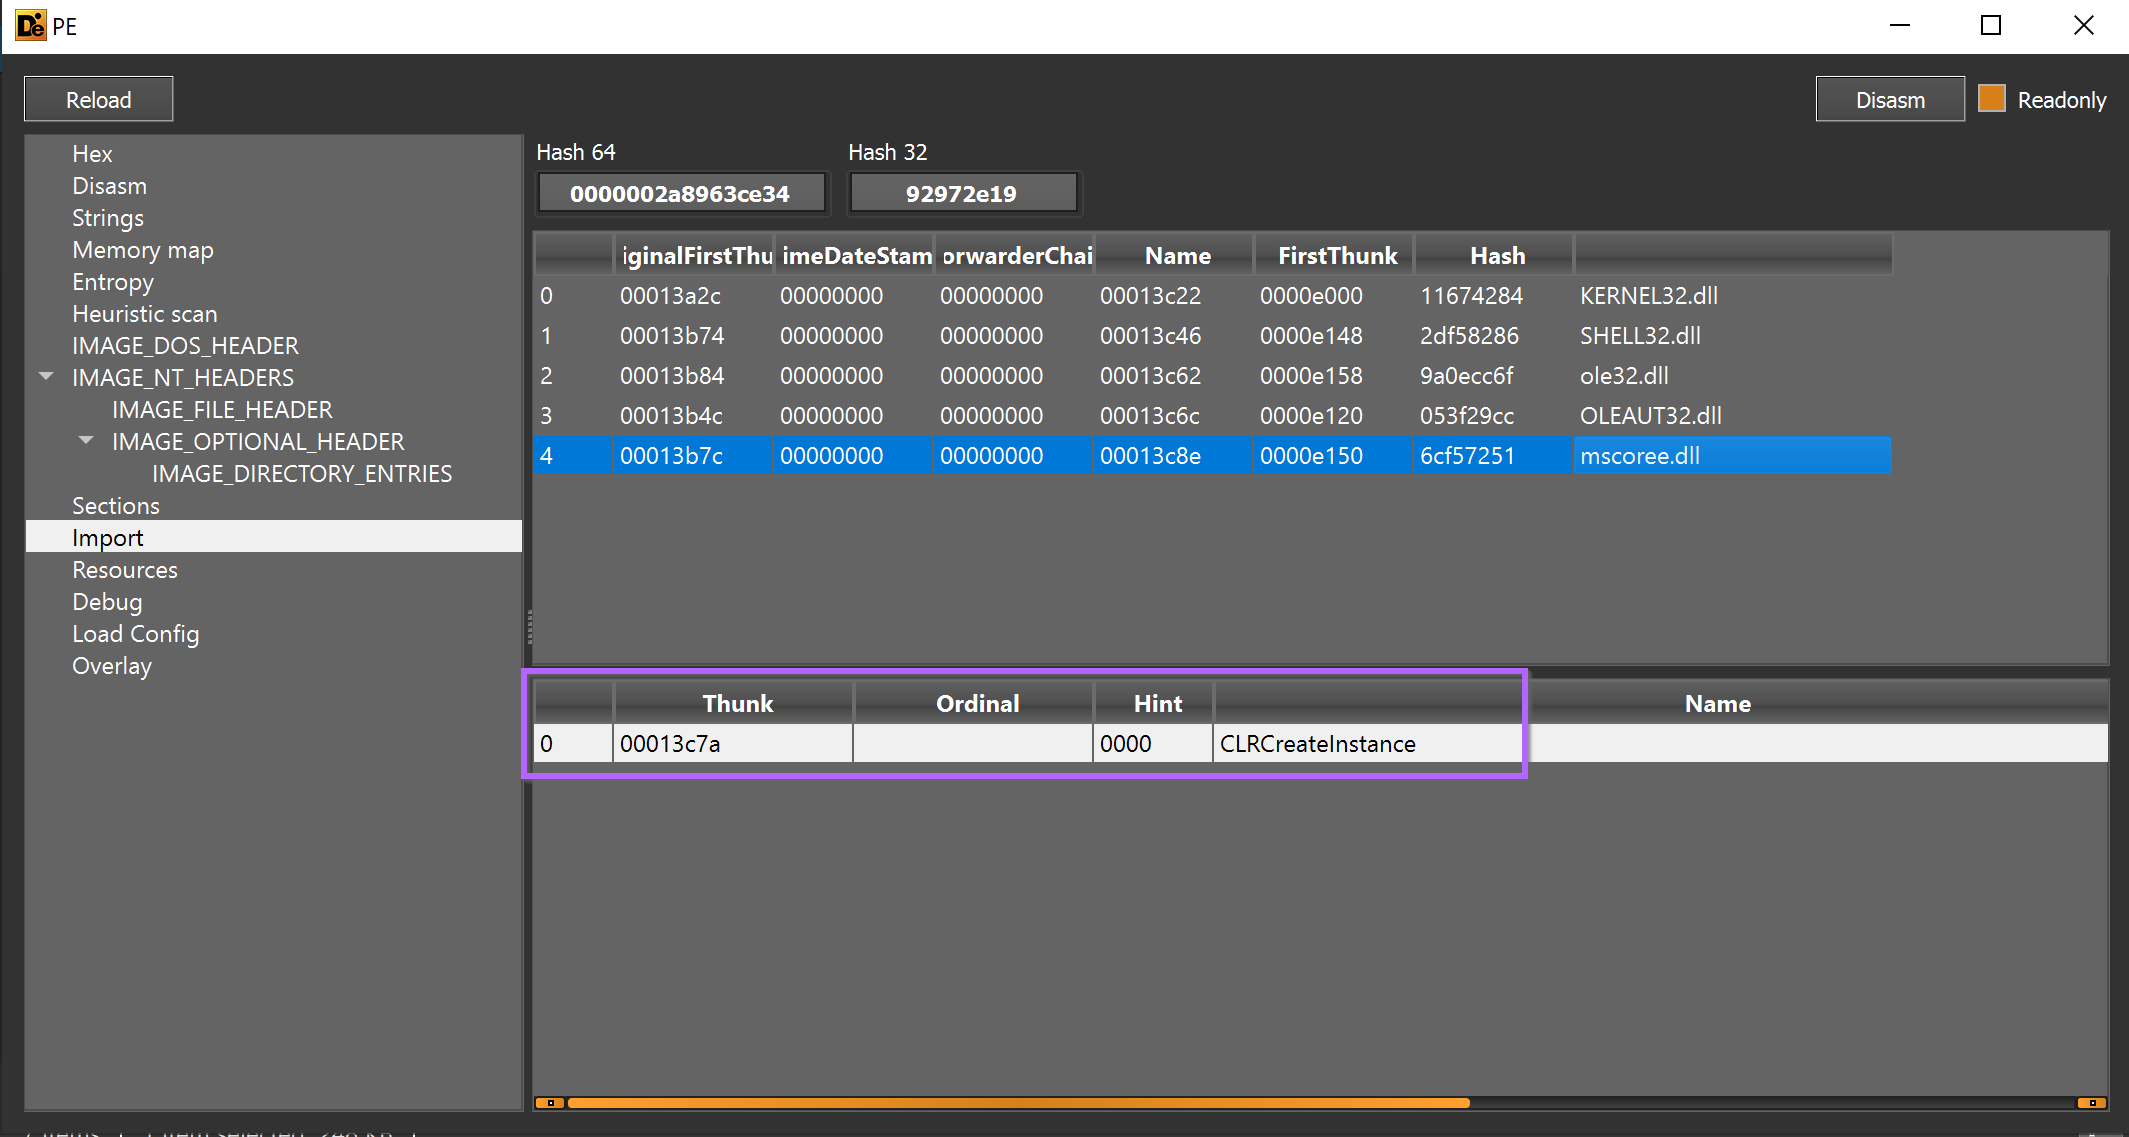
I loaded the file into Ghidra and checked x-refs (cross-references) to CLRCreateInstance. The API was called only once from the function FUN_00401000.
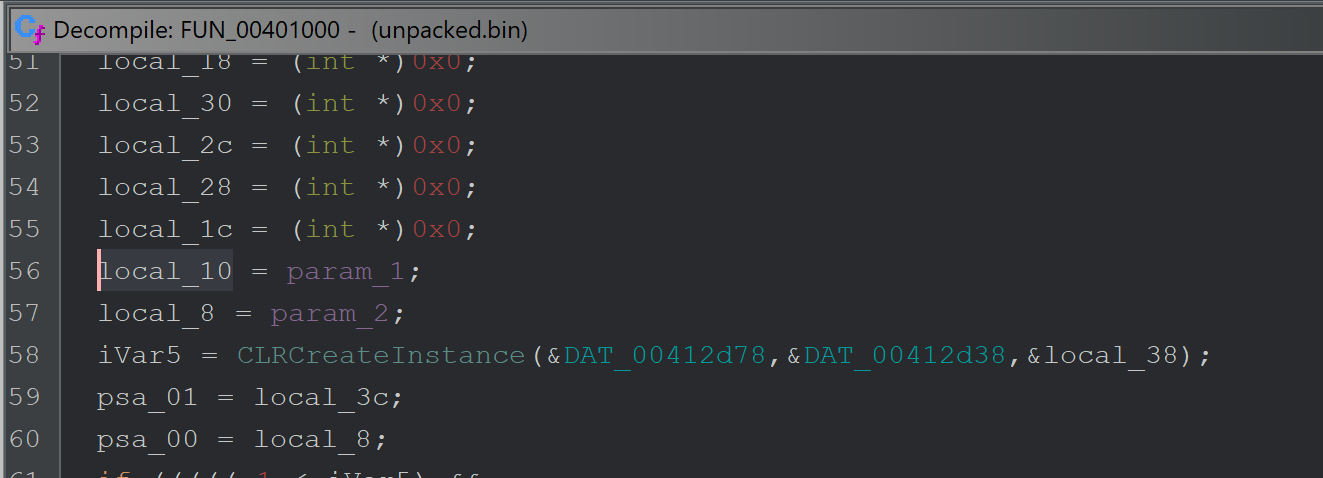
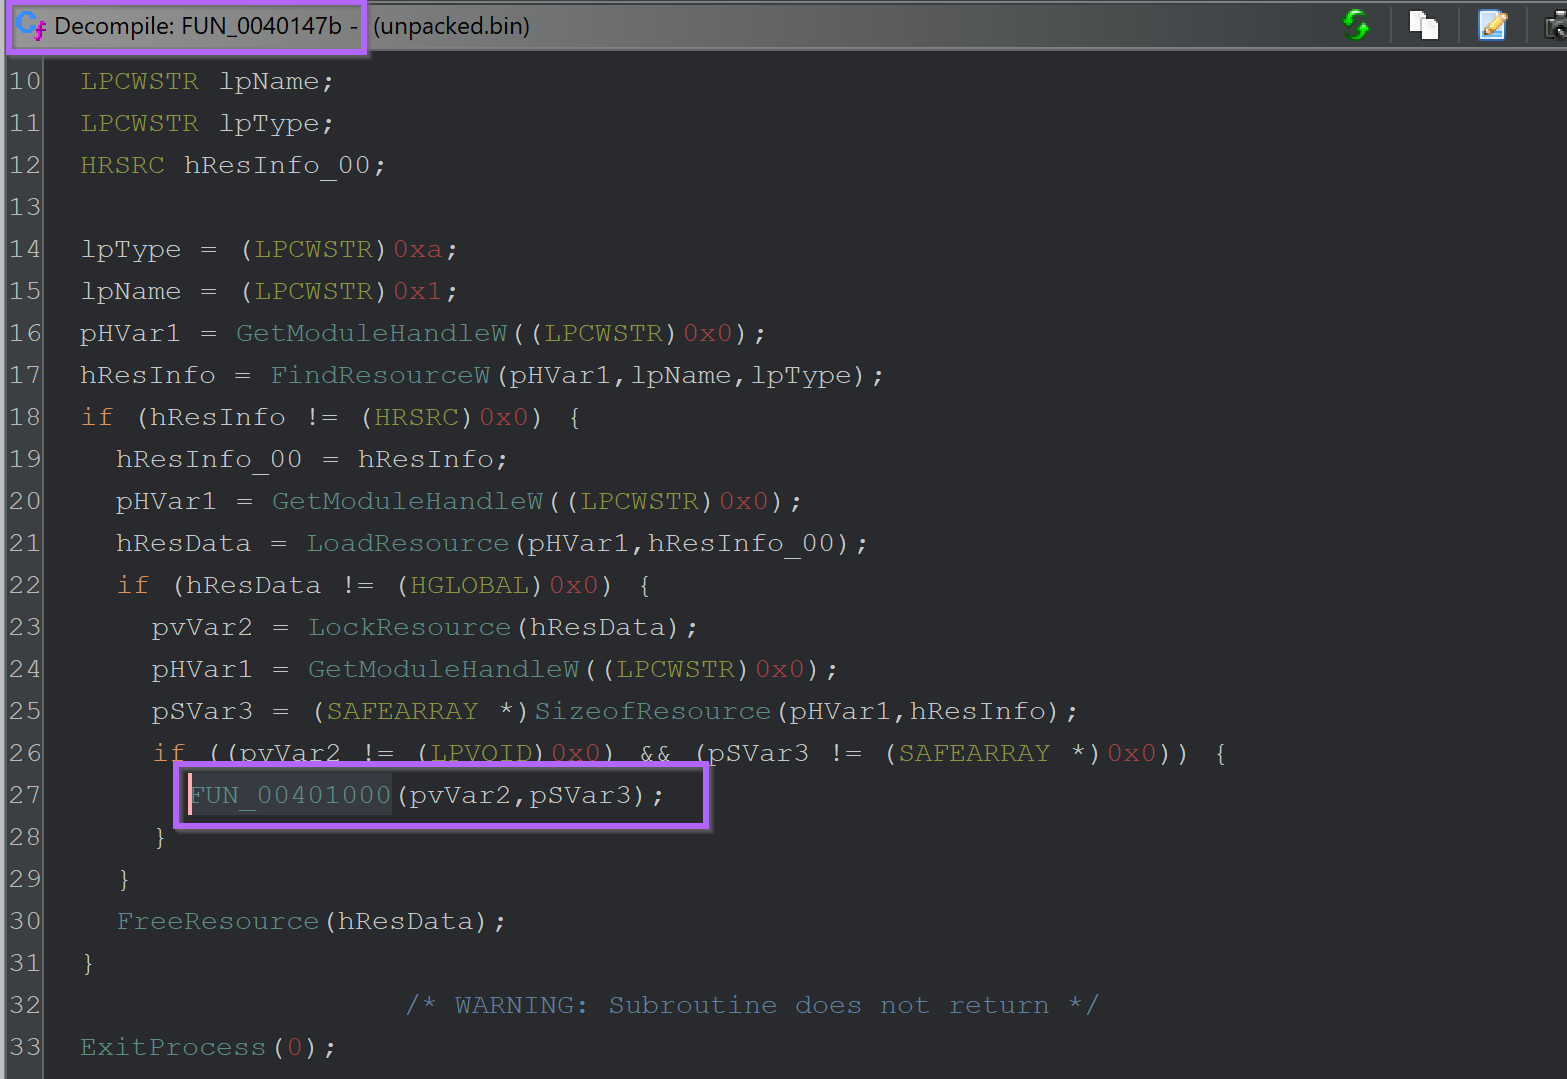
CLRCreateInstance is called only once from the function FUN_00401000 - which itself is only called once from FUN_0040147b.
The function FUN_0040147b that eventually calls CLRCreateInstance, is responsible for loading an embedded resource and passing it to the CLRCreateInstance function.
Below you can see references to FindResourceW and LoadResource - prior to calling the function which contains CLRCreateInstance
Checking the unpacked.bin file using resource hacker. An embedded pe file can be observed in the resource section.
Since this resource is not encrypted or obfuscated, there were no signs of embedded content in the Entropy Graph.
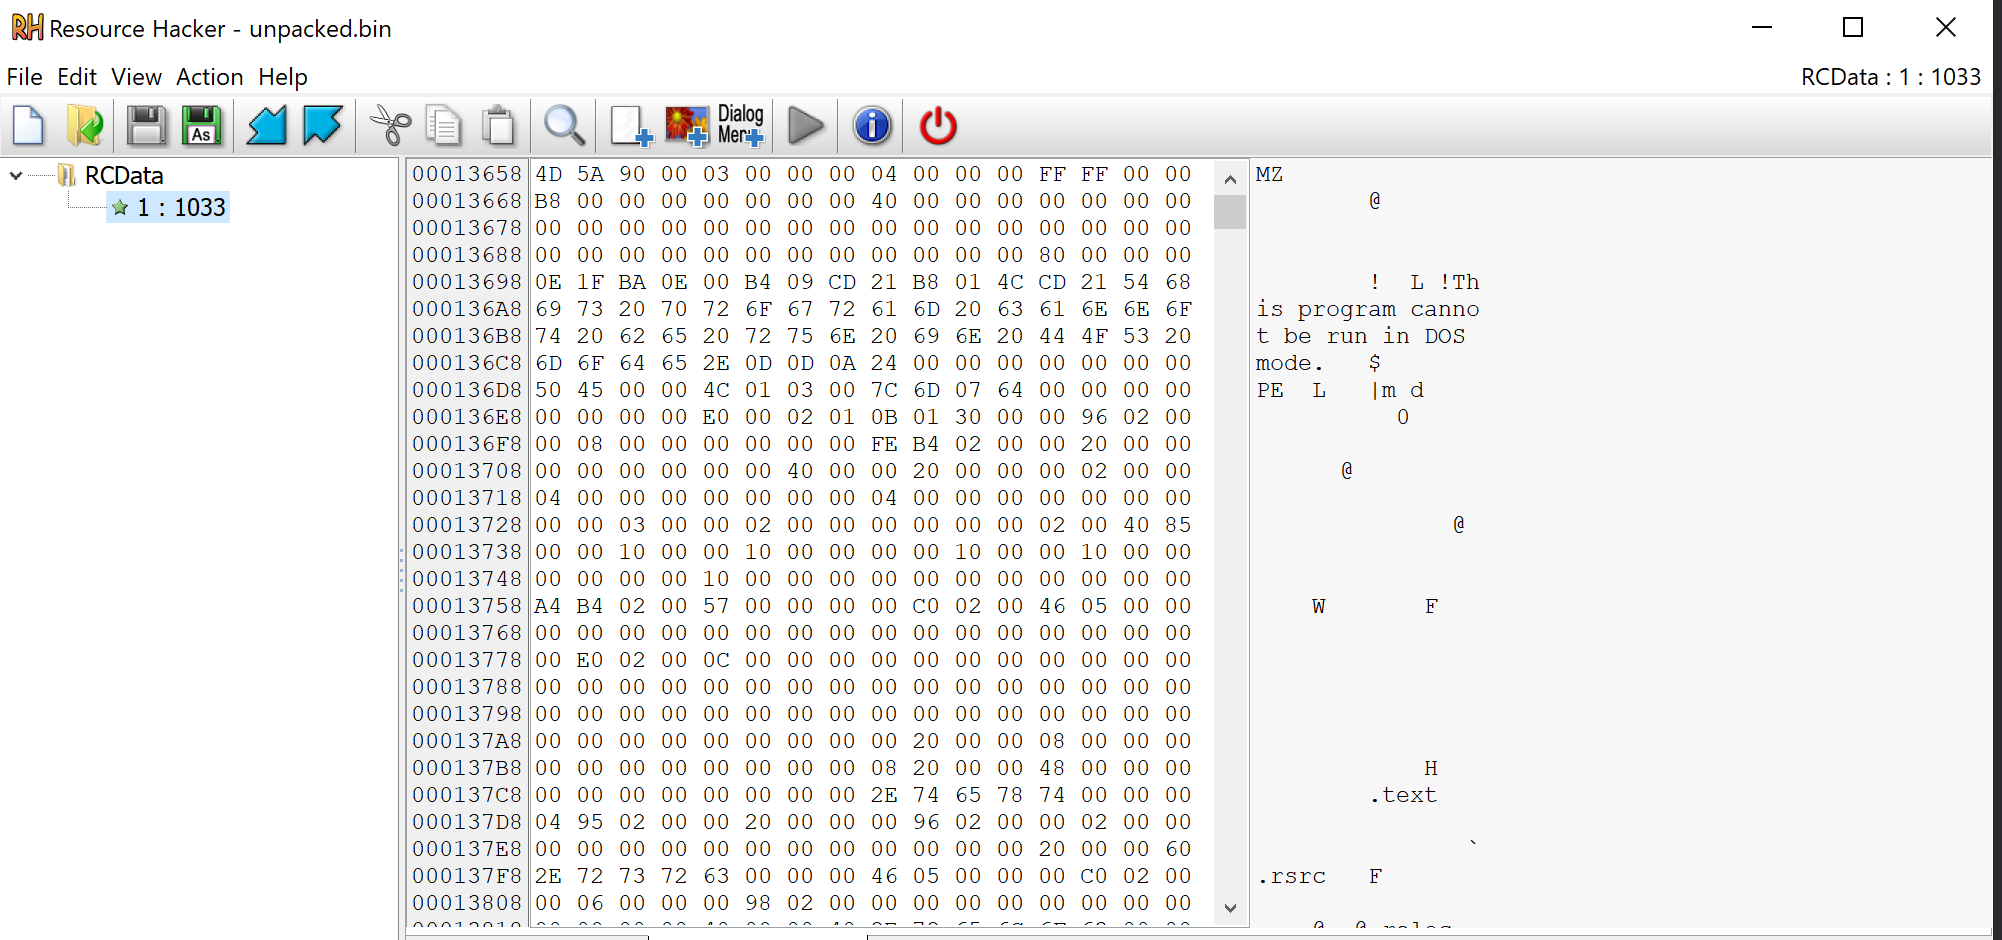
Since the file was named resource 1 - I lazily saved the file as 1.bin.
Analysis of The Final Stage
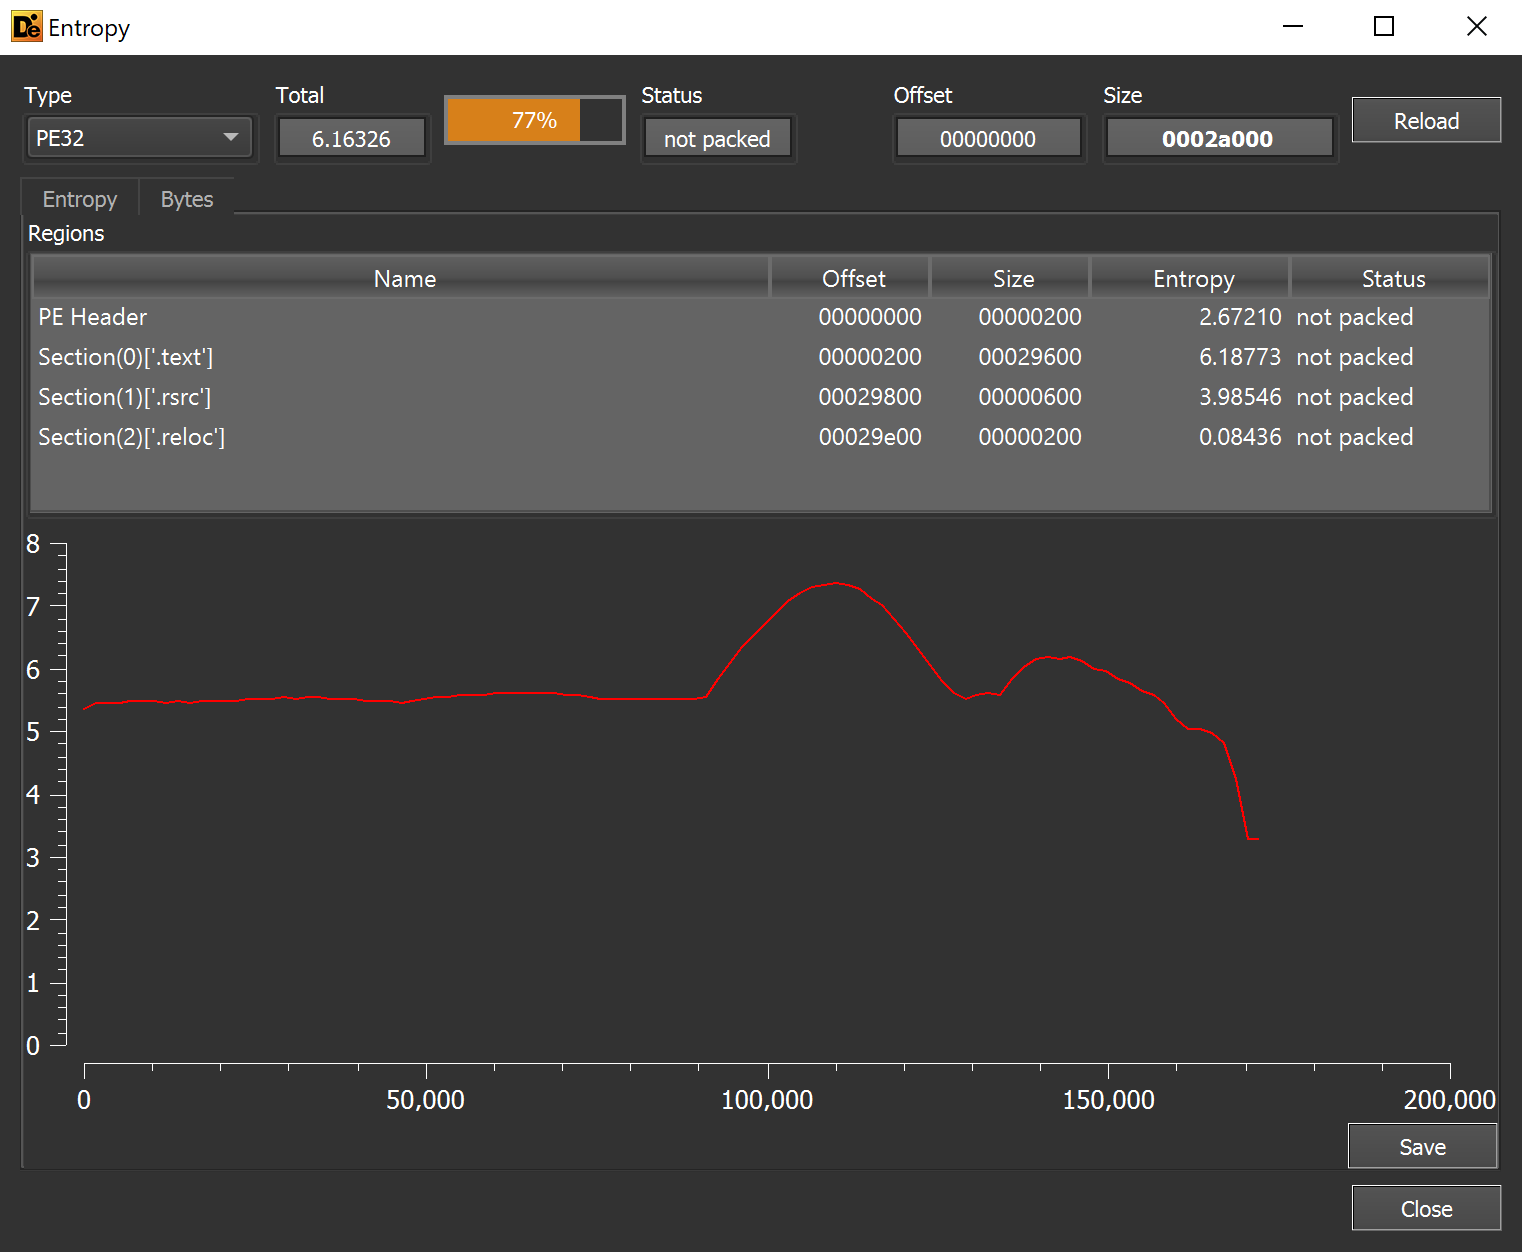
I again used detect-it-easy - which revealed the file was a .NET based program.
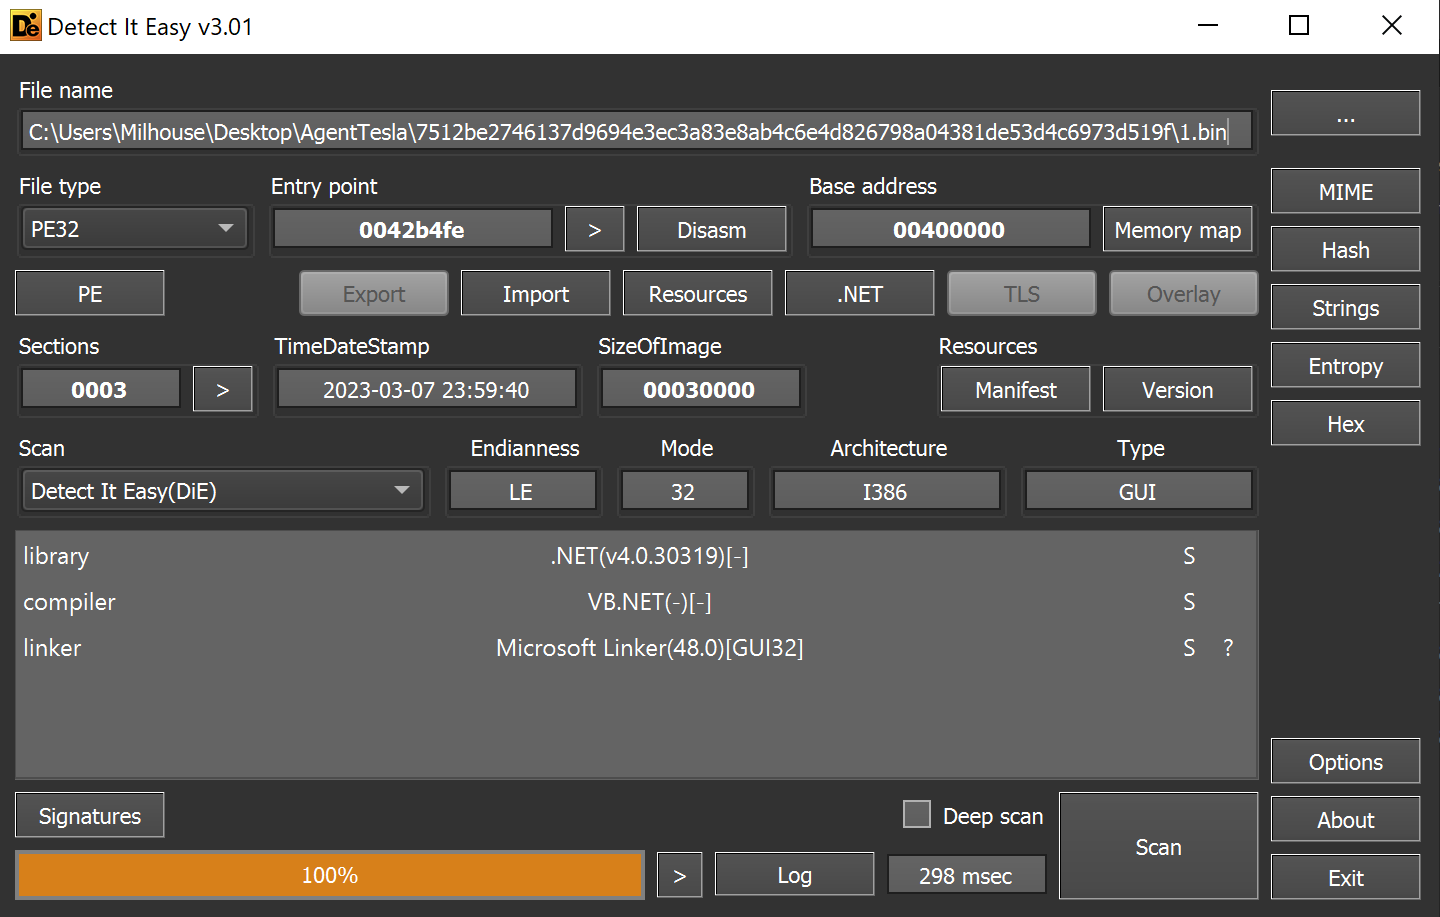
There are no significant areas of high entropy, but there is a large flat section that may contain something interesting and/or badly obfuscated.
1.bin was loaded into Dnspy for additional analysis.
Dnspy revealed a lot of obfuscation and functions that were difficult to analyse,
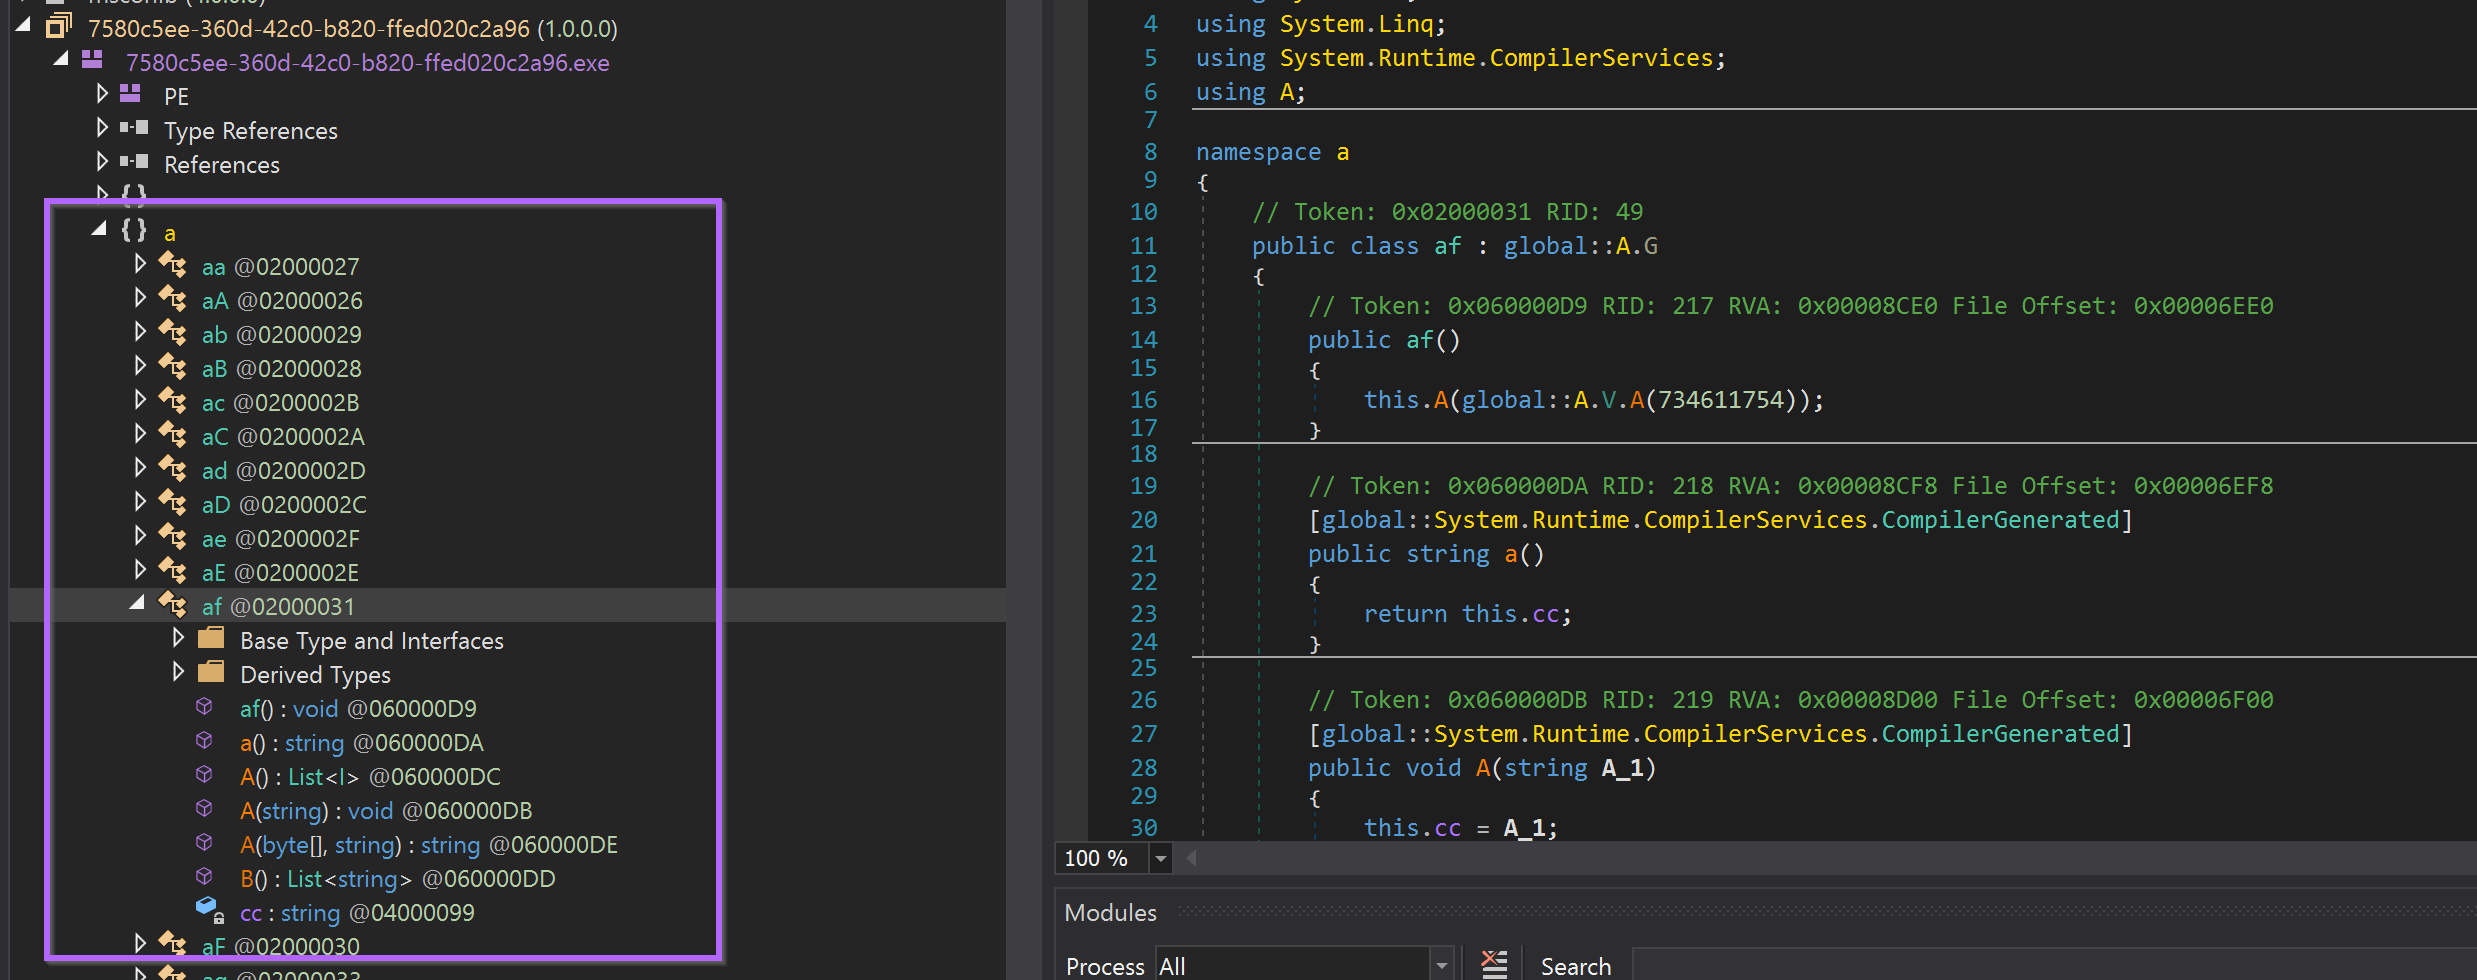
It would be possible to analyse this obfuscation and manually rename each function, but that process is extremely tedious and time-consuming.
Instead, I decided to use a tool called Garbageman. (Download Link Here)
Garbageman is a tool that can run a .NET program, and automatically capture strings and byte arrays that were created in memory.
TLDR: You can run .NET Malware and easily obtain strings, embedded payloads and (if you're lucky) C2 information.
Garbageman can be downloaded from the release page and then transferred into an analysis machine.
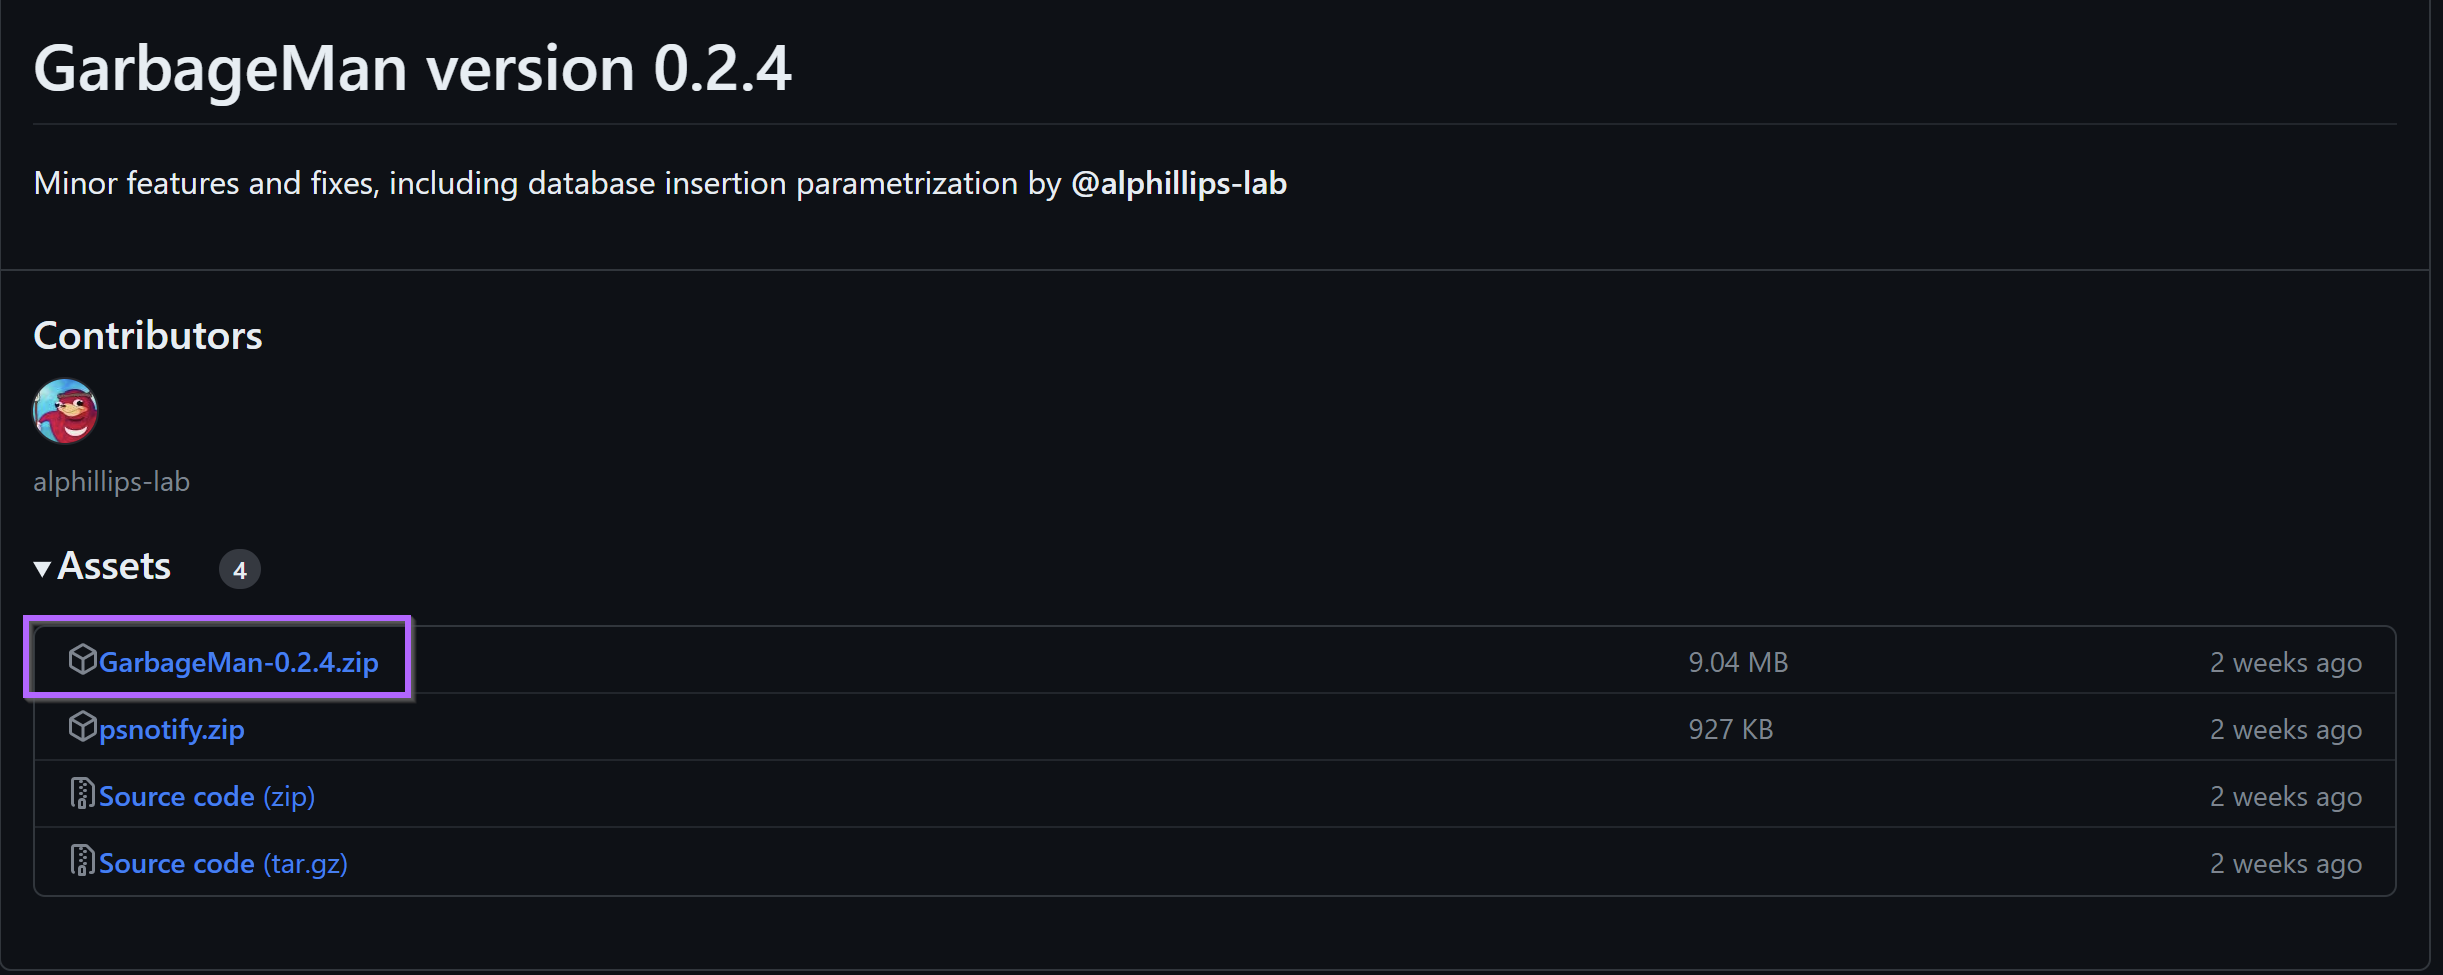
From here the release can be unzipped as a regular zip file.
(Note that 7-zip failed to unzip on my analysis machine, but the built-in unzip tool worked just fine - right click -> open with -> windows explorer to unzip with the regular windows zip handler.
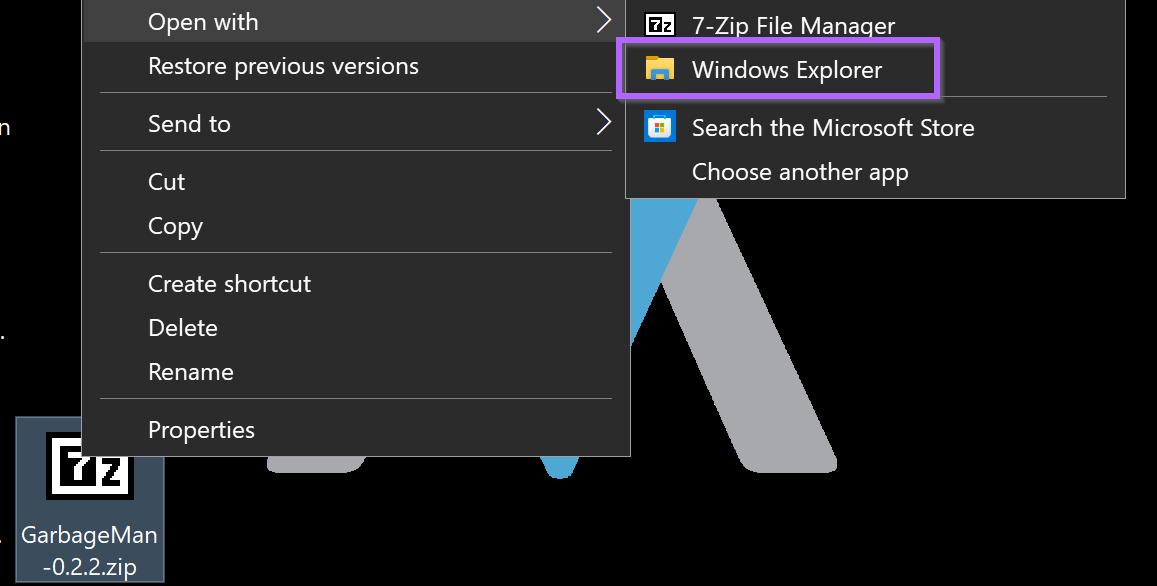
This will create a folder containing Garbageman.exe
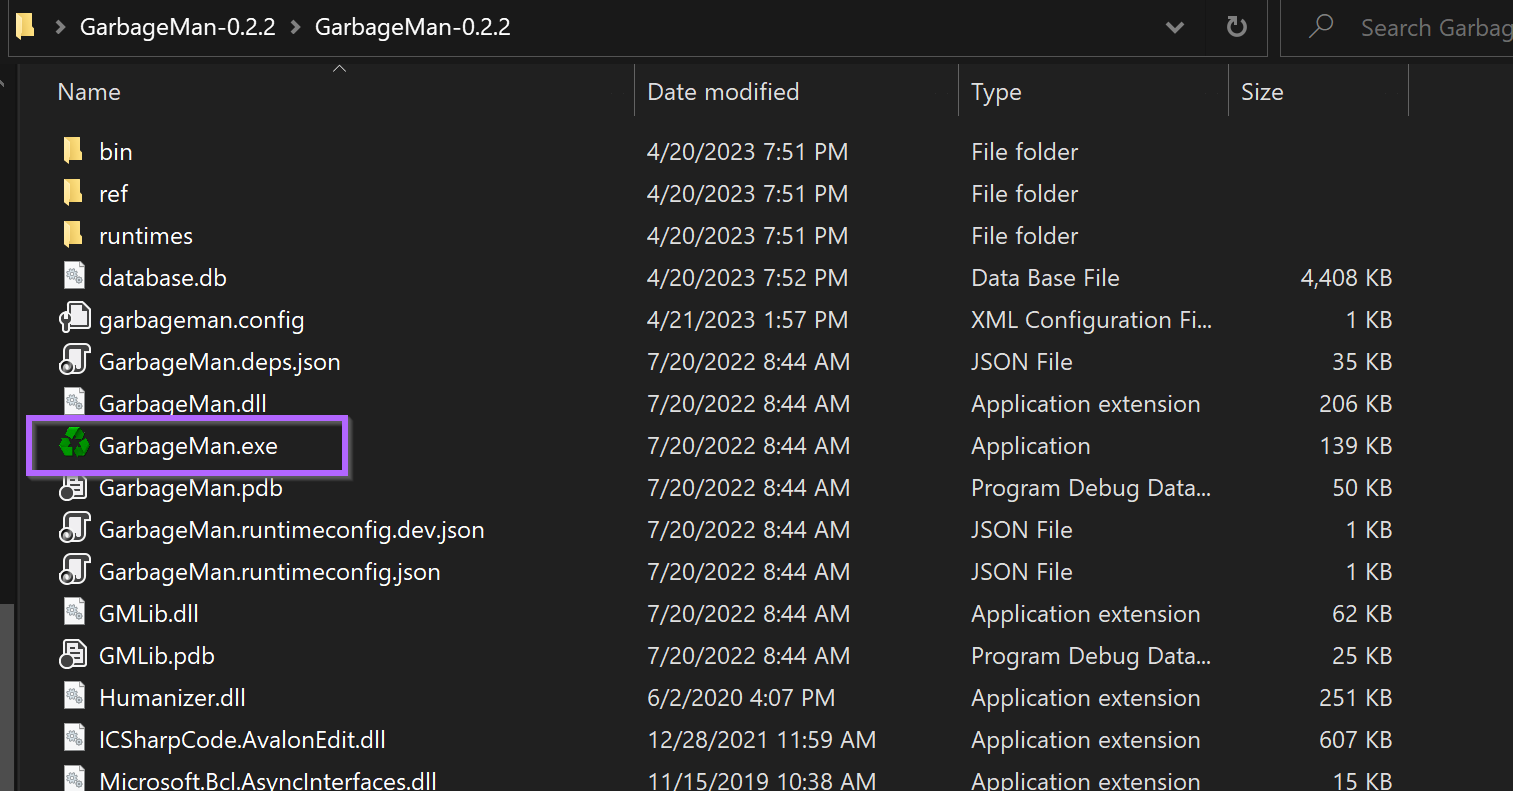
Running Garbageman
Garbageman can be run by directly executing the Garbageman.exe file.
To run a suspicious file using Garbageman, File -> New -> Execute
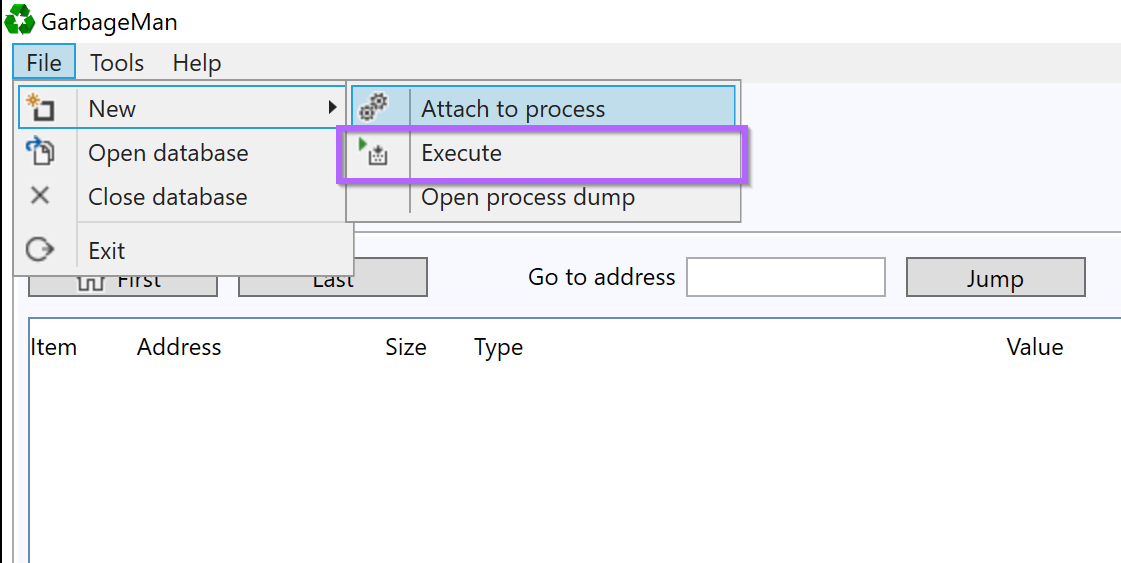
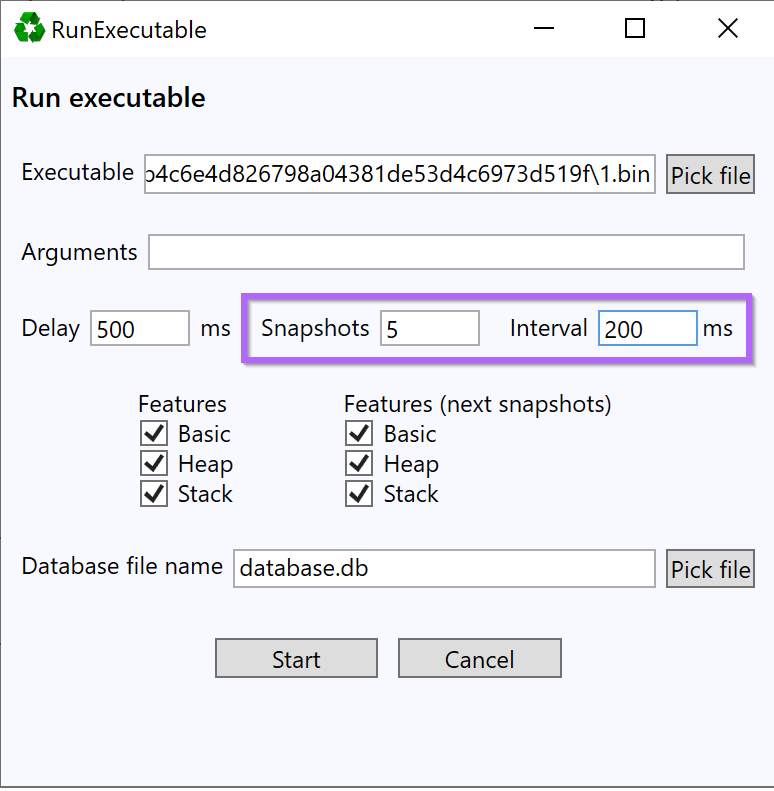
The full path to 1.bin will need to be specified in the executable option.
Most of the remaining options can largely be run as default - with a few changes…
- Increase the snapshots to
5 - Set the interval to
200ms.
This will create 5 snapshots - at 500ms, 700ms, 900ms, 1100ms and 1300ms.
The exact timings don’t matter - but it is ideal to get multiple snapshots from the first 1-2 seconds of execution.
Once this is set - you can select “Start”
This will run the tool and capture relevant snapshots. After which a menu like this will be presented.,
This admittedly looks confusing - but for the most part - only the bottom left corner is important.
The bottom left corner is what allows you to search and view content that was captured in the snapshots.
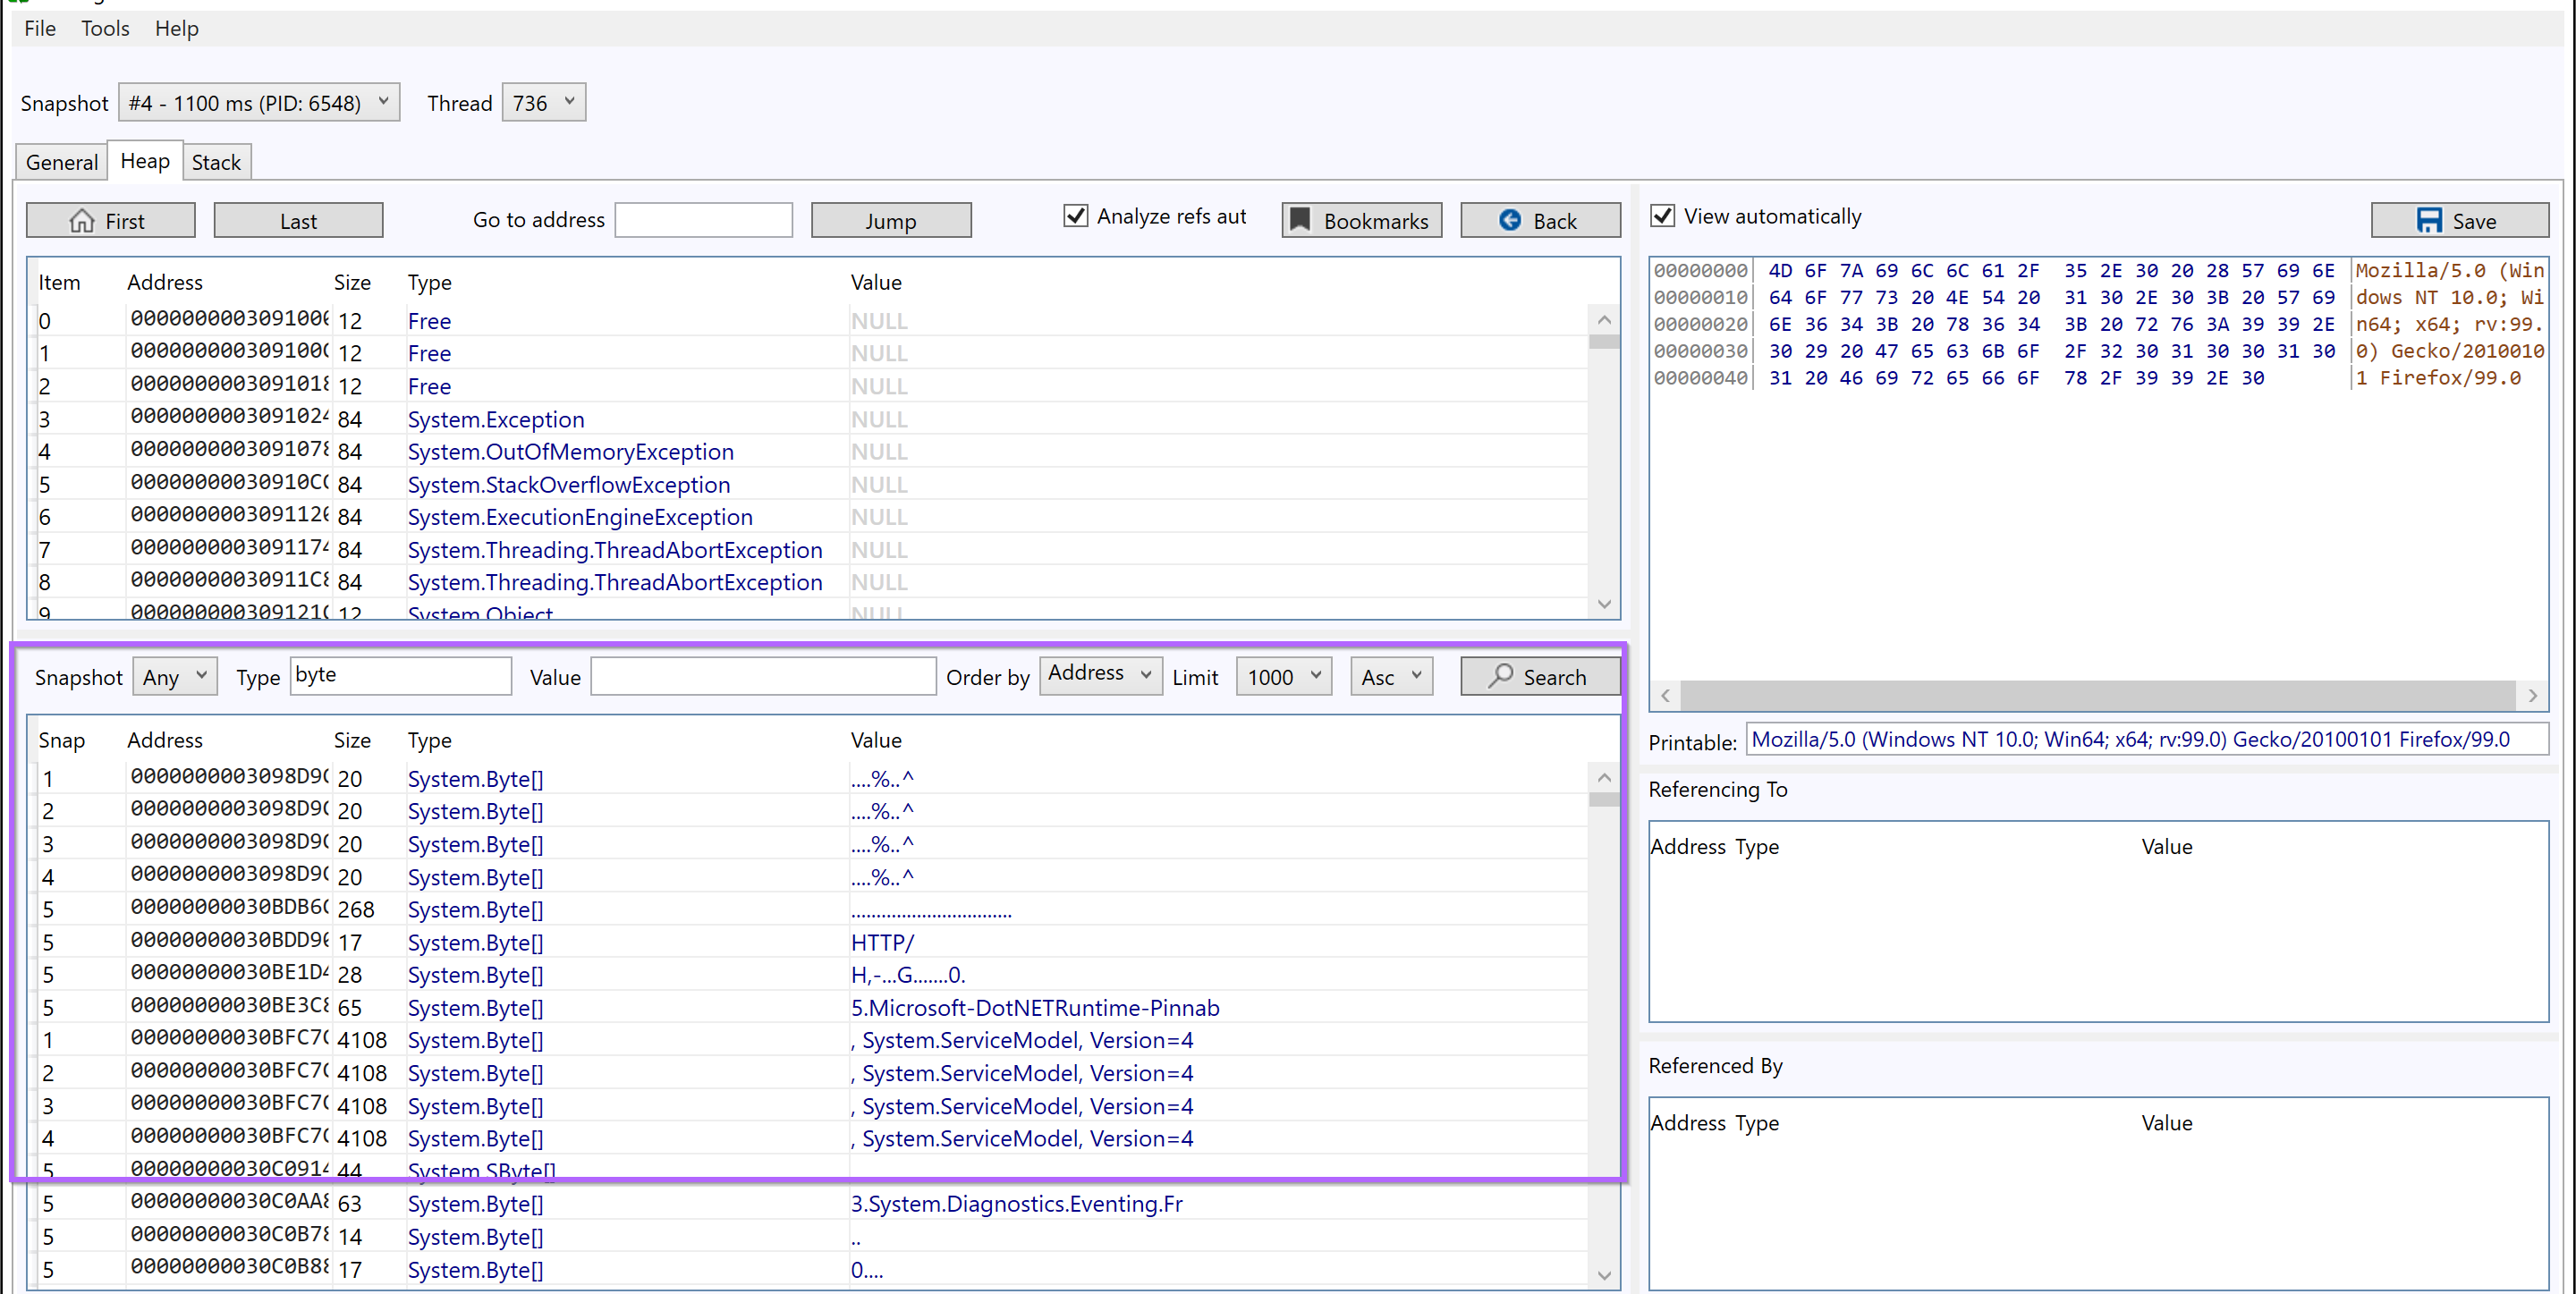
I recommend the following options as a starting point.
- Snapshot = Any - Search all available snapshots
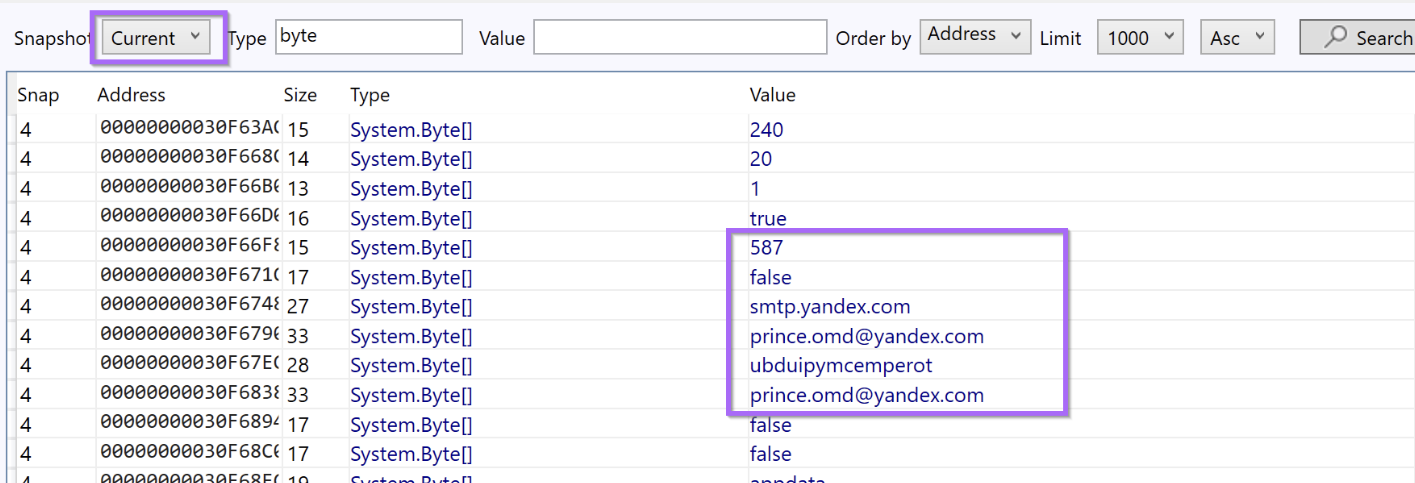
- Type = Byte or String - Show only bytes or strings
- Value = Blank - Add additional filters later.
- Order By = Address - This Groups similar content together (Change to size when looking for embedded payloads)
- Limit = 1000 (or infinite) - Display as much data as possible
- Order = Asc - Start from the "beginning" of the file. (Setto Desc if hunting for large content)
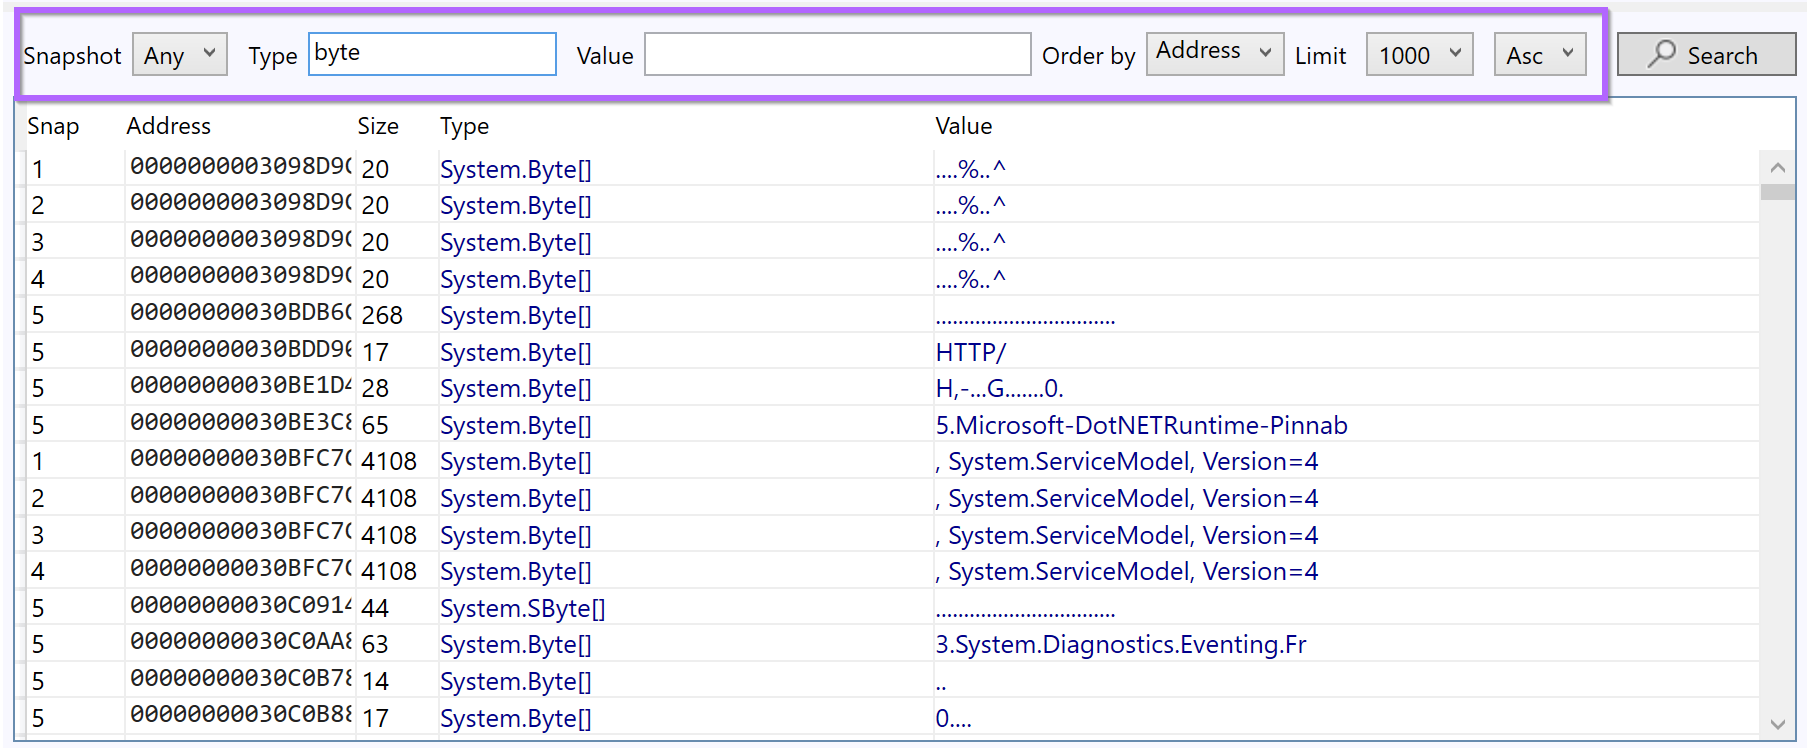
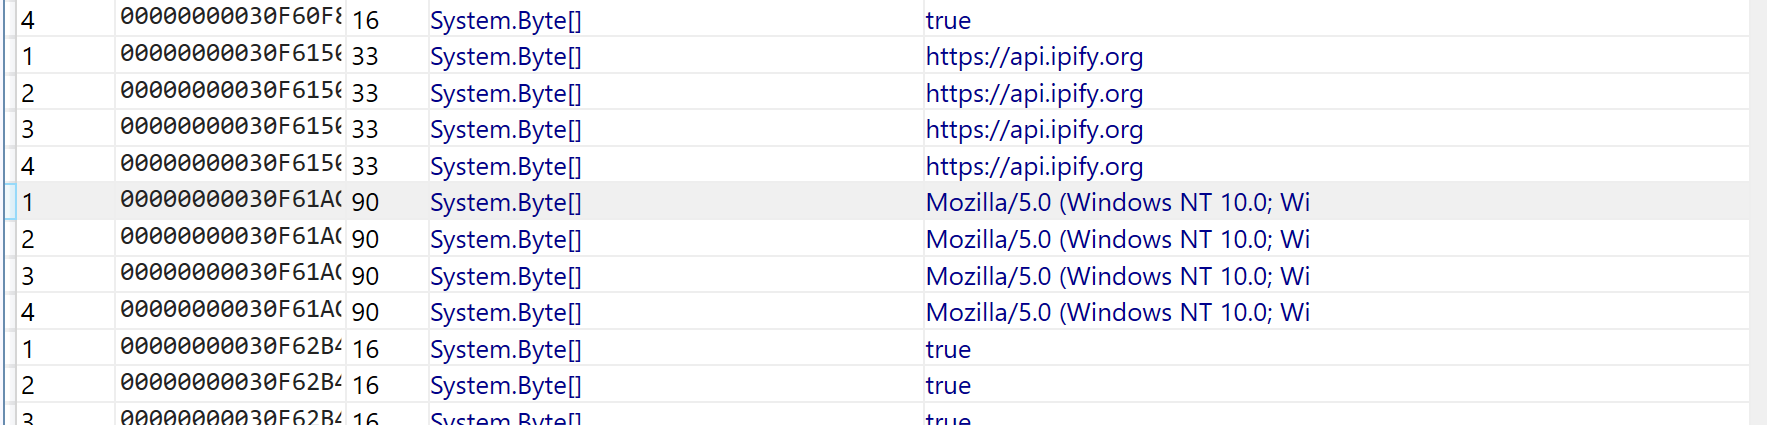
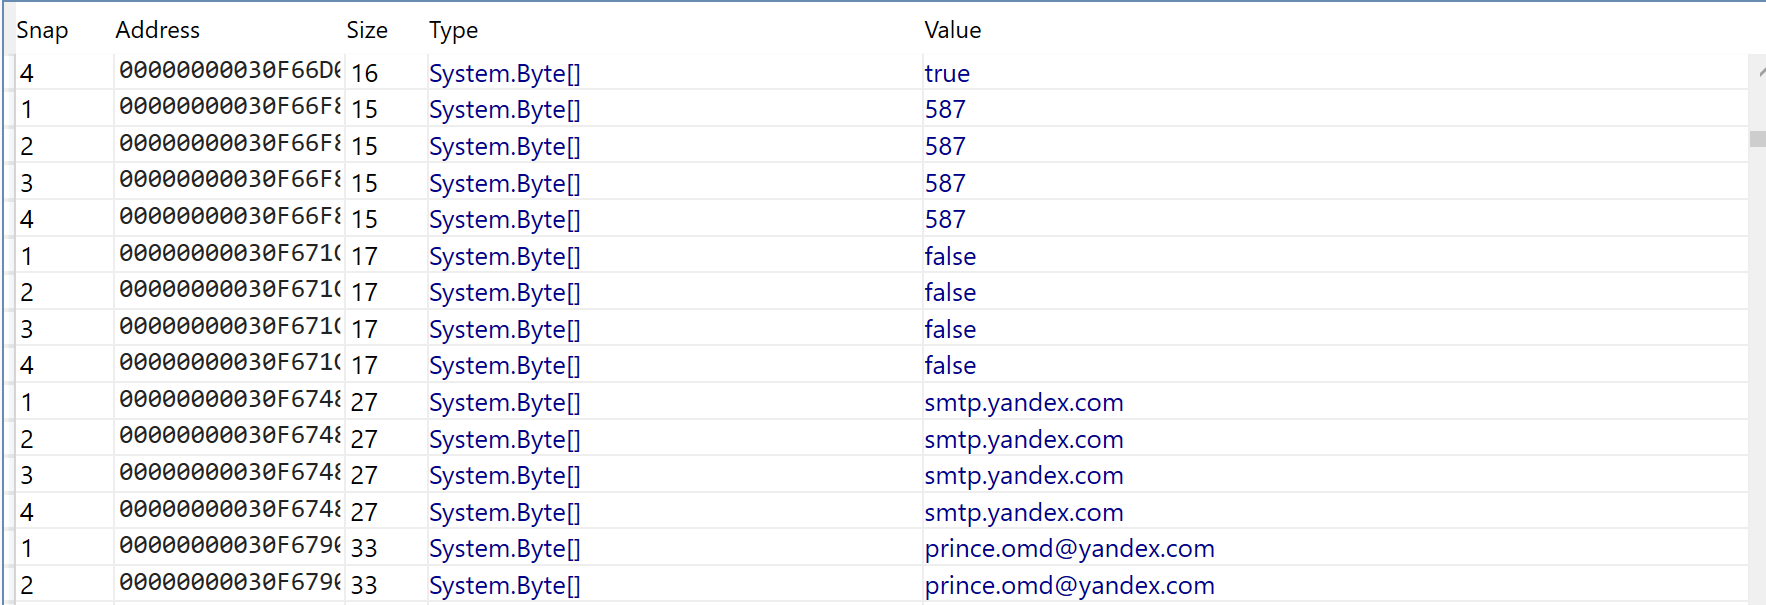
The initial results are fairly benign, and there are lots of duplicates.
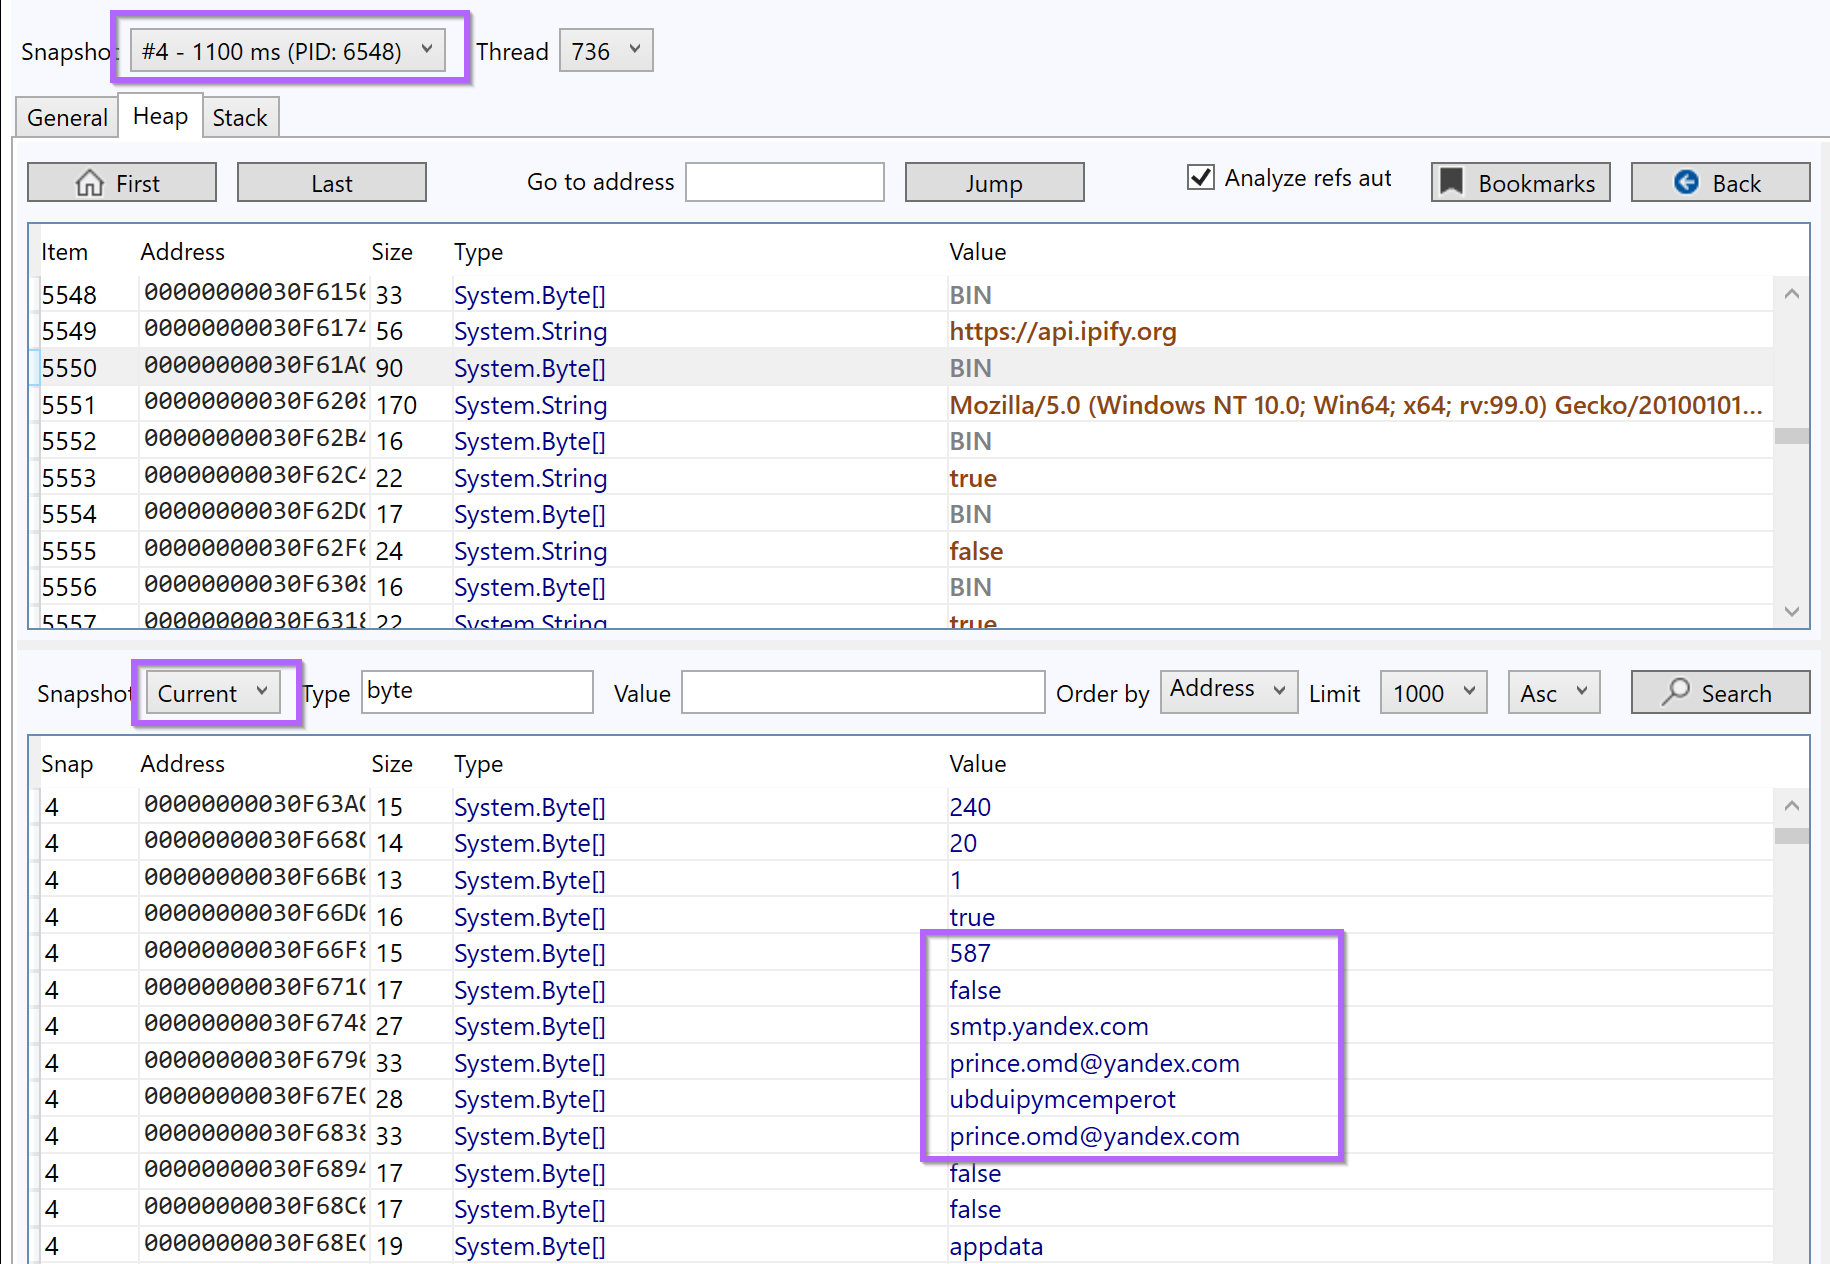
But there is an interesting User Agent Header and reference to apify.org.
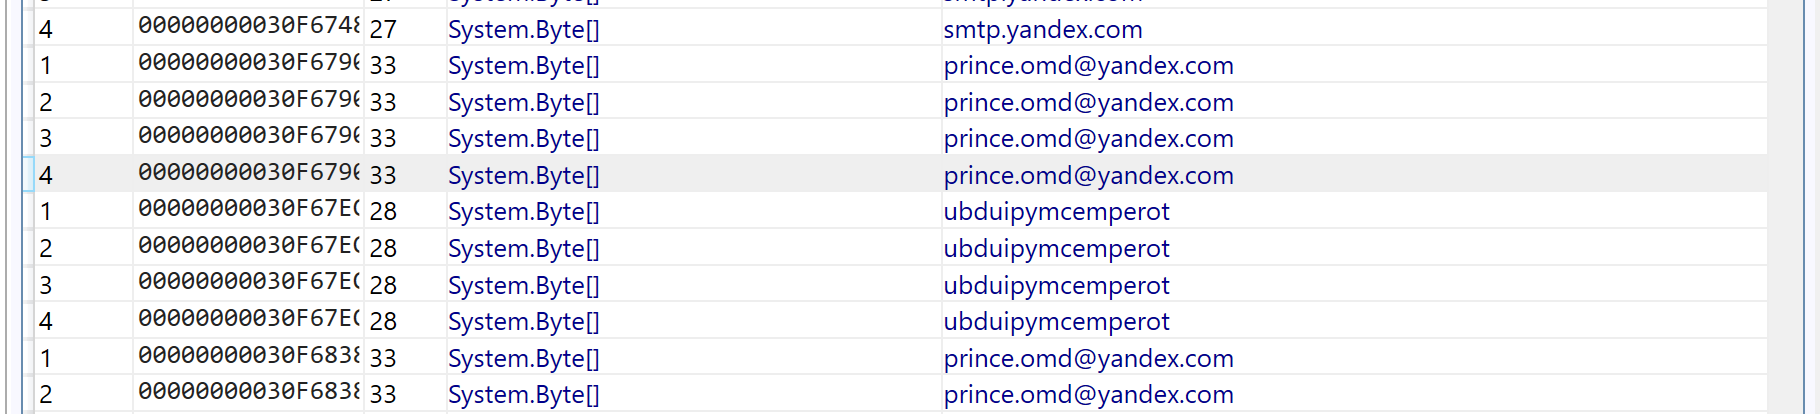
and then a pretty interesting reference to a yandex email address. This is something pretty unique and specific and worth googling.
Identification of AgentTesla
Googling the email address contained in the dump - numerous references to Malware are immediately shown.
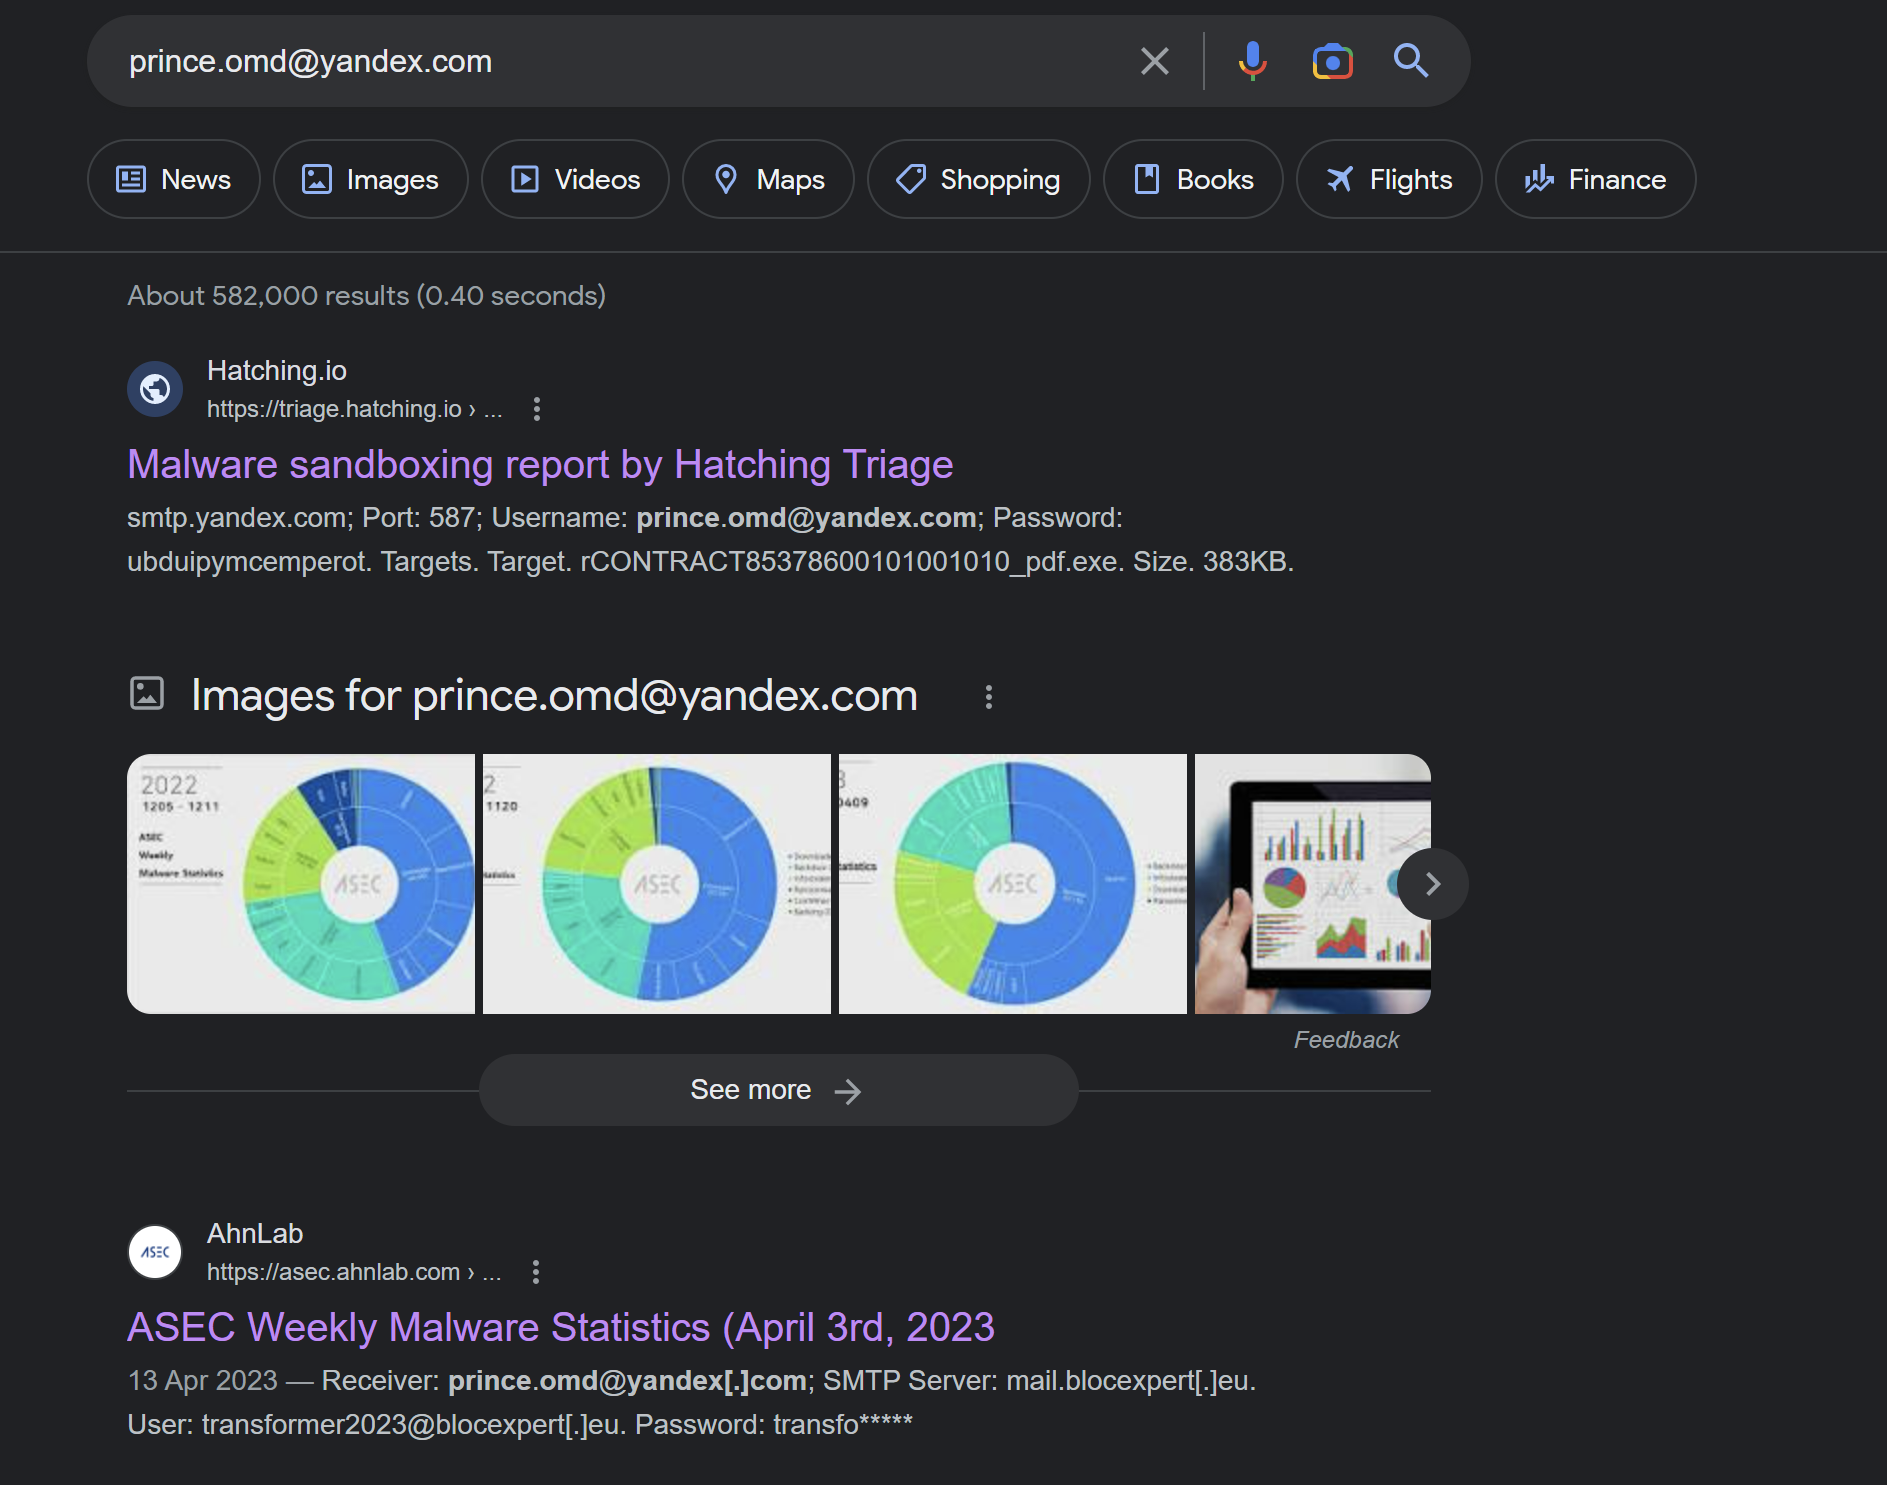
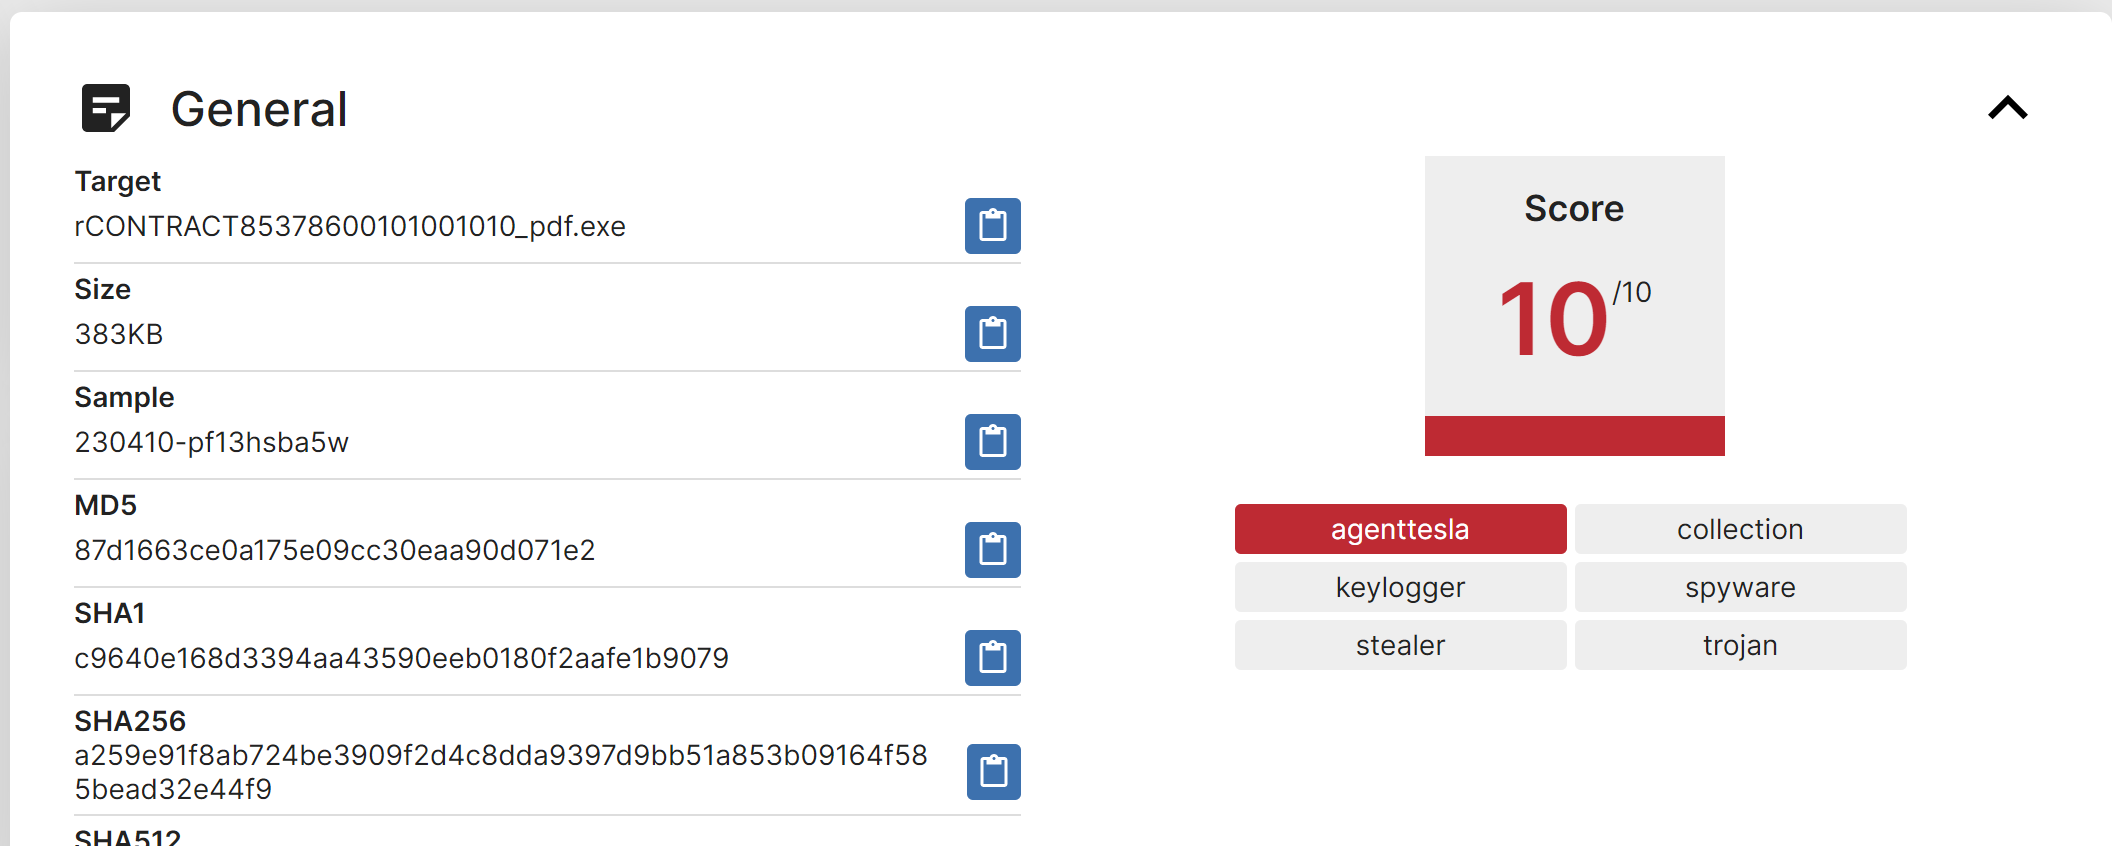
The first link is a triage report for AgentTesla. In an IR situation - this could be a good hint as to the malware family involved.
The Triage report contains an extracted malware config - with values very similar to what was found in Garbageman.
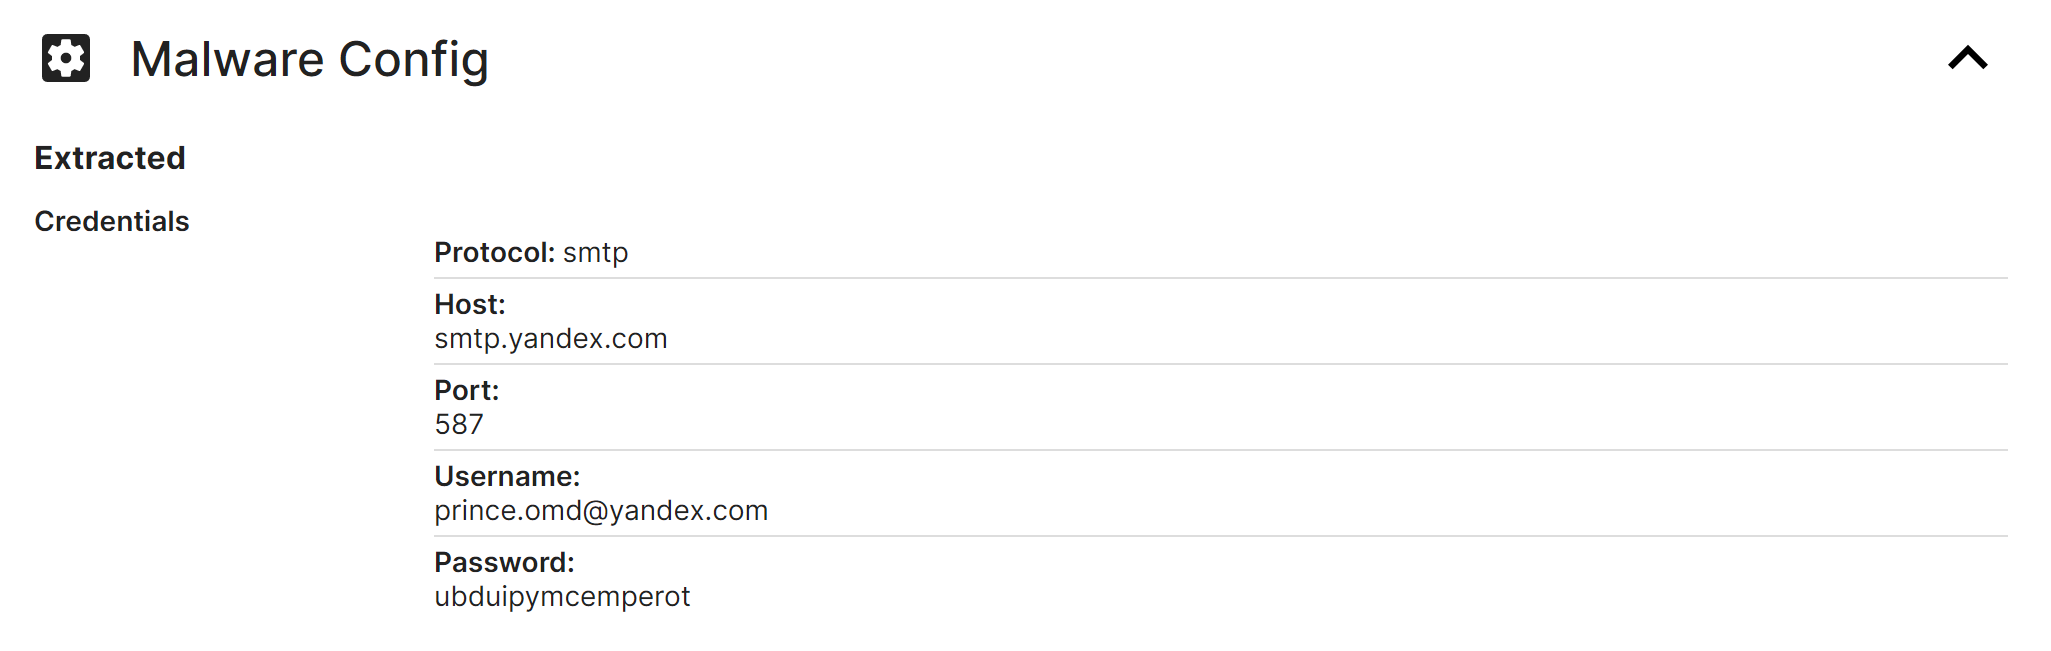
(The Malware also contains references to SMTP and port 587)
At this point some interesting information had been found, and it is ideal to try and hone in and establish more context.
To simplify the output and reduce duplicates. The search can be reduced to a single snapshot. (Any snapshot containing useful information can be used, and you should experiment with multiple snapshots)
Snapshot 4 was used for this case.
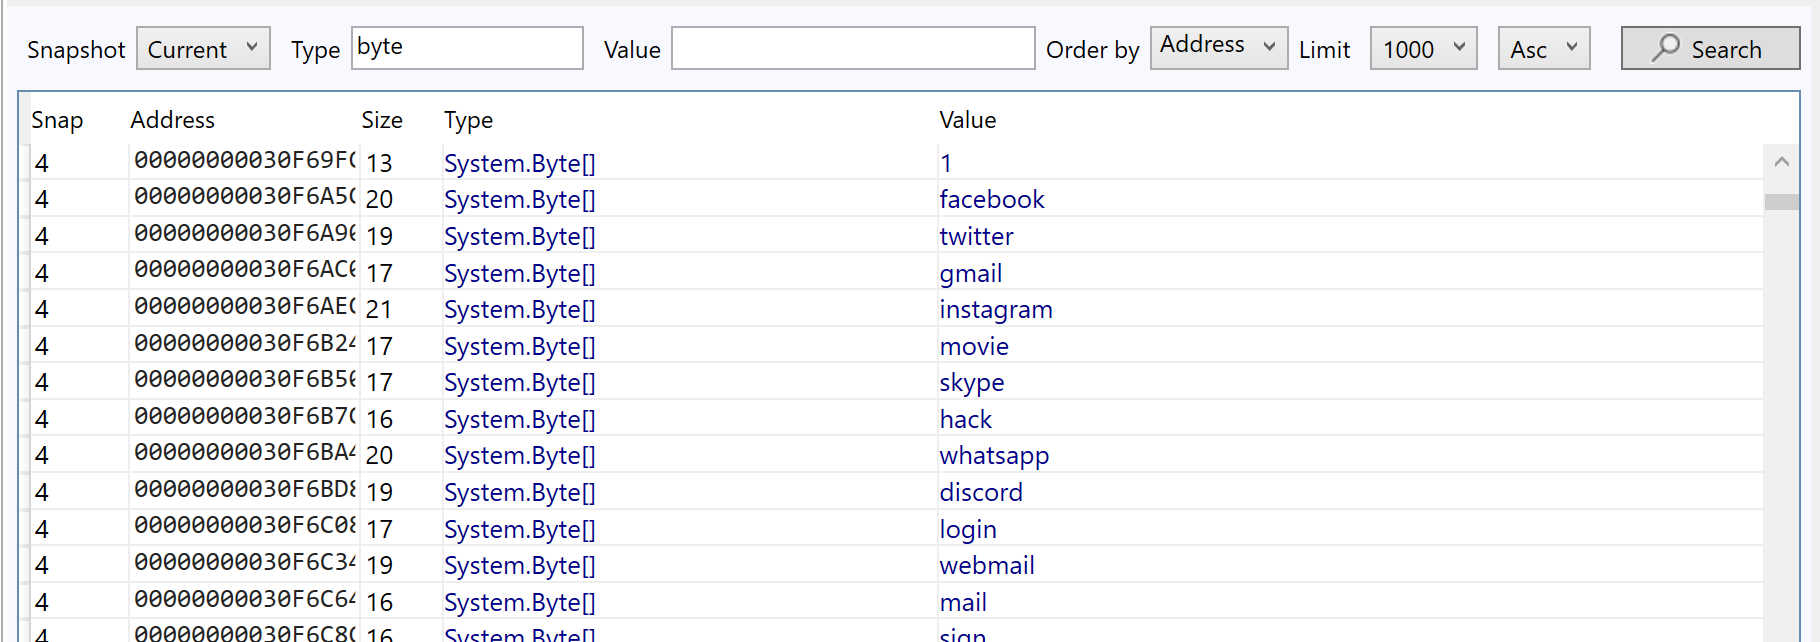
With duplicates removed - there are references to Discord, Webmail, Facebook, and Twitter.
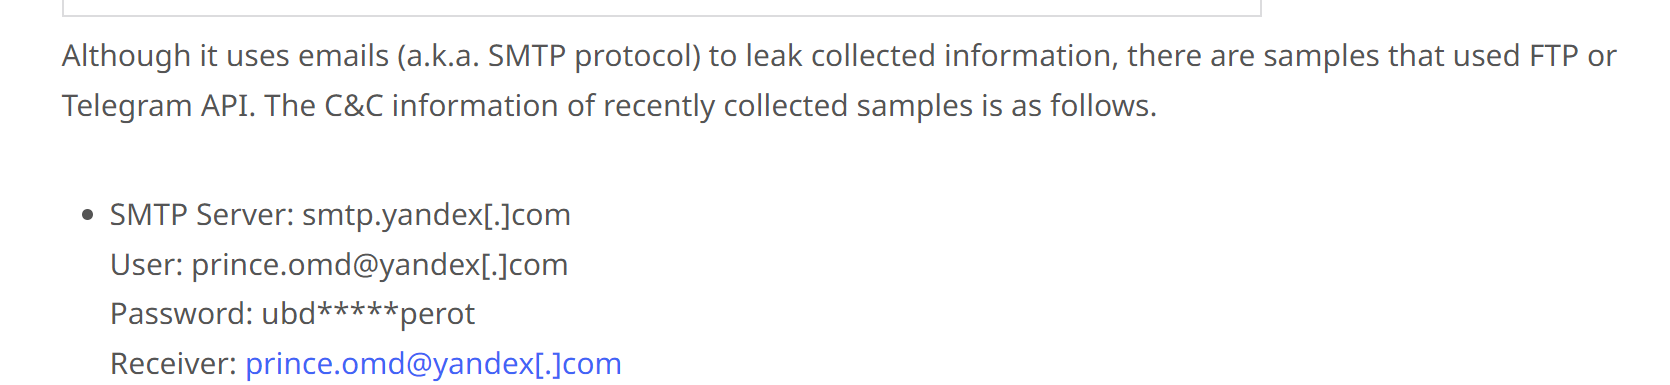
Reviewing the second result from the previous Google search (Ahnsec Labs) - There is a suggestion that AgentTesla uses SMTP as a means of exfiltration and command and control.
This suggests that the discovered email address is the C2 of the file. The blog also suggests that the value ubd* found alongside the email address, is actually the password to the smtp server.
At this point in the analysis - I would have strong confidence that the sample was AgentTesla.
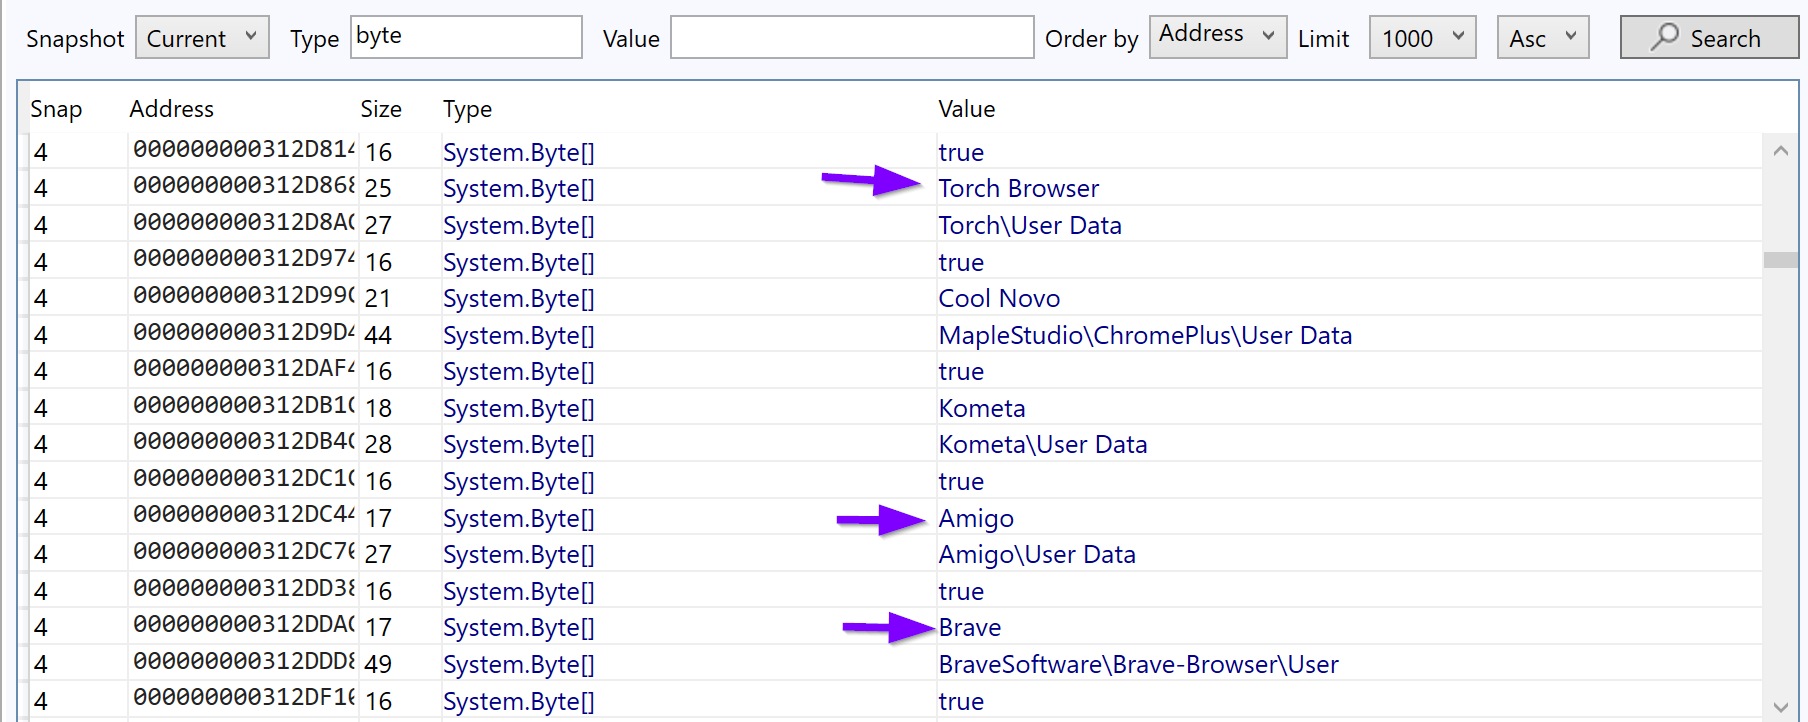
FoAnalysisonal confirmation. I scrolled down until more interesting, unique, and attack-related strings could be found.
This revealed some strings related to targeted applications.
A quick Google search reveals numerous results (Including Splunk) for Agent Tesla malware.
intext:"iridium browser" intext:amigo intext:brave intext:torch malware

At this point - I was happy to consider the Malware as AgentTesla. And the C2 information to be successfully discovered.
Conclusion
This post concludes. I intentionally tried to cover as many topics as possible to demonstrate some useful analysis techniques. Hopefully, you've learned something new.
If you enjoy these posts and want to support the creation of more. Consider signing up for the site.
Resources
- Hardware Breakpoints - https://reverseengineering.stackexchange.com/questions/28045/what-is-hardware-breakpoint-and-when-we-need-to-use-it
- x64dbg Documentation -String Formatting - https://help.x64dbg.com/en/latest/introduction/Formatting.html
- GarbageMan - Download - https://github.com/WithSecureLabs/GarbageMan/
- GarbageMan - Website - https://labs.withsecure.com/tools/garbageman
- Triage Report - Agent Tesla - https://triage.hatching.io/230410-pf13hsba5w
- Ahnsec Labs - Agent Tesla - https://asec.ahnlab.com/en/51274/