Reverse Engineering
In this post, we will investigate a Vidar Malware sample containing suspicious encrypted strings. We will use Ghidra cross references to analyse the strings and identify the location where they are used.
Using this we will locate a string decryption function, and utilise a debugger to intercept input and output to obtain decrypted strings.
We will then semi-automate the process, obtaining a full list of decoded strings that can be used to fix the previously obfuscated Ghidra database.
Summary
During basic analysis of a Vidar file, we can see a large number of base64 strings. These strings are not able to be decoded using base64 alone as there is additional encryption. By using Ghidra String References we can where the base64 is used, and hence locate the function responsible for decoding.
With a decoding function found, it is trival to find the "start" and "end" of the decryption process. Using this knowledge we can load the file into a debugger and set breakpoints on the beginning and end of the decoding function. This enables us to view the input (encoded string) and output (decoded string) without needing to reverse engineer the decryption process.
By further adding a simple log command into the debugger (x32dbg), we can tell x32dbg to print all values at the start and end of the decryption function. This is a means of automation that is simple to implement without coding knowledge.
Once the encrypted/decrypted contents have been obtained, we can use this to manually edit the original Ghidra file and gain a deeper understanding of the malware's hidden functionality.
Obtaining the File
The file can be downloaded here from Malware Bazaar.
SHA256: 0823253d24e0958fa20c6e0c4b6b24028a3743c5c895c577421bdde22c585f9f
Initial Analysis and Identifying Strings
We can download the file from Malware Bazaar using the link above, we can then unzip the file using the password infected.
We like to create a copy of the origininal file with a shorter and more useful file name. In this case we have chosen vidar.bin . 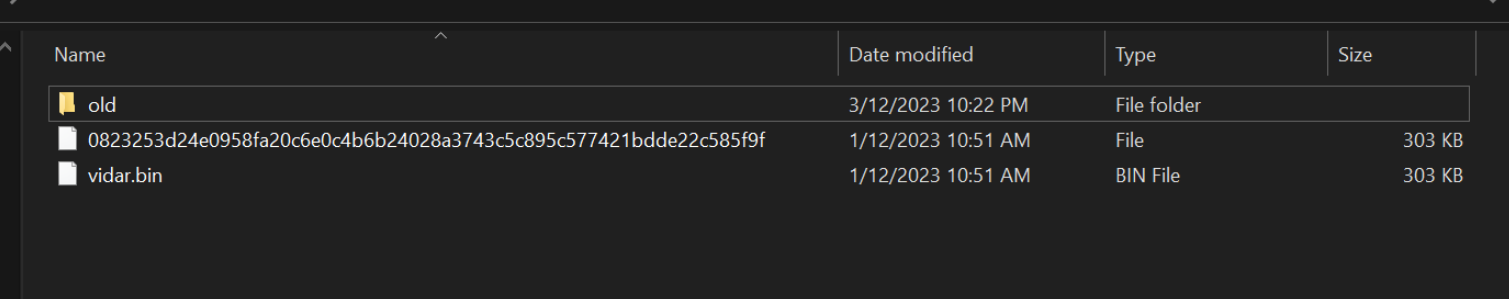
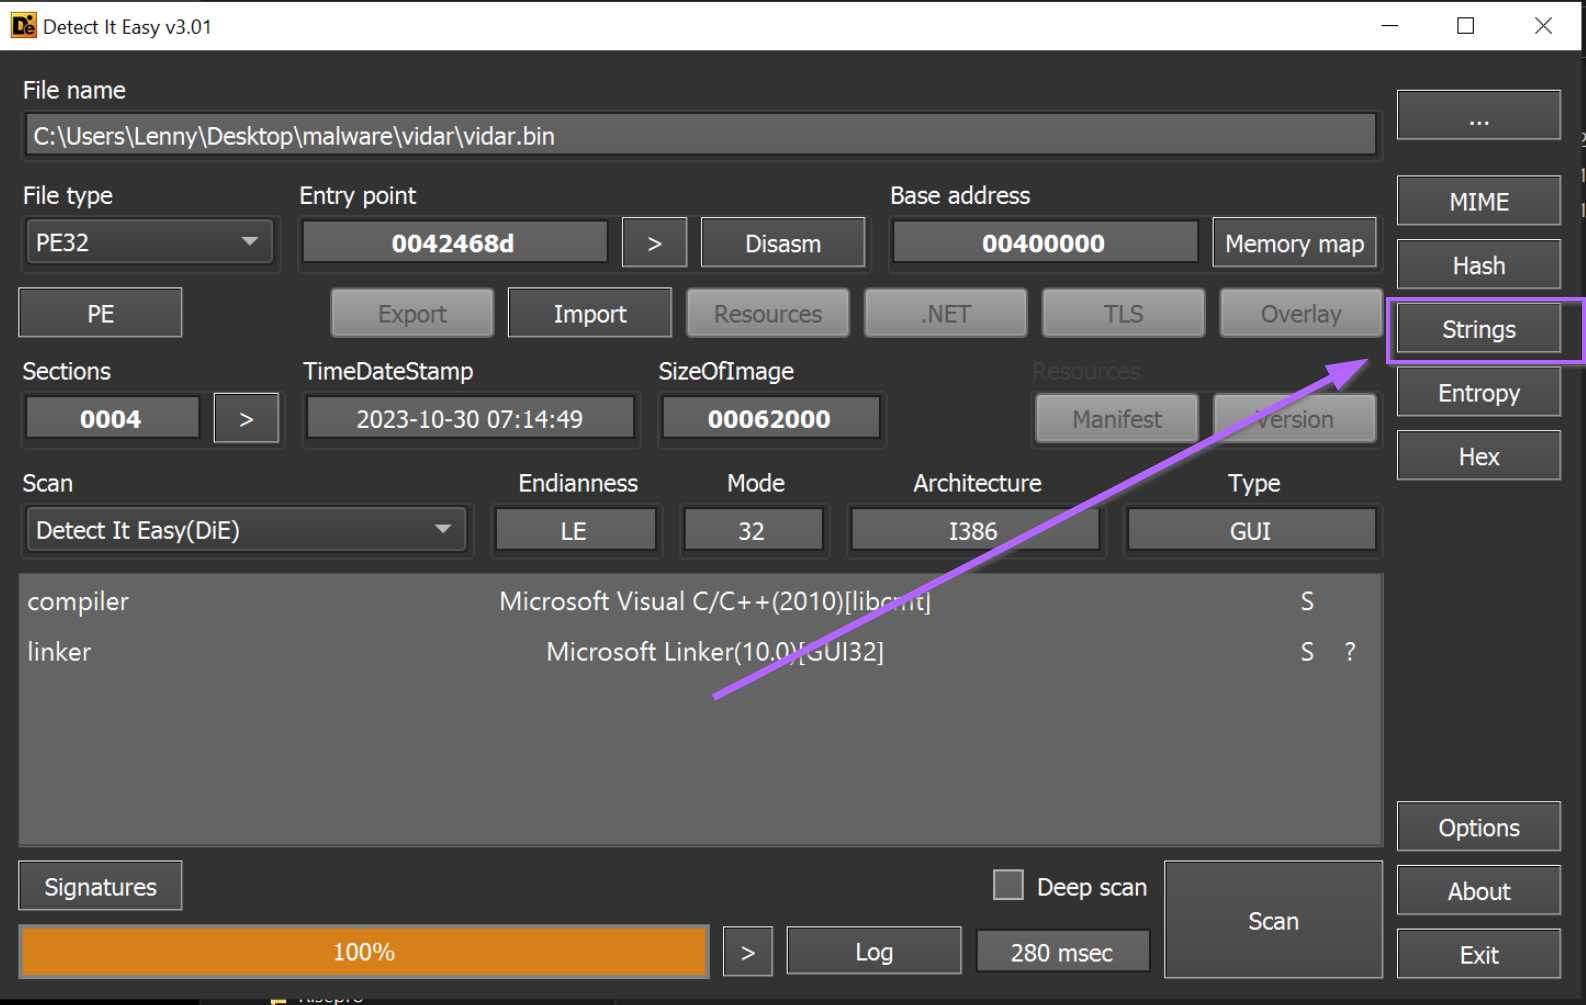
We can perform some basic initial analysis using Detect-it-easy. A typical workflow in detect-it-easy is to look for strings contained within the file.
If we select the "strings" option, we can see a large number of base64-like strings.
(You could also use PeStudio or any other tooling that can identify strings)
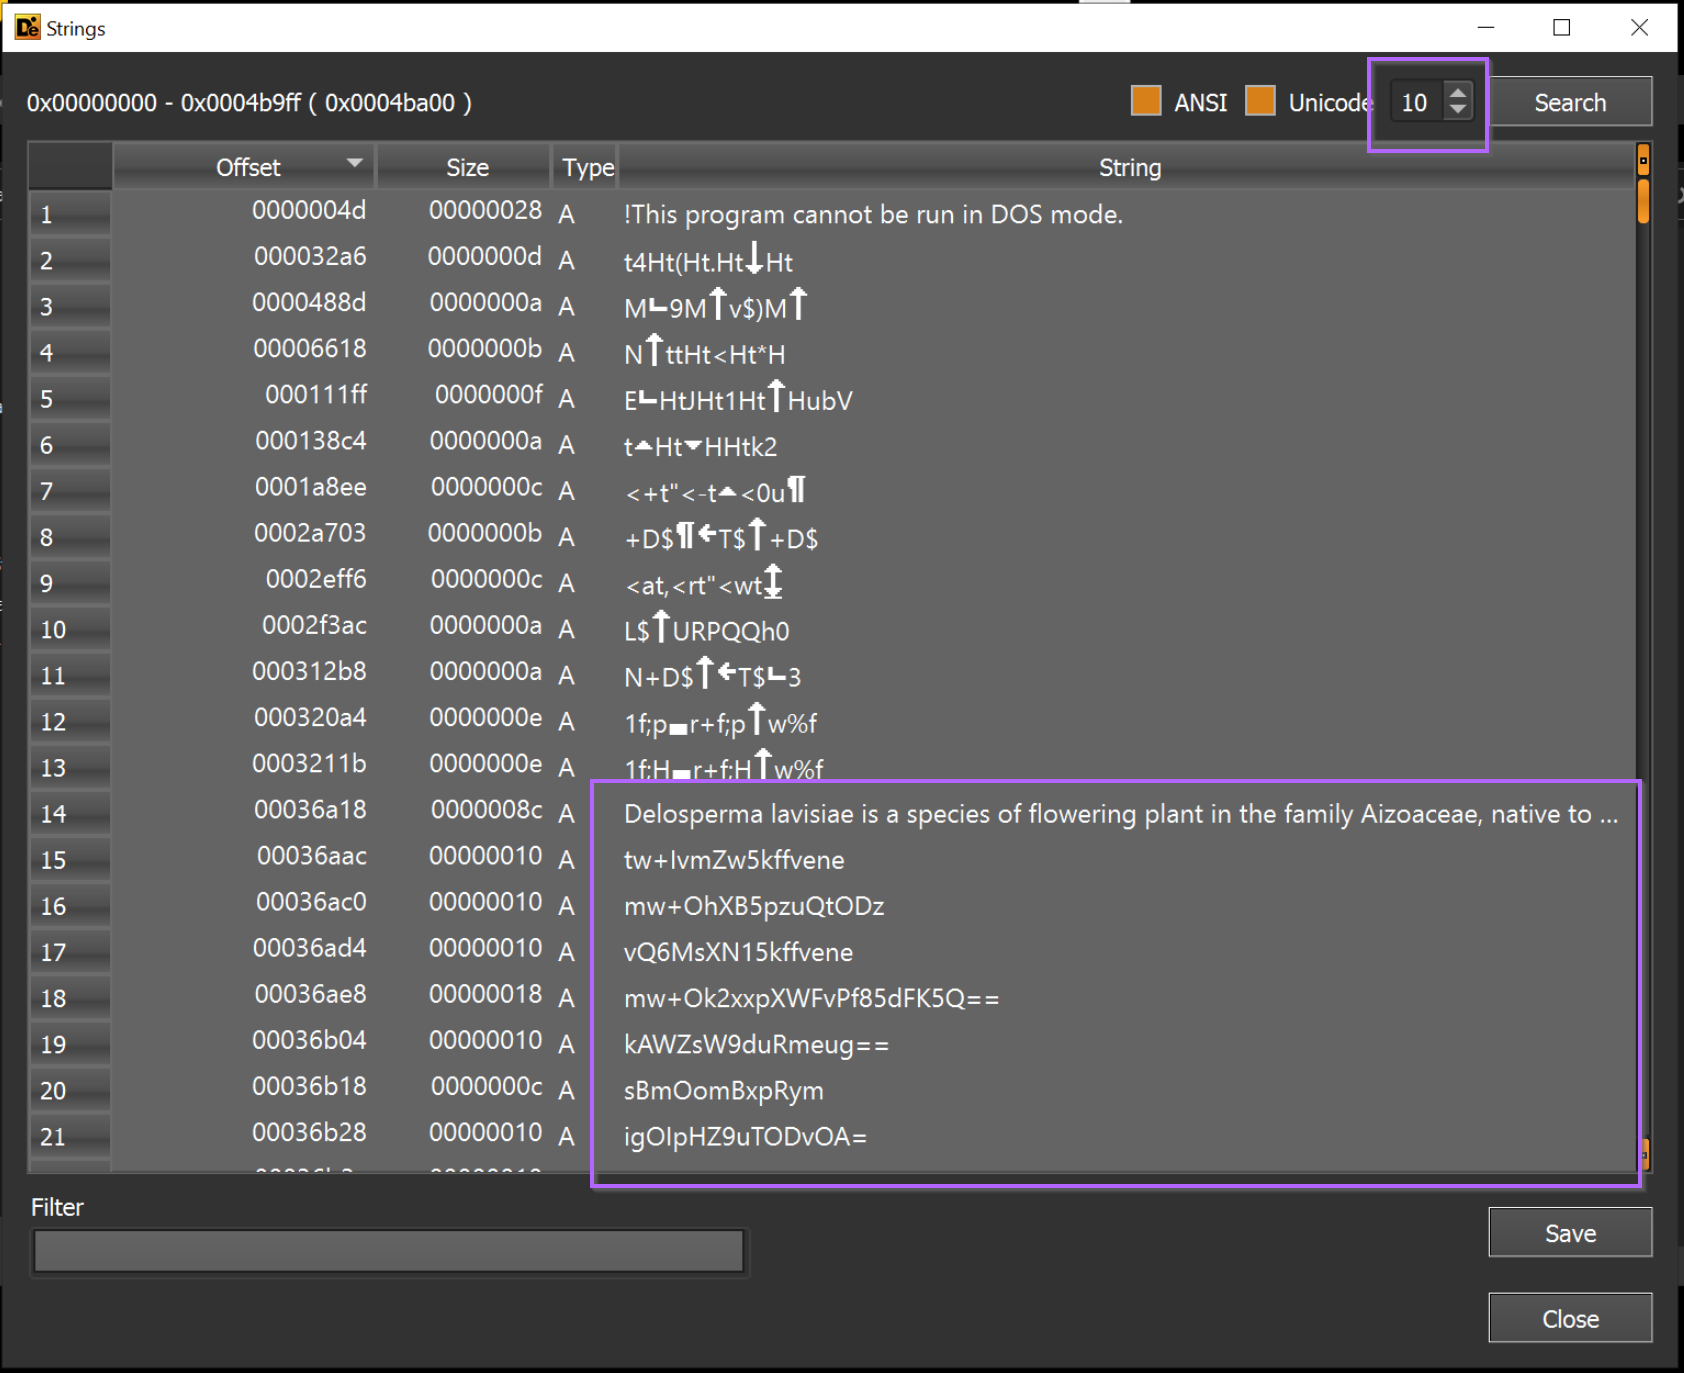
The default minimum string length is 5, which results in a lot of junk strings. By increasing this to 10, we can more easily identify strings of interest.
In the screenshot below we can see a group of base64-like strings. In many cases, encoded strings like these are used to obfuscate functionality and Command-and-Control (C2) servers.
Hence, they are a useful indicator to hone in on with tooling like Ghidra.
Now we've identified some interesting strings within the file. We can go ahead and use Ghidra to analyse these further and attempt to establish some context as to how they are used.
Loading the File Into Ghidra
To analyse these strings further, we can go ahead and load the file into Ghidra.
This can be done by dragging the file into Ghidra, accepting all default options and allowing the Ghidra analysis to run for a few minutes.
We can then continue our analysis by locating the same strings we found during initial analysis. In this case we can start with the first base64 string of tw+lvmZw5kffvene
The below screenshots demonstrate how to perform a string search with Ghidra. Search -> For Strings
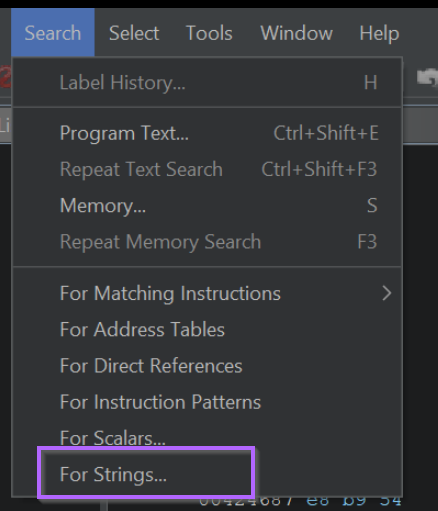
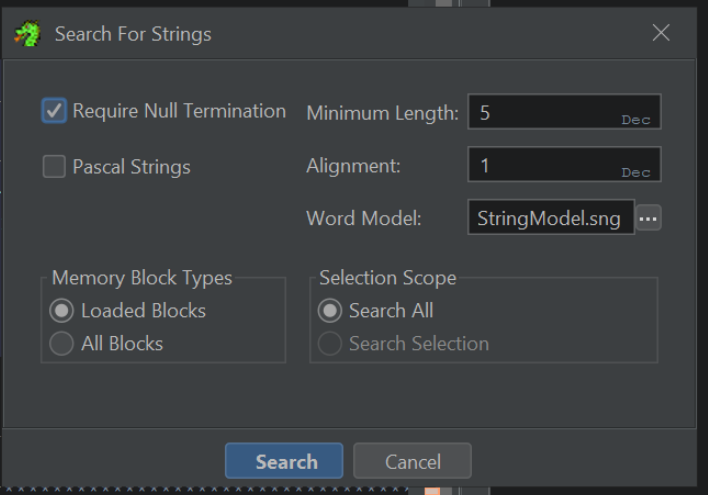
Ghidra will present a window like below, we can typically go ahead and accept the defaults.
Make sure thatSelection Scope -> Search Allis selected. Sometimes Ghidra changes toSelection Scope -> Search Selectionif you have something highlighted.
Once we've accepted the default search options, we can filter on the beginning of our previous string tw+ to locate it.
This will reveal 3 strings starting with tw+
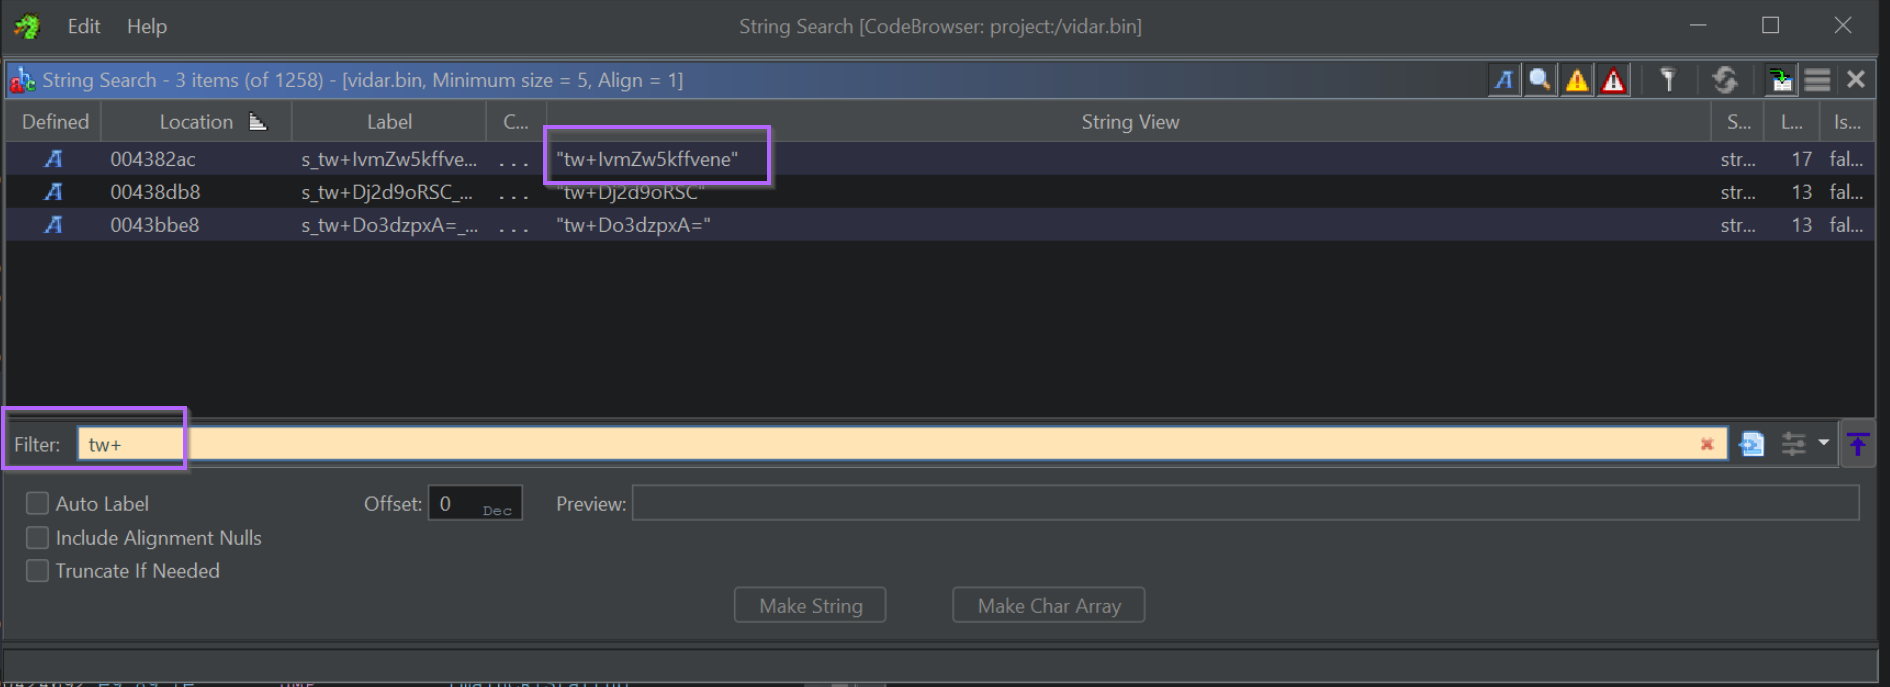
We can double click on any of the returned strings, which will take us to the location of the string within the file.
Ghidra will automatically recognise if the location storing the string has been used elsewhere in the file. This is known as a cross reference (xref) and is an extremely useful concept to become familiar with.
In this view, we can also see that there is one Cross Reference (XREF) available. This indicates that Ghidra has found one location where the string is used.
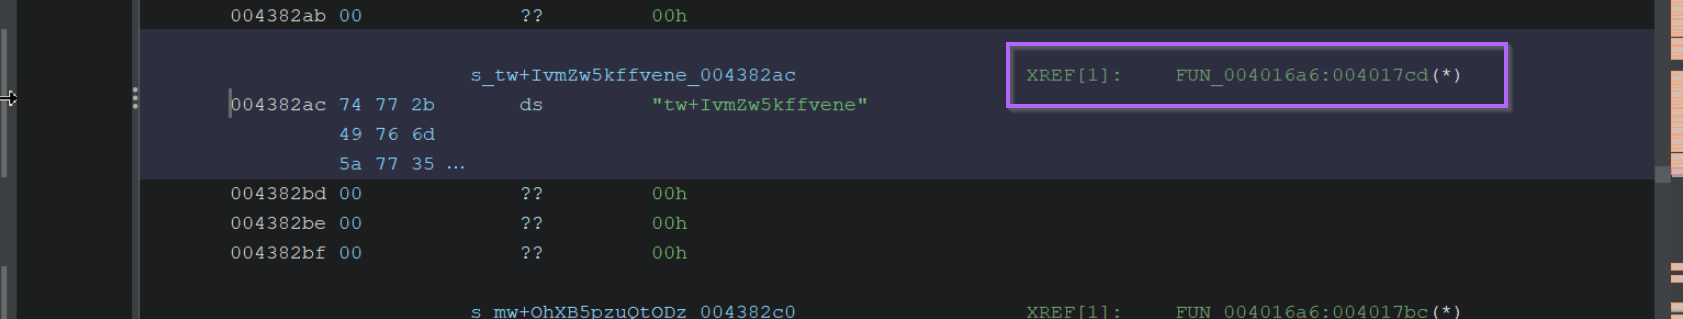
Double-clicking the xref value will show us where the string has been referenced.
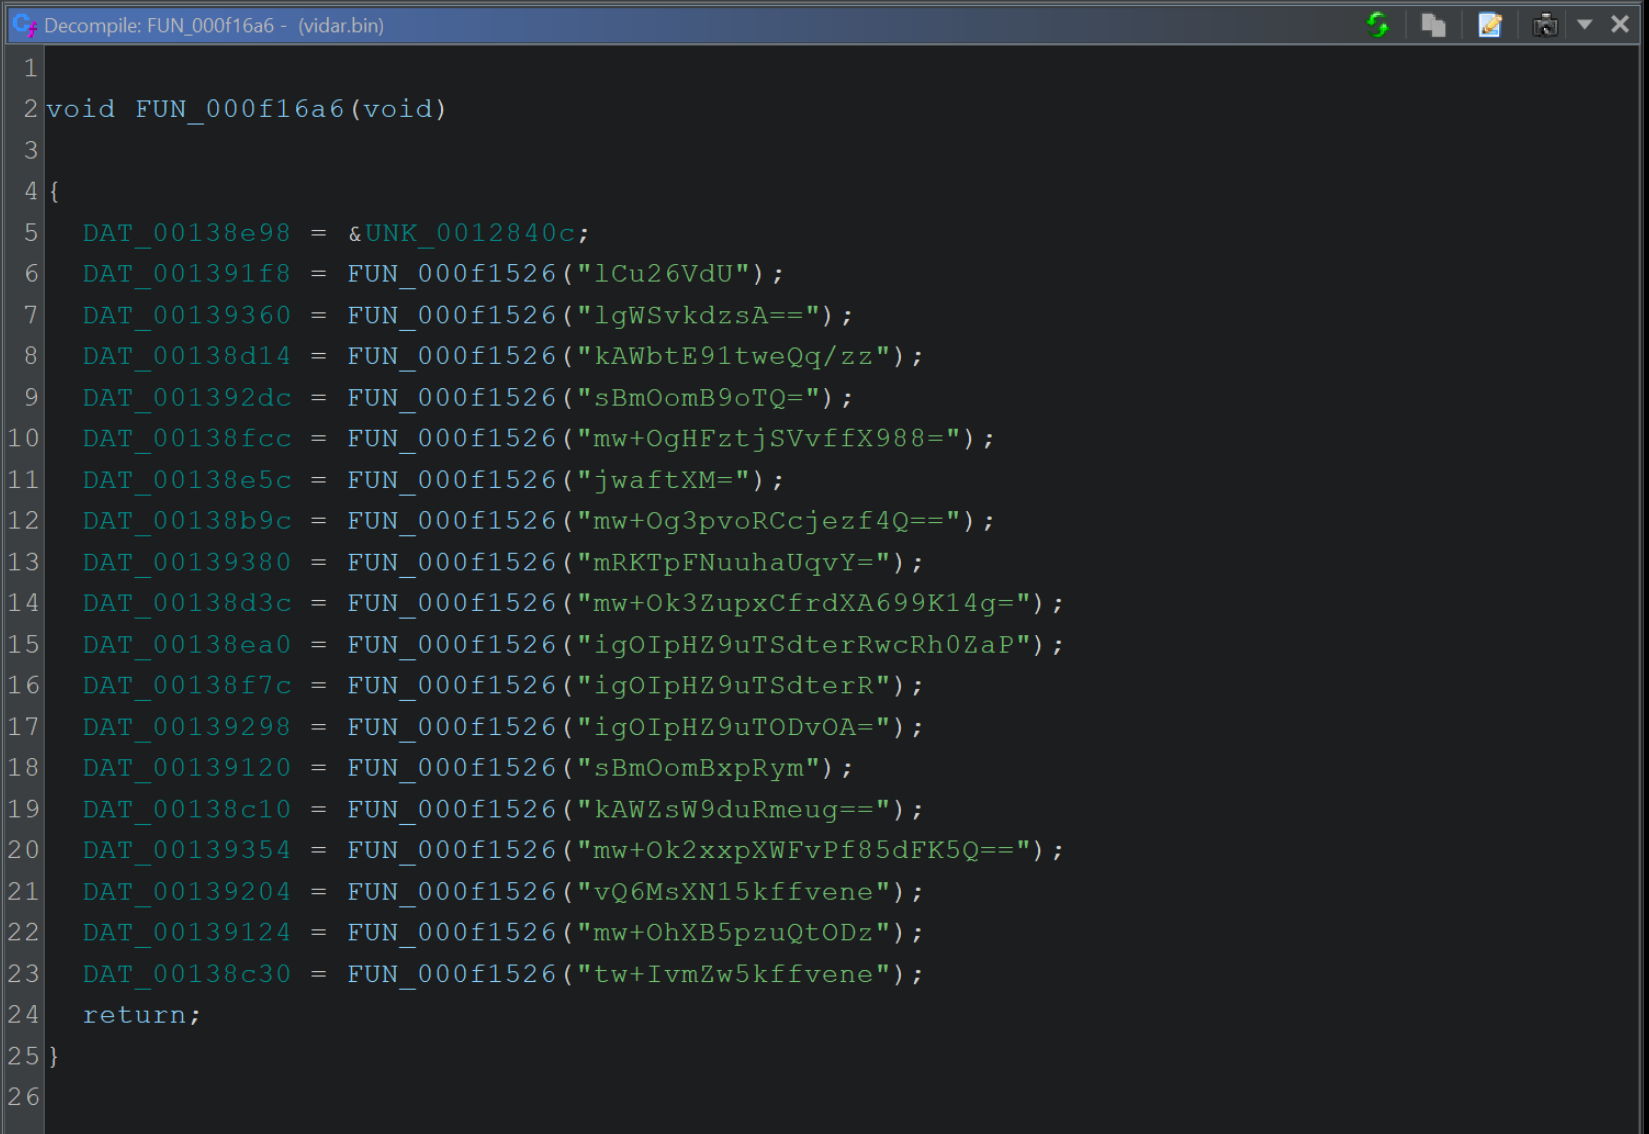
After double-clicking on the xref value, we can see the base64 string (as well as others) contained within the function FUN_004016a6.
We can also see each of these strings is passed to FUN_00401526. Since every string is going to the same function, it is very likely the one responsible for decryption.
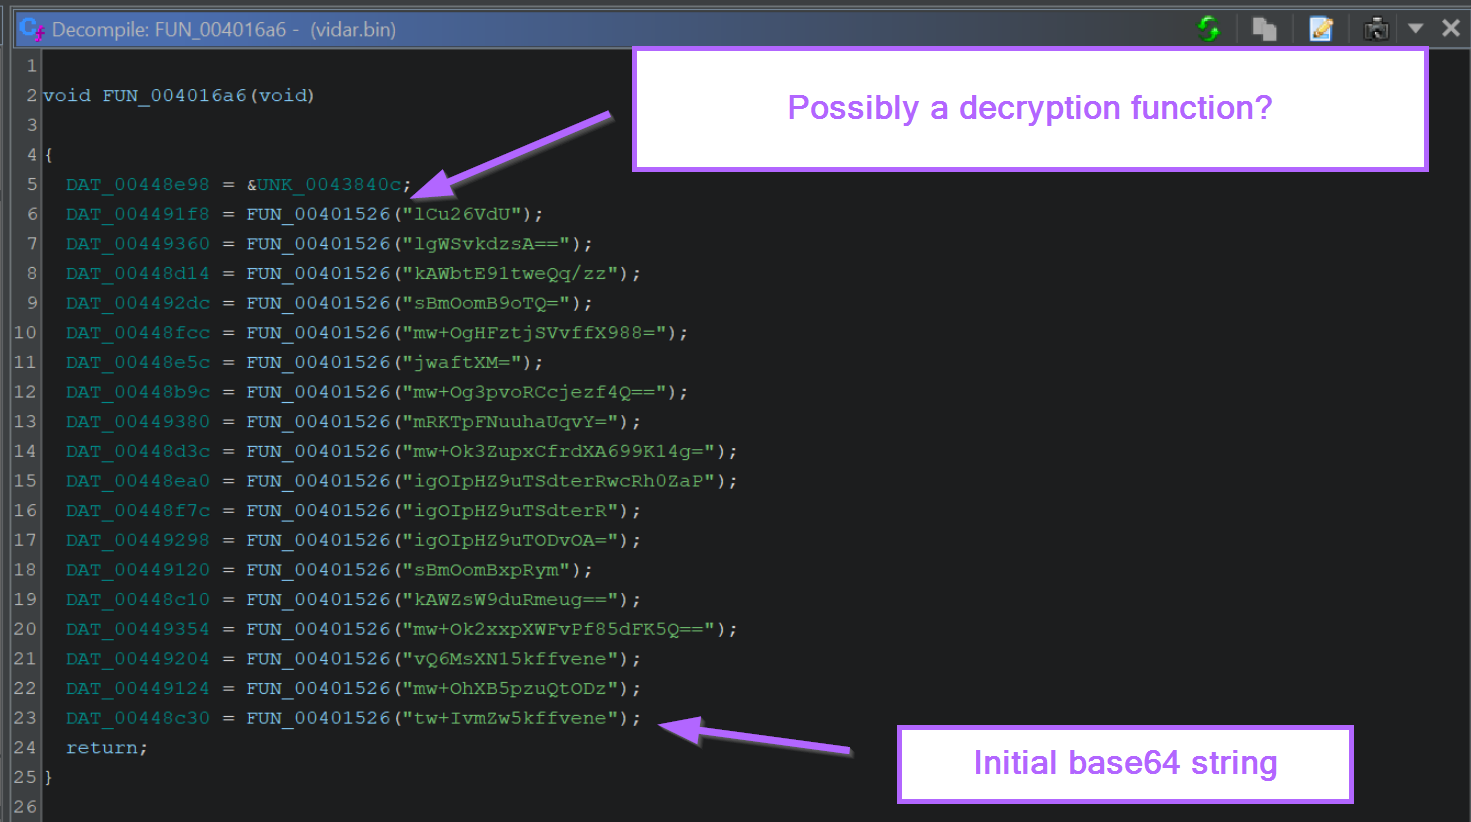
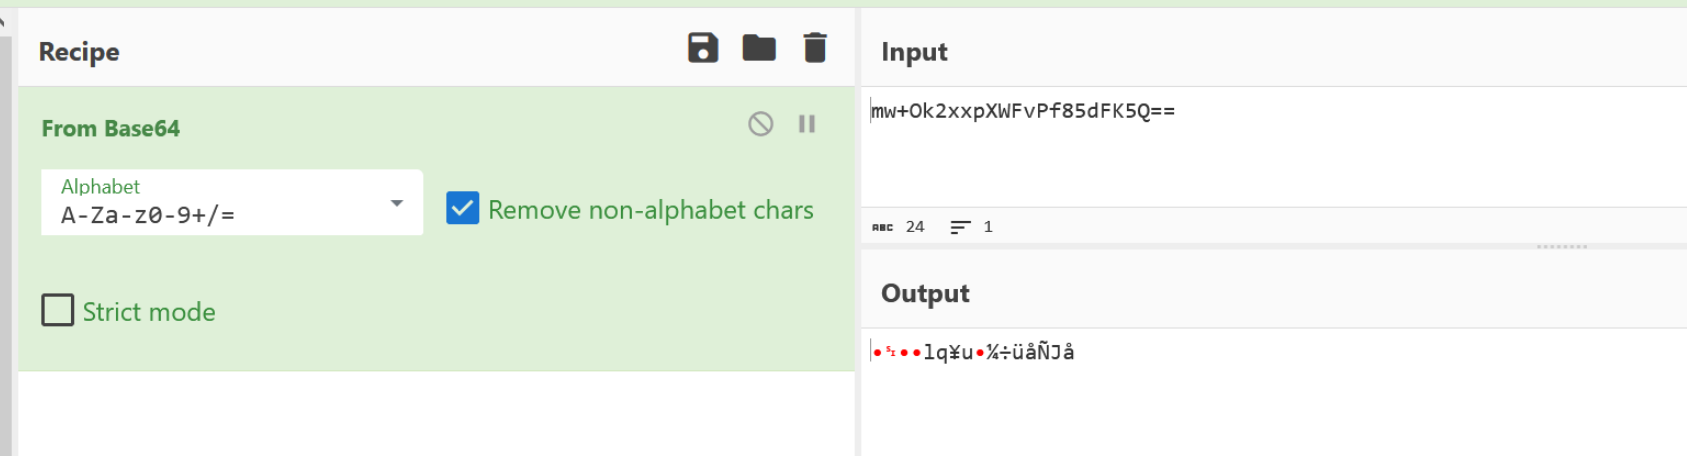
Side note - These strings undergo additional obfuscation as well as base64. We won't be able to decode them using base64 alone.
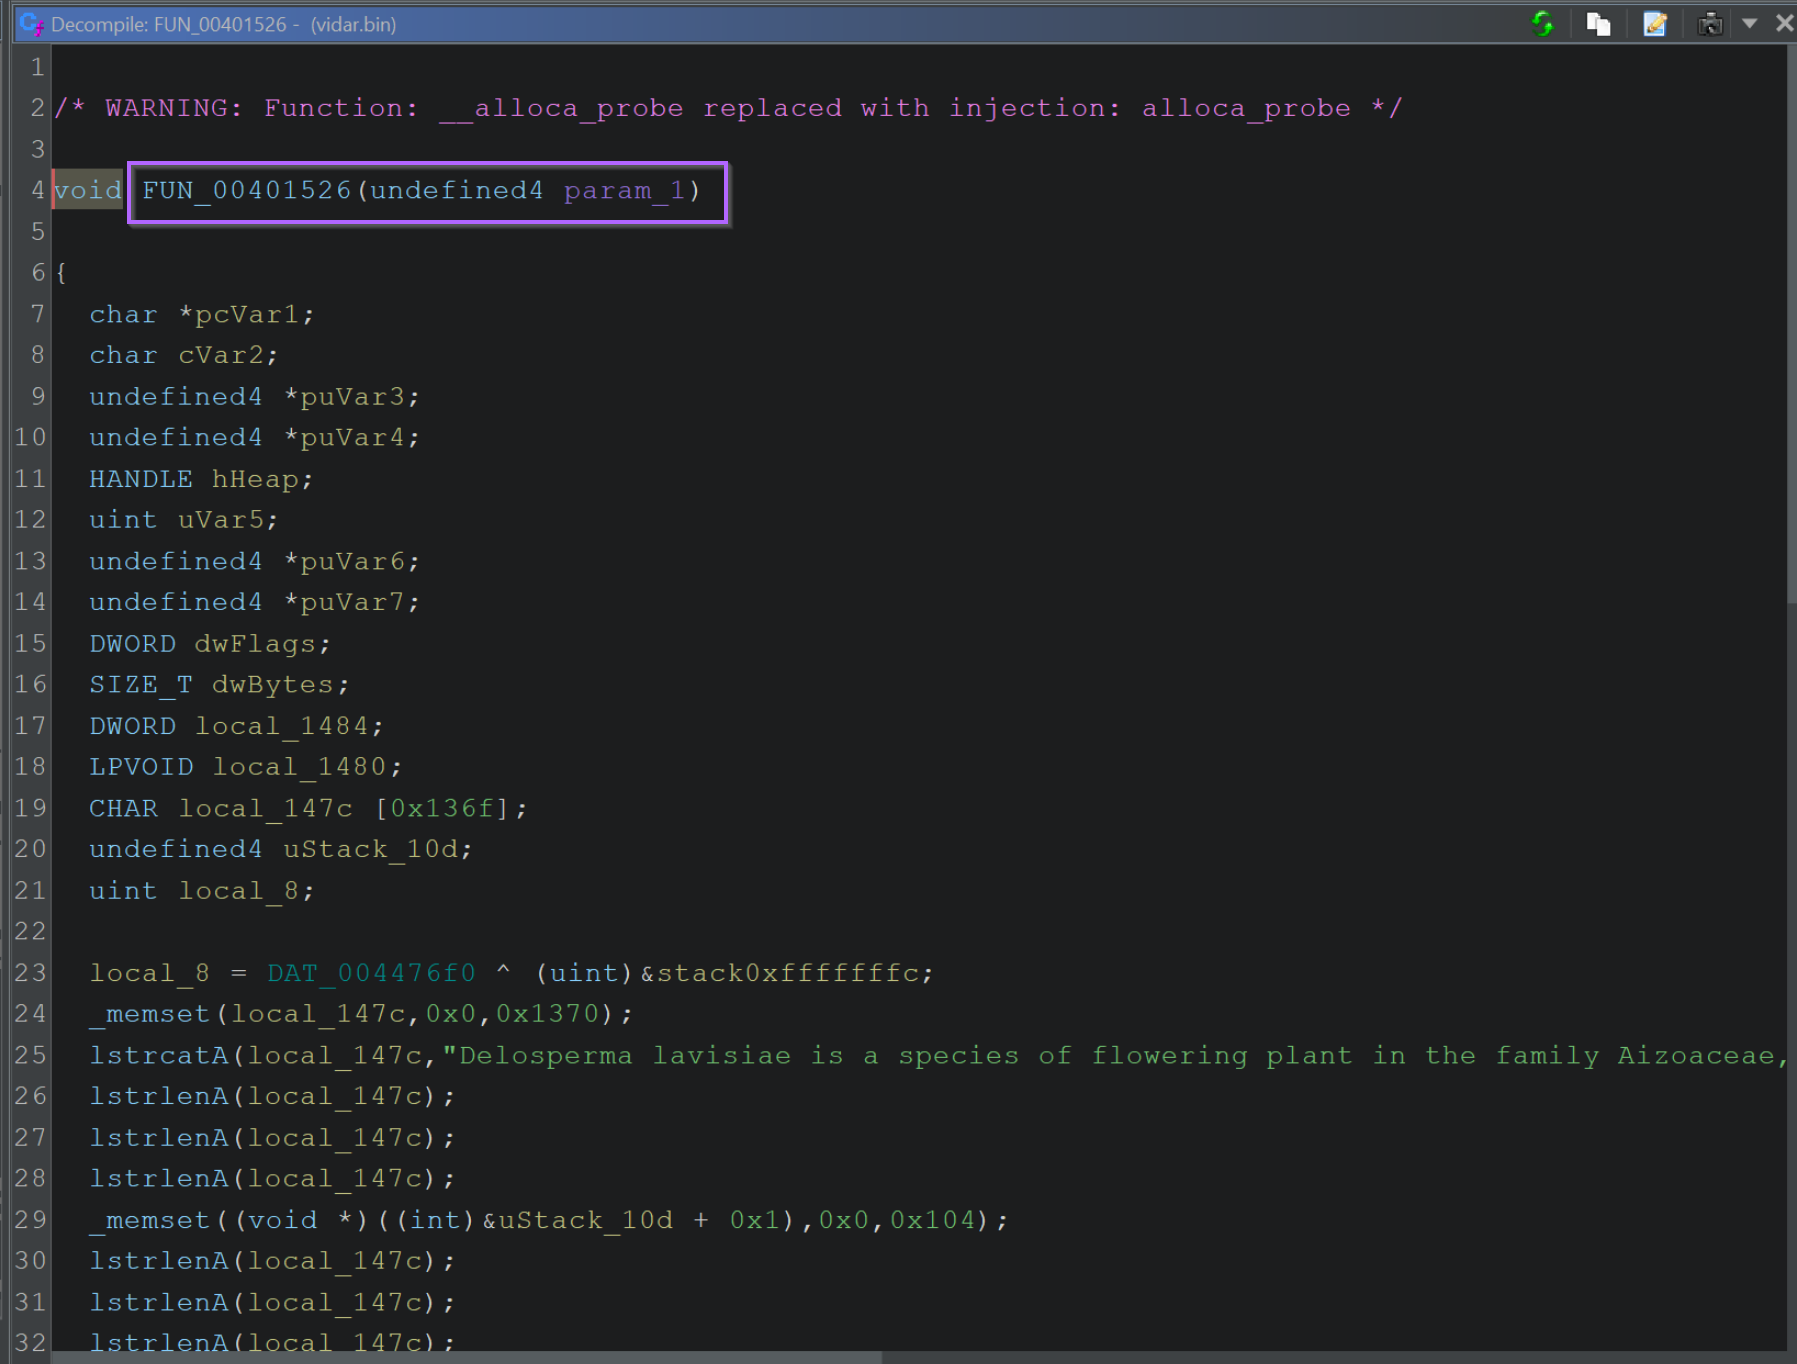
If we click on the FUN_00401526 function taking all the encoded strings, we can see that it's rather long, confusing and contains a lot of junk code.
Luckily, we don't need to analyse it in detail in order to decrypt the strings. Since we know the location of the function within the file, we can use a debugger to obtain the decrypted content for us.
The name of the function is the location within the file. This is all we need to be able to locate it within a debugger.
Eg for functionFUN_00401526, the location of the function will be00401526.
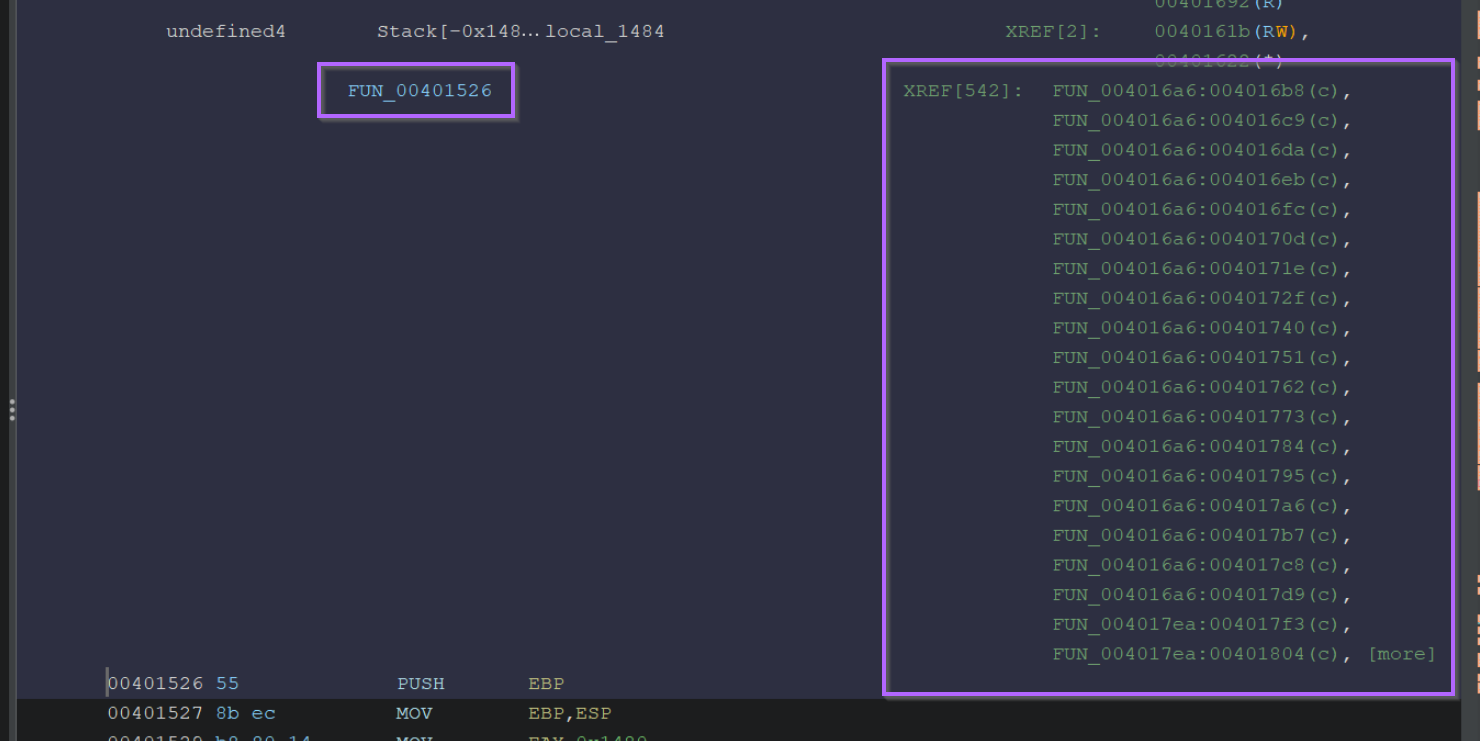
As a side note, if we look at the same function within the disassembly view on the left hand side, we can see that there are 542 xrefs available.
This means thatFUN_00401526is used 542 times throughout the file, a number this high is another strong indicator that the function is used for decoding.
We now know the location of a function that is likely responsible for decrypting the strings. Although we could analyse it statically, this is difficult, time consuming and often unnecessary.
A better method is to load the file into a debugger and use breakpoints to monitor the function's location. This method can be used to obtain input (encrypted string) and output (decrypted string) without needing to analyse the function manually. We just need to know where the function starts.
Loading The File Into x32dbg
Since we now have a function to monitor, we can go ahead and load the file into x32dbg for further analysis.
We can start this by dragging the file into x32dbg and allowing the file to reach its entry point using F9 or Continue.
Confirming and Synchronising Base Addresses in Ghidra
Before continuing analysis in the debugger, we need to confirm the base address is the same as in Ghidra. This ensures that the function will be stored at the same location.
The location within Ghidra and X32dbg will always be <base address> + xyz. But if <base address> differs, then we occasionally need to fix it.
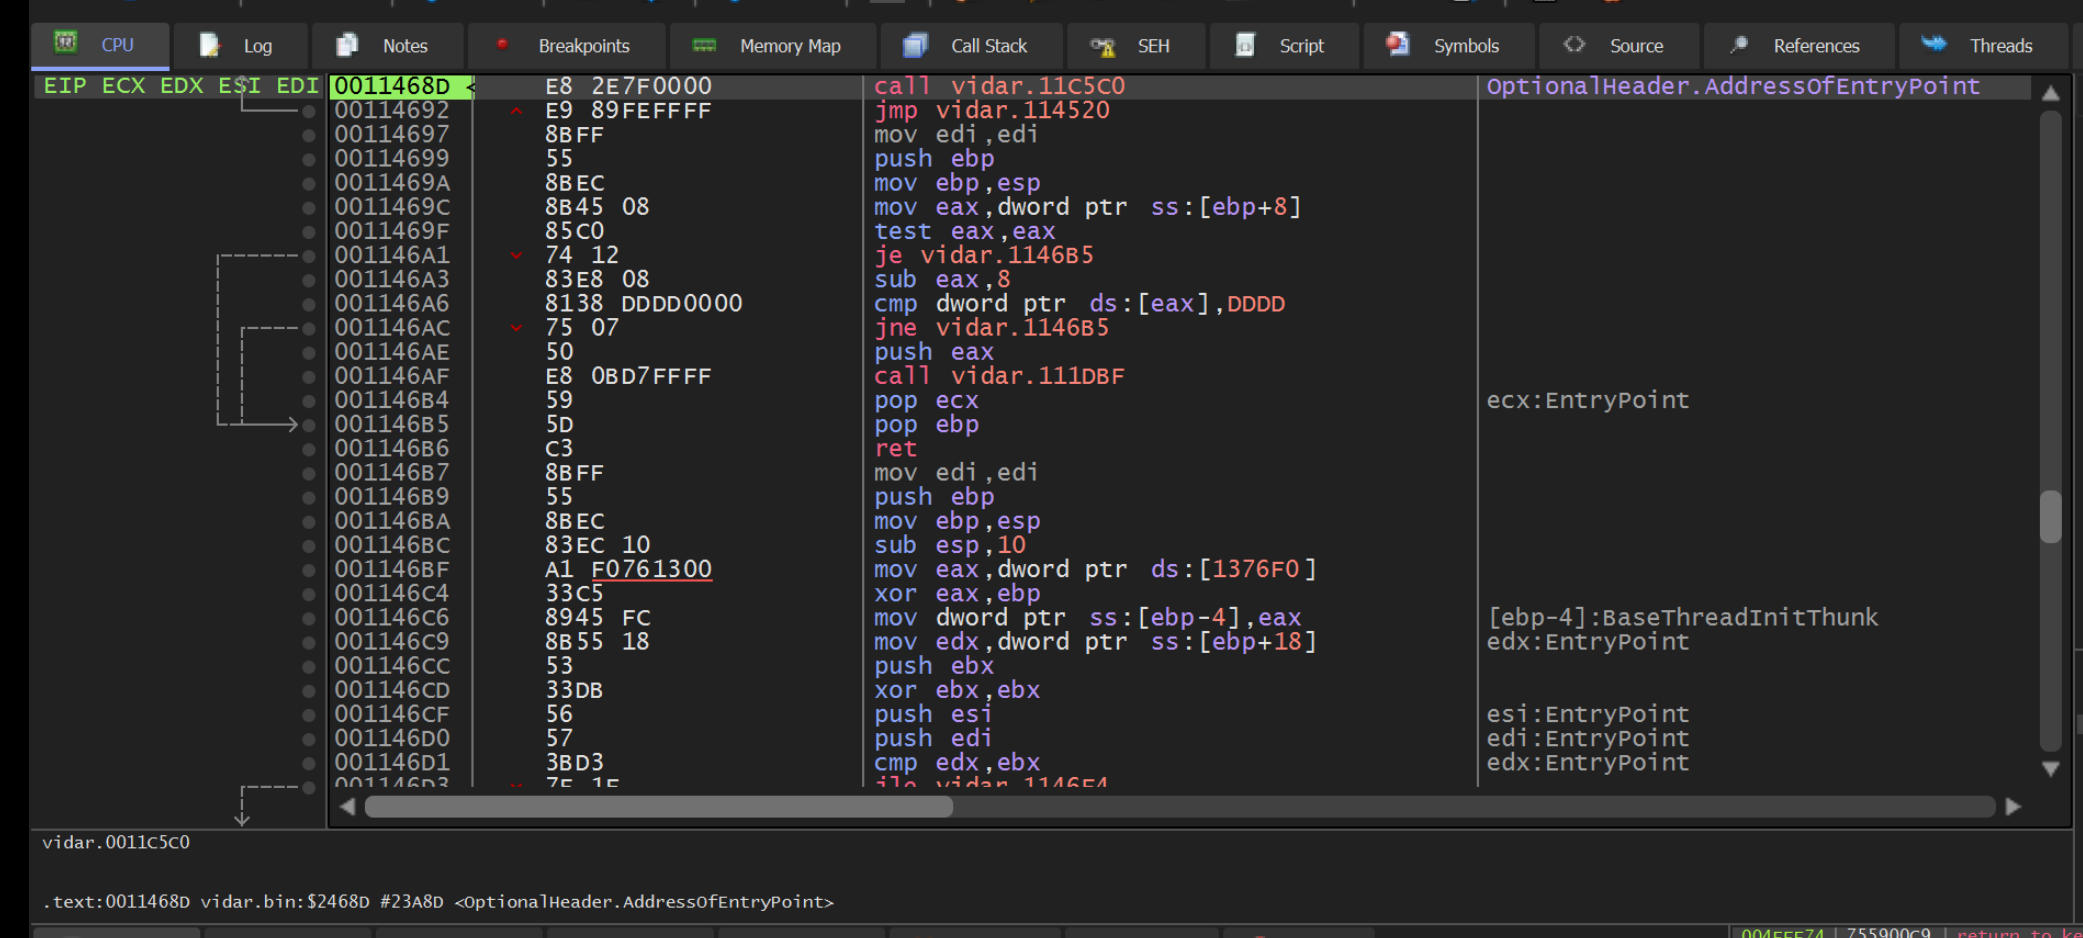
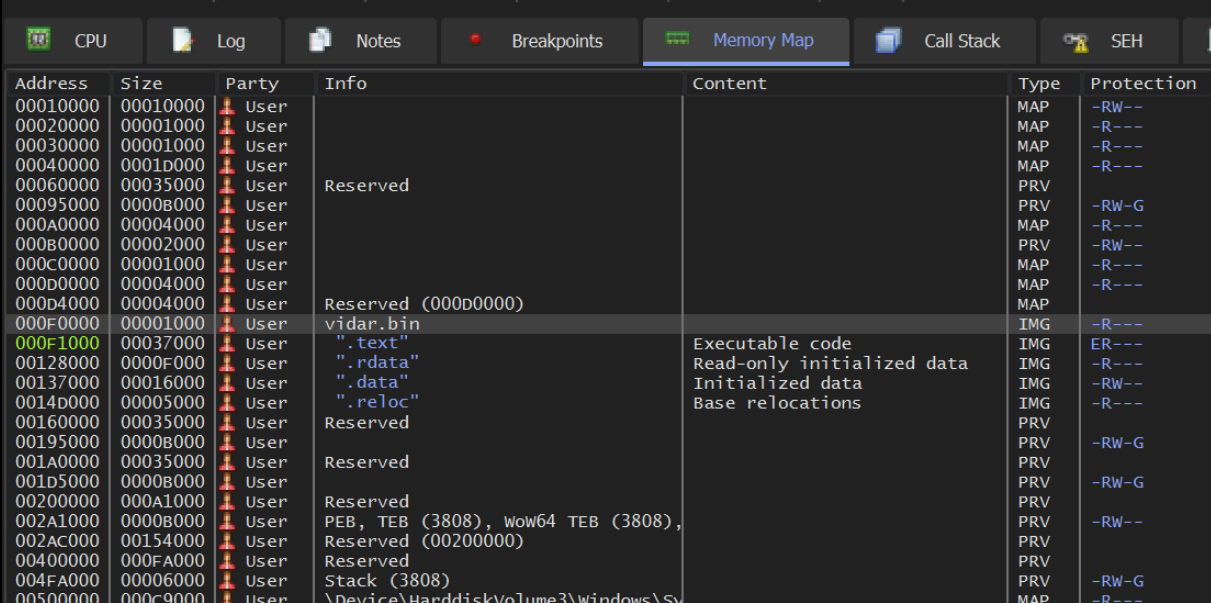
We can double-check the base address by clicking on the Memory map option within x32dbg. The base address will be the one on the same line as your file name.
The base address in our case was 0x000f0000 (this address may differ for you)
We need to make sure that this base address is aligned with Ghidra.
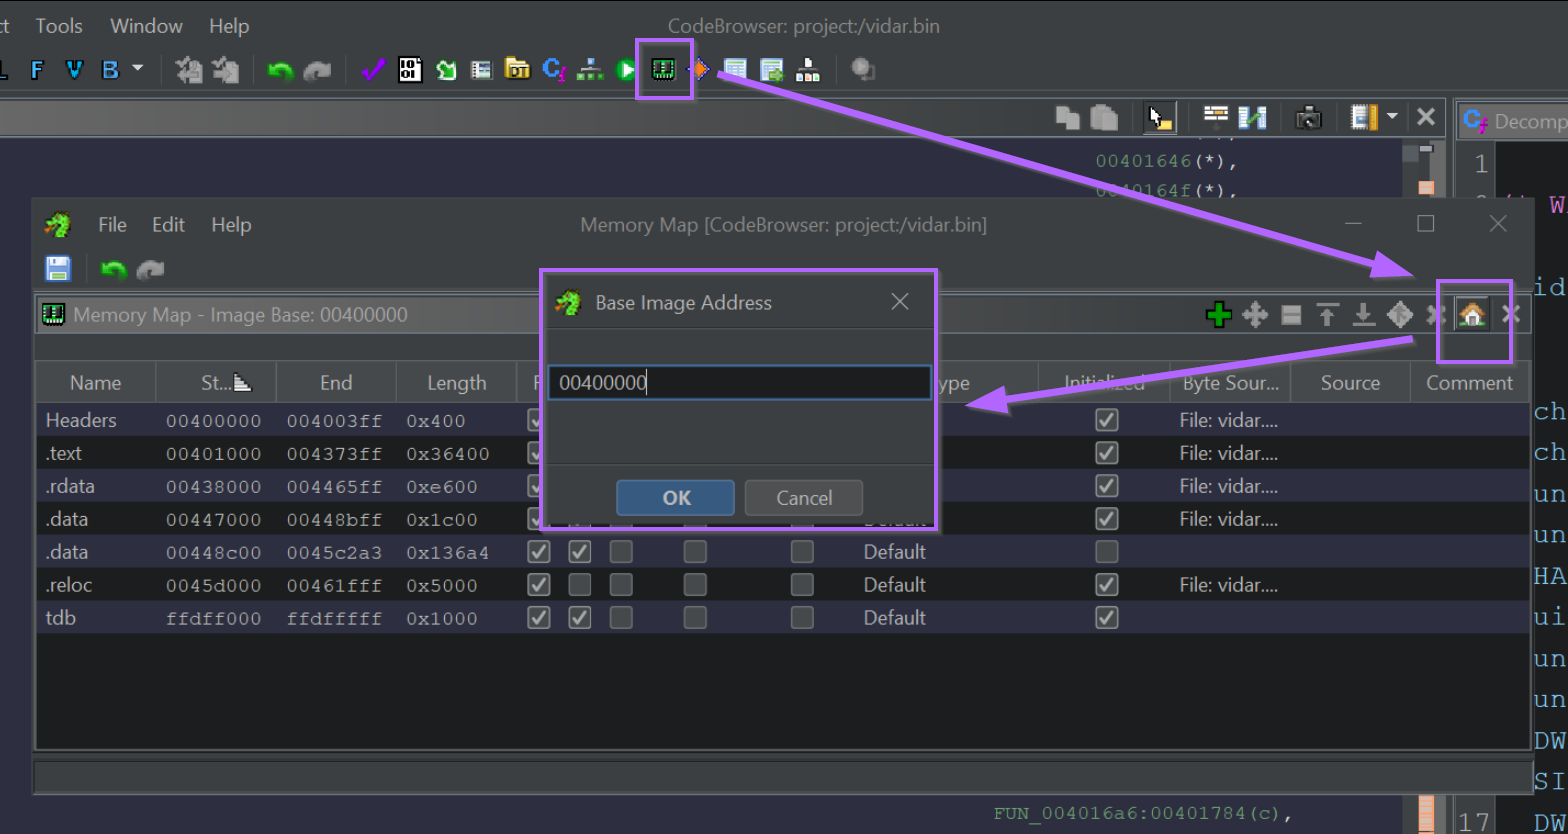
The base address can be found in Display Memory Map -> View Base Address.
In this case, Ghidra's base address is 0x00400000 , we can manually change this to match the 0x000f0000 found in x32dbg.
Fixing the base address is as simple as changing the value to 0x000f000
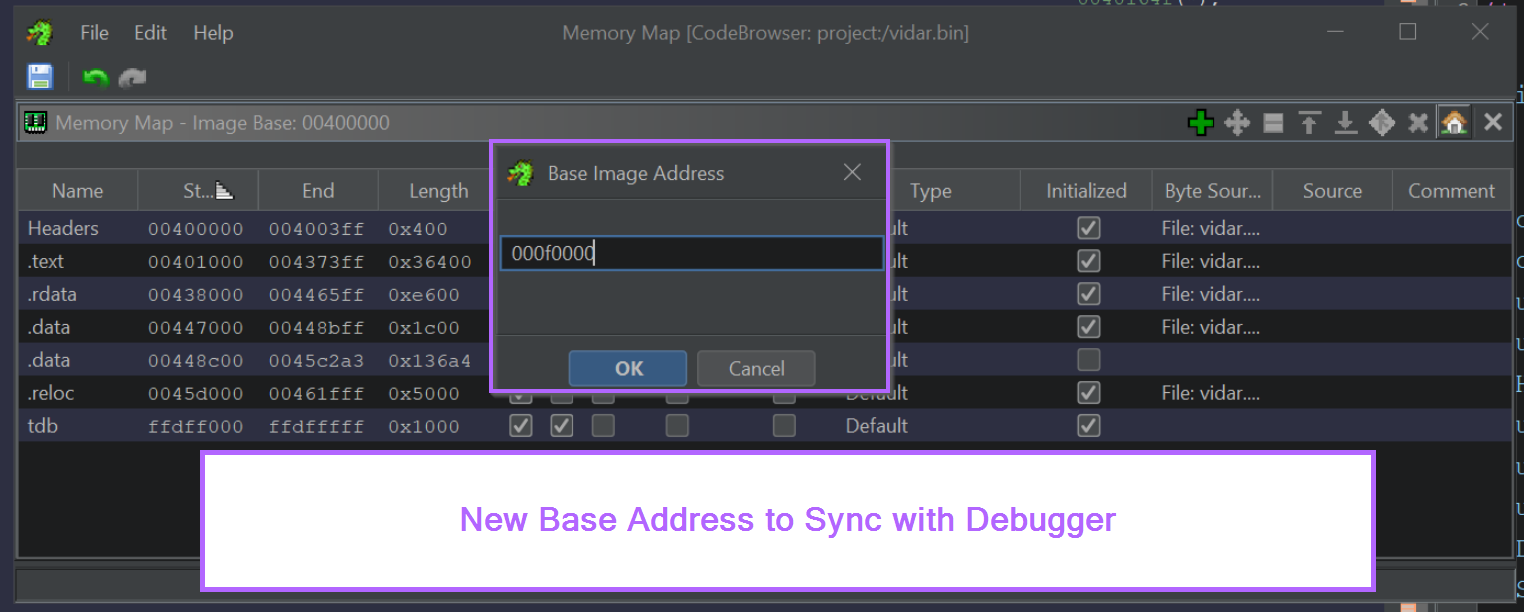
After selecting OK, Ghidra will reload the file with the new base address.
After reloading a base address, sometimes Ghidra will get lost. You may need to do another string search + xref (same process as before) to identify the string decryption function again.
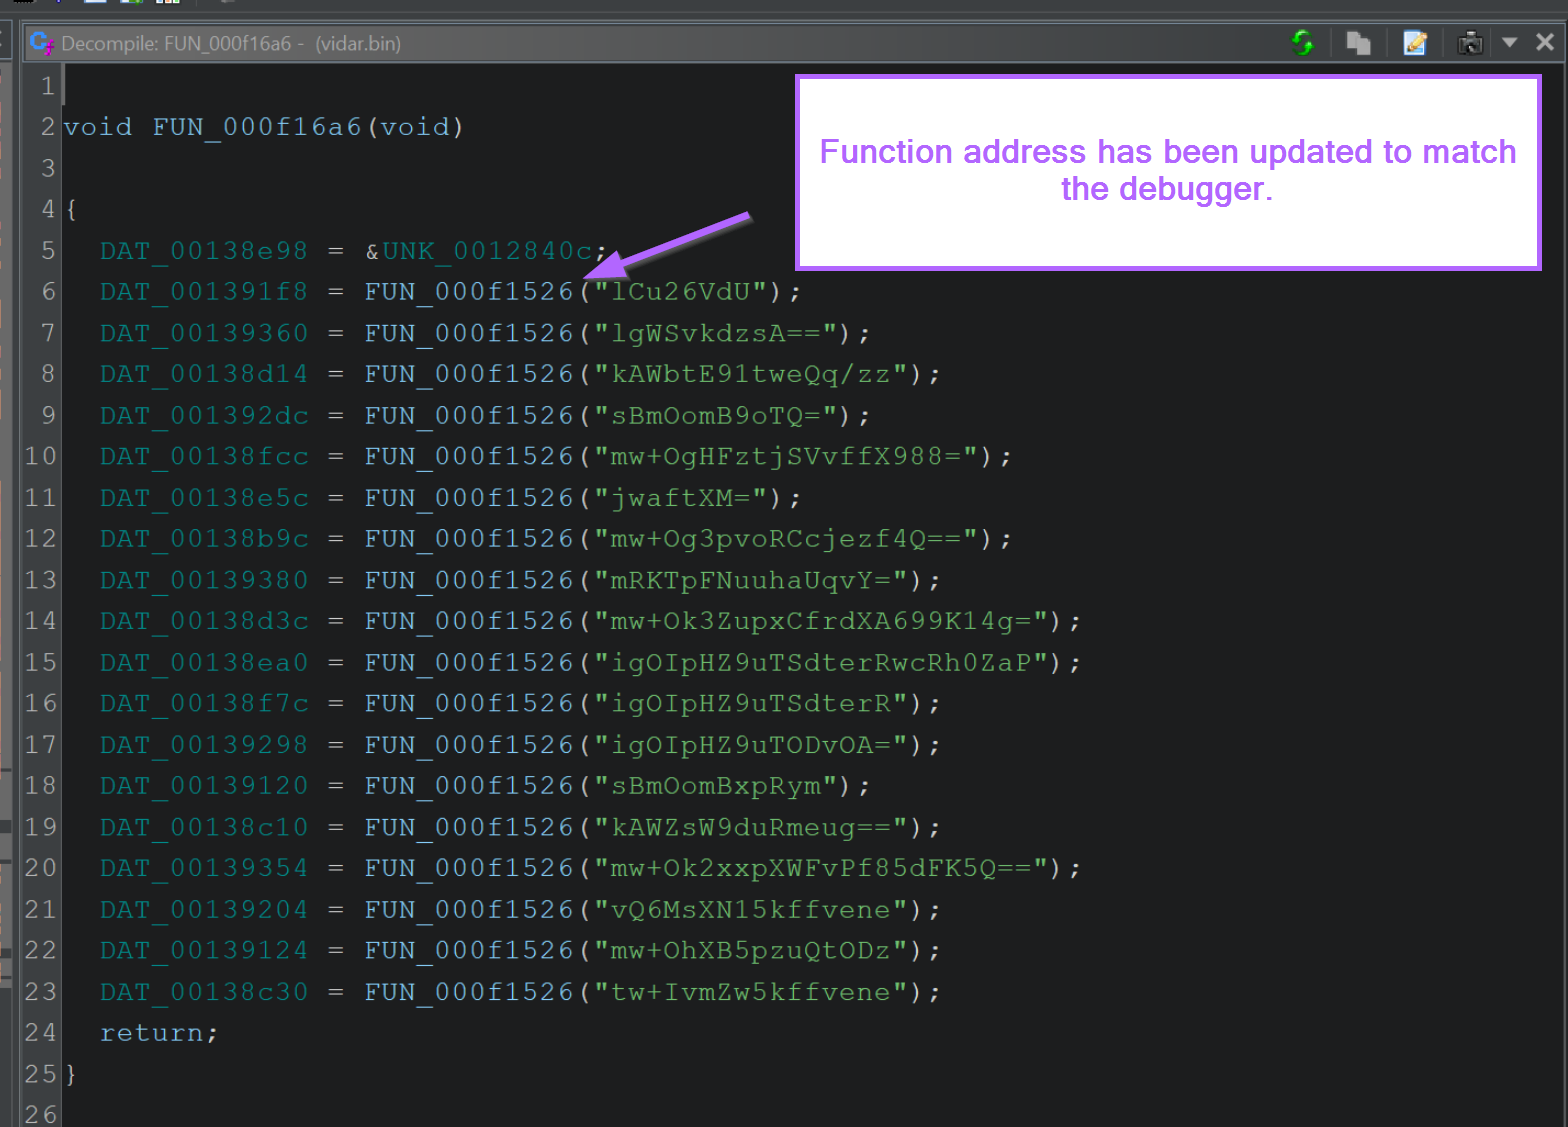
With the correct base address now loaded, the string decryption function will have a new name FUN_000f1526 to reflect its new location.
We can now use this address 000f1526 to create a breakpoint within x32dbg.
Setting Breakpoints on the Decryption Function
We now want to create a breakpoint at the corrected address of the decryption function.
Using the new address of 000f1526, we can go back to x32dbg and create a breakpoint using bp 000f1526
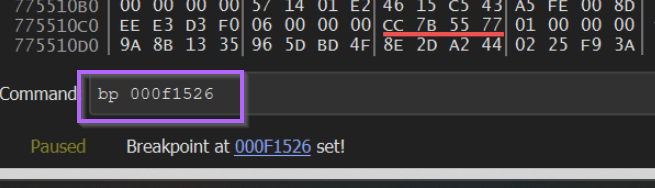
With the breakpoint set, we can let the malware run until the function is triggered.
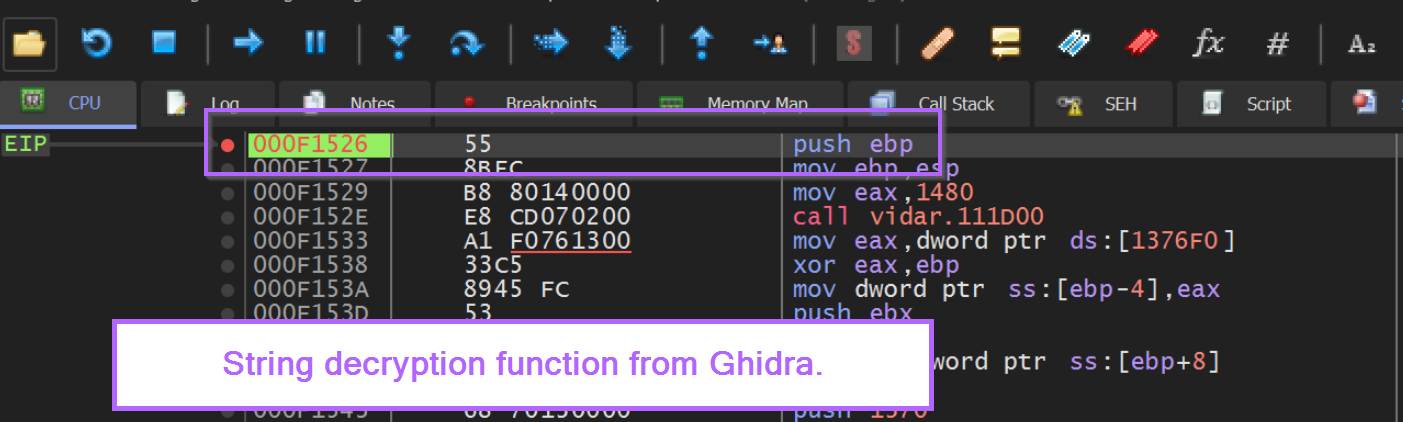
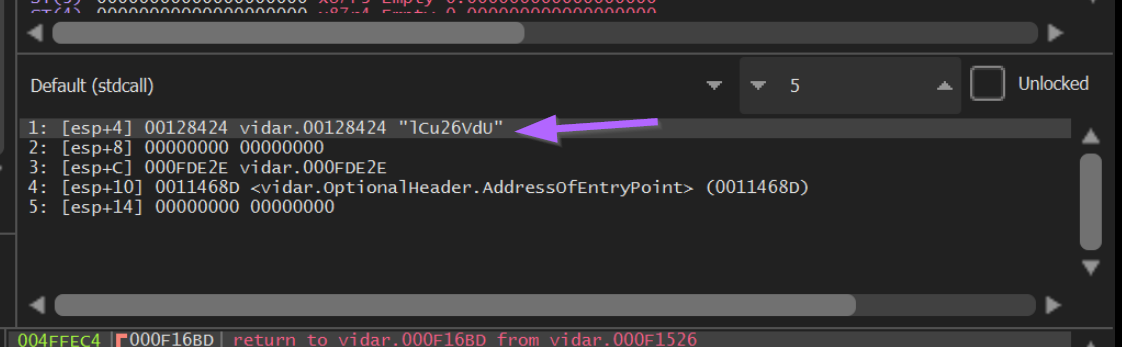
When the breakpoint is hit, we can view the current encoded string within the stack window on the right-hand side of x32dbg.
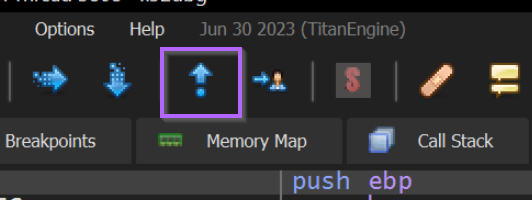
If we allow the function to complete using the Execute Until Return option, we can jump to the end of the decryption function and see if any decrypted output is present.
Execute Until Return tells the debugger to allow the current function to finish without continuing beyond the current function. This is an easy way to obtain function output without it getting lost somewhere during execution.
The "Execute Until Return" button looks like this.
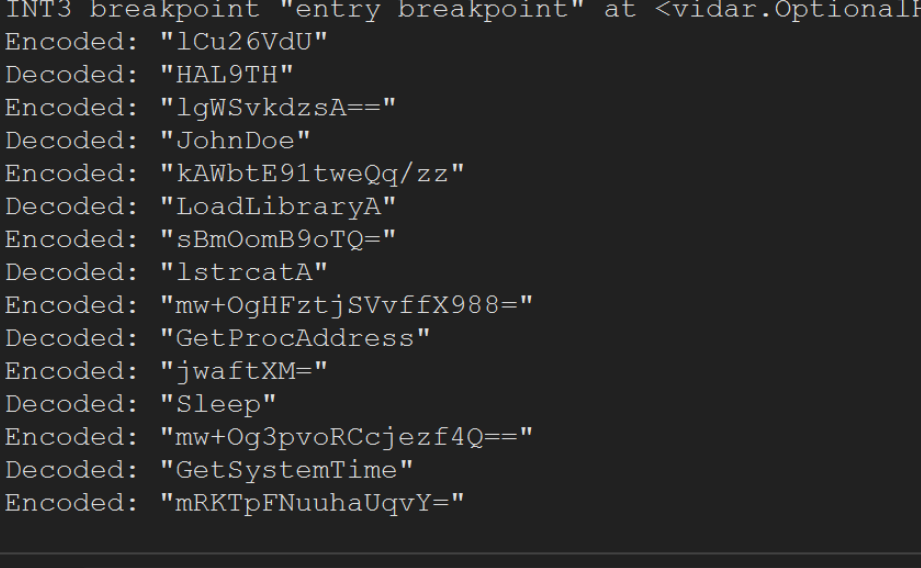
After the Execute Until Return has completed, we can observe the first decoded string HAL9TH within the register window.
The decoded string is contained within EAX, which is the most common location where function output will be stored. 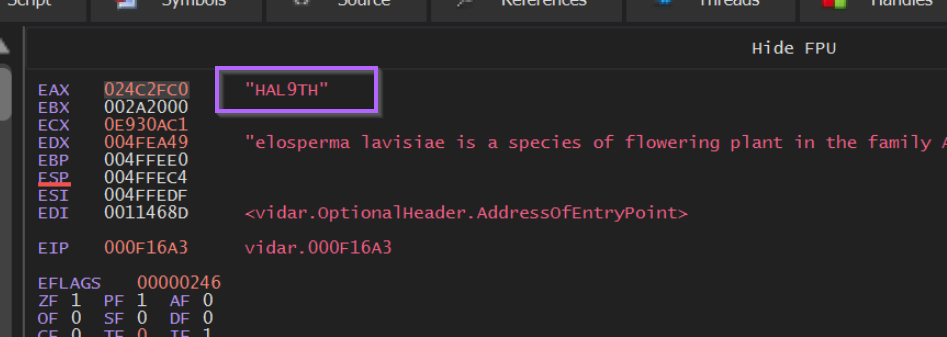
Now that the decoded string is visible, we should note the current location of EIP within the debugger. This will tell us the exact location where we can find a decrypted copy of the string.
In the screenshot below, we can see that this location is 0x000f16a3. This is the end of the decryption function, and we should create another breakpoint here.
Creating a breakpoint here is functionally identical to using Execute Until Return every time we hit the function, but creating a second breakpoint is much easier. 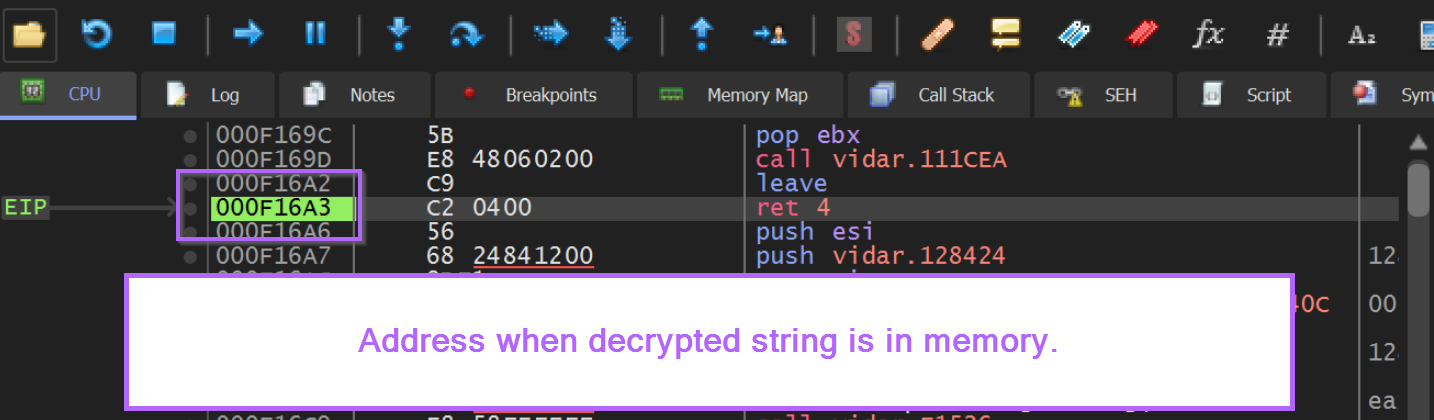
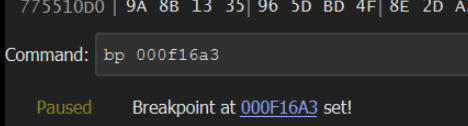
The new breakpoint can be created with bp 000f16a3 or by pressing F2 on the address highlighted in green.
If we continue to execute using F9 or Continue, we will hit the original string decryption function again.
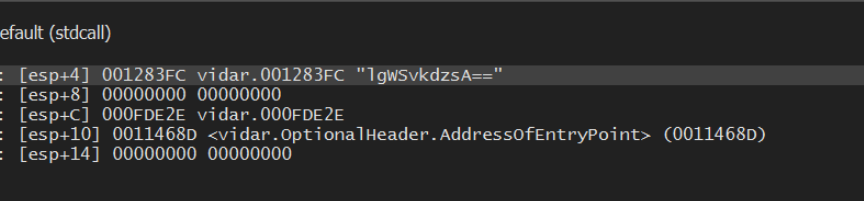
This time there is a new encoded string present in the stack window lgWSvkdzsA==.
Allowing the malware to run with F9 again, will trigger our second breakpoint, which contains the decoded value of JohnDoe.
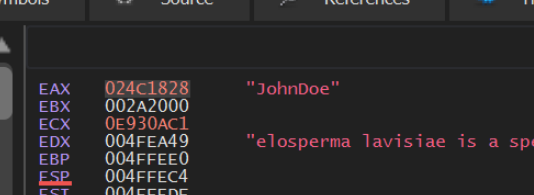
As you obtain decrypted values, it can be useful to google them to determine their purpose within the context of malware.
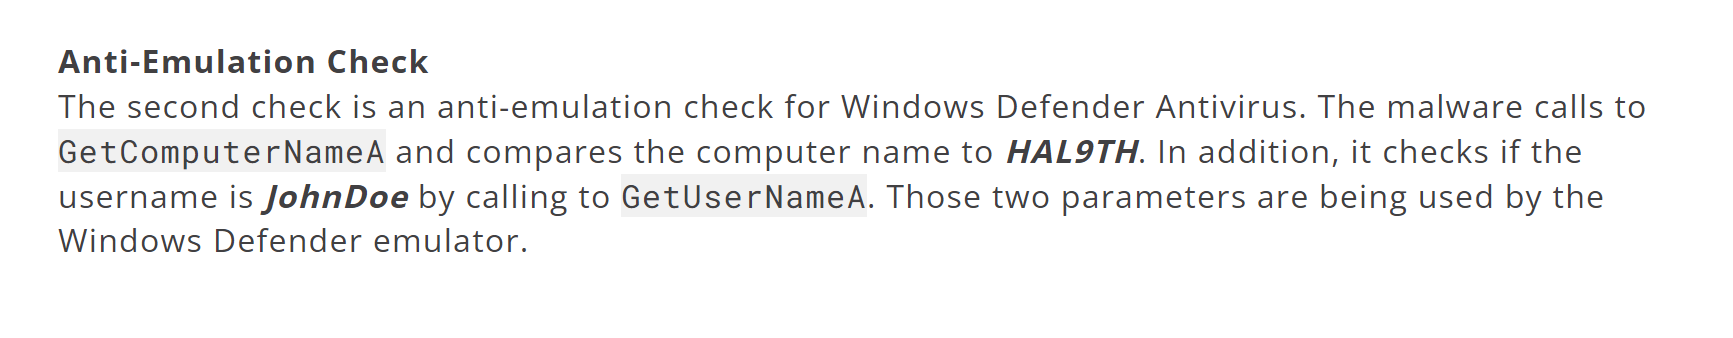
According to CyberArk, The two values JohnDoe and HAL9TH are default values used by the Windows Defender Emulator. The malware likely uses these values later to determine if it's being emulated inside of Windows Defender.
Obtaining Additional Decoded Values
By allowing the malware to execute with F9, we will continue to hit the existing breakpoints and observe decoded values.
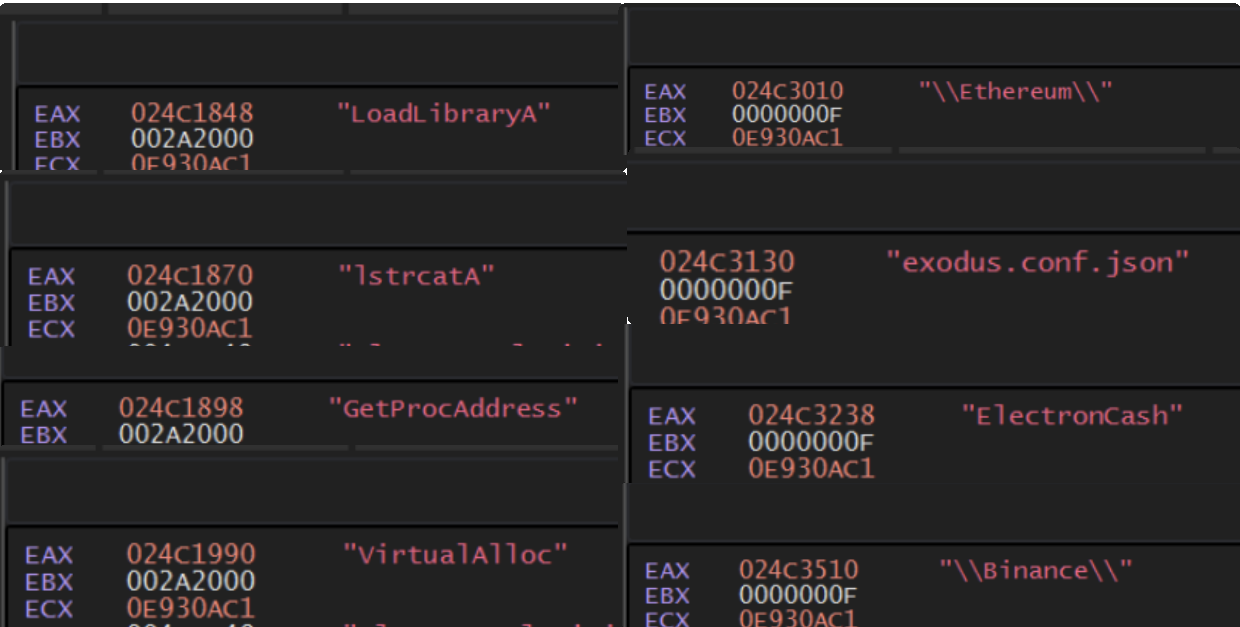
Here, we can see that the malware has decrypted some Windows API names (LoadLibraryA, VirtualAlloc) as well as strings related to Crypto Wallets (Ethereum, ElectronCash, Binance).
We can use this knowledge to assume that the malware is dynamically loading APIs, and likely stealing the data of Crypto Wallets.
If we recall, there were 542 references to the string decryption function before. Since there are a few too many to observe manually, we can go ahead and perform some basic automation using a debugger.
Automating the Process With Conditional Breakpoints
Now that we have existing breakpoints at the start and end of the decryption function, we can add a log condition to print the interesting values to the log window.
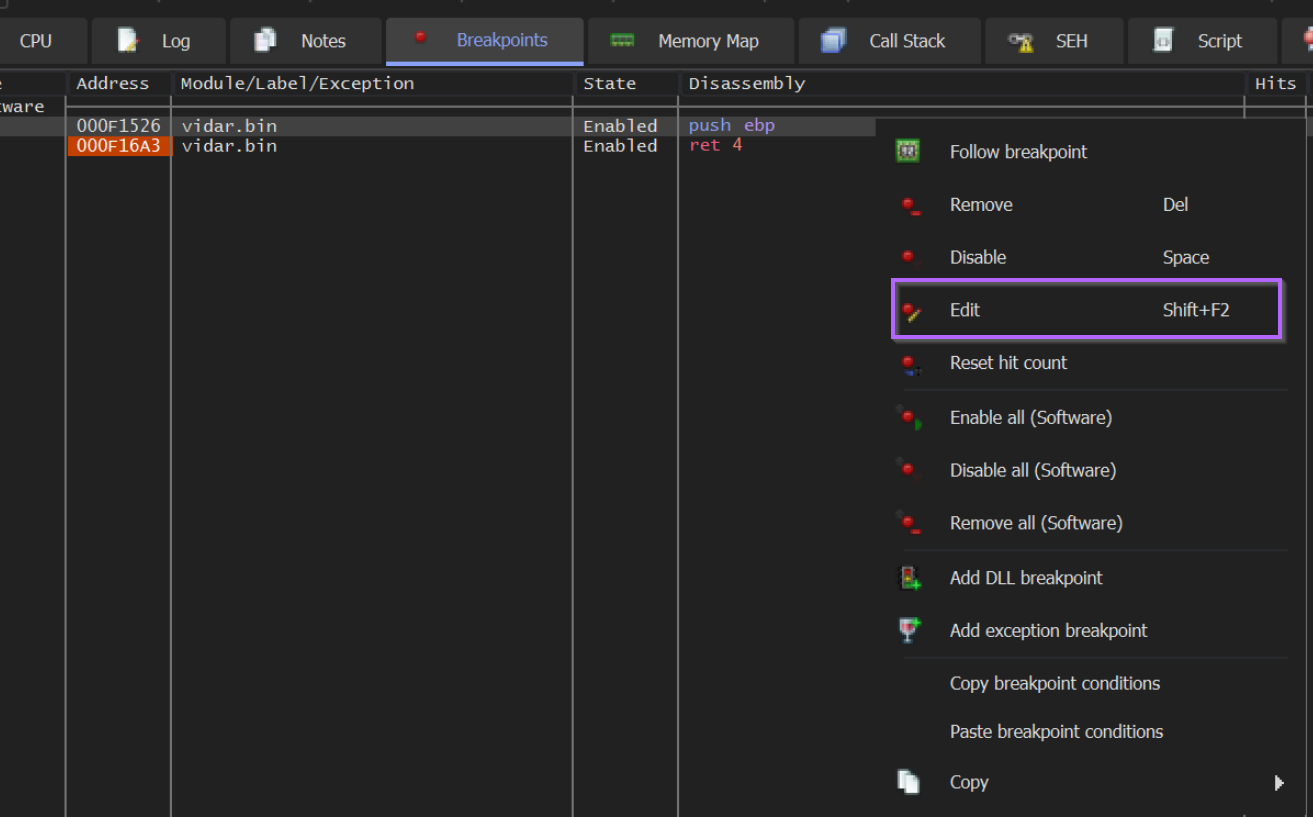
We can add a log condition by modifying our existing breakpoints. We can do this within the breakpoint window, and then Right-Click -> Edit on the two existing breakpoints.
Printing Encoded Strings With x32dbg
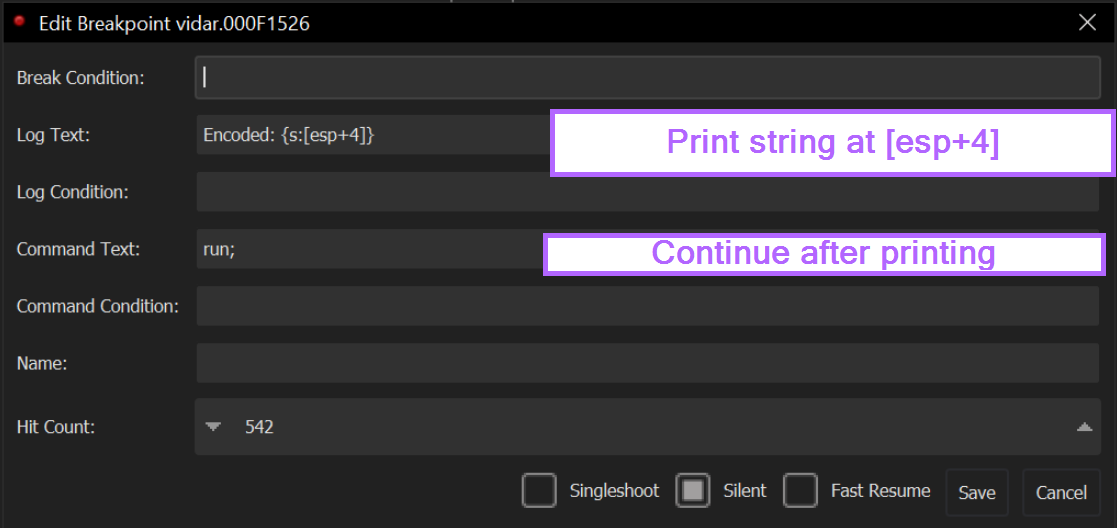
Our first breakpoint is at the "start" of the encryption function, and we know from previous analysis that the encoded value will be inside the stack window.
Observing the stack window closer, we can see that the exact location is [esp+4]
We can now tell the breakpoint to log the string contained at [esp+4]
We can do this with the command Encoded: {s:[esp+4]}. The "Encoded: " part is not necessary but it makes the output easier to read.
Since we don't need to stop at every breakpoint (we just want to log the results), we can add another condition run; in Command Text.
This will tell x32dbg to resume execution after printing the output.
Printing Decoded Strings with x32dbg
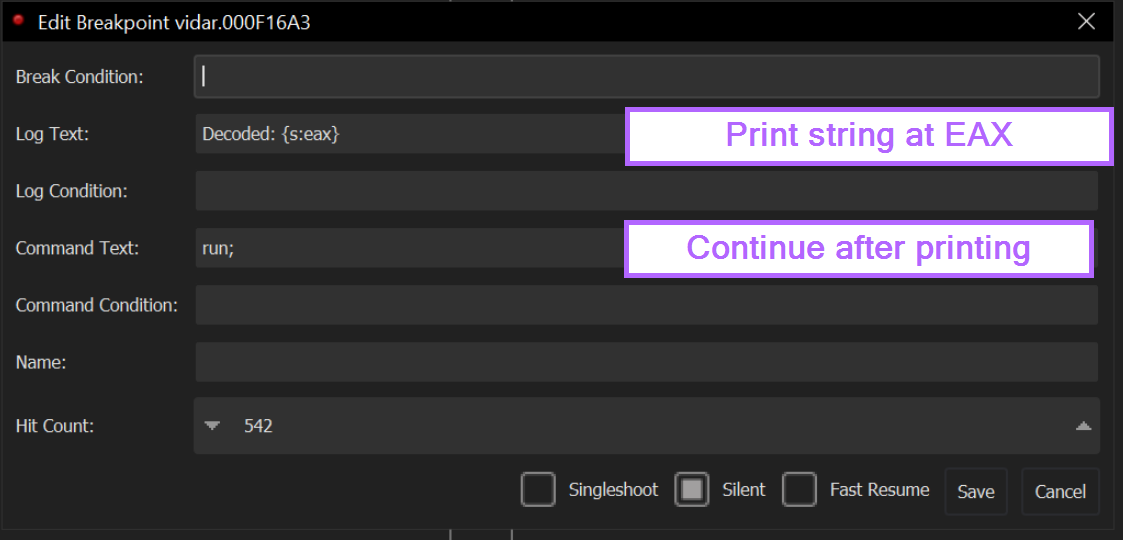
We can repeat the same process for the second breakpoint.
This time instead of printing [esp+4], we want to print the decoded value contained in eax
After editing the second breakpoint, we want it to look something like this.
This should be identical to the previous breakpoint, with only [esp+4] being replaced with eax.
We can also change Encoded: to Decoded: to make the final output easier to read.
With the new breakpoints saved, we can restart the malware or allow it to continue its current execution. This will print all encoded and decoded values to the log window.
(You can find the log window next to the breakpoints window)
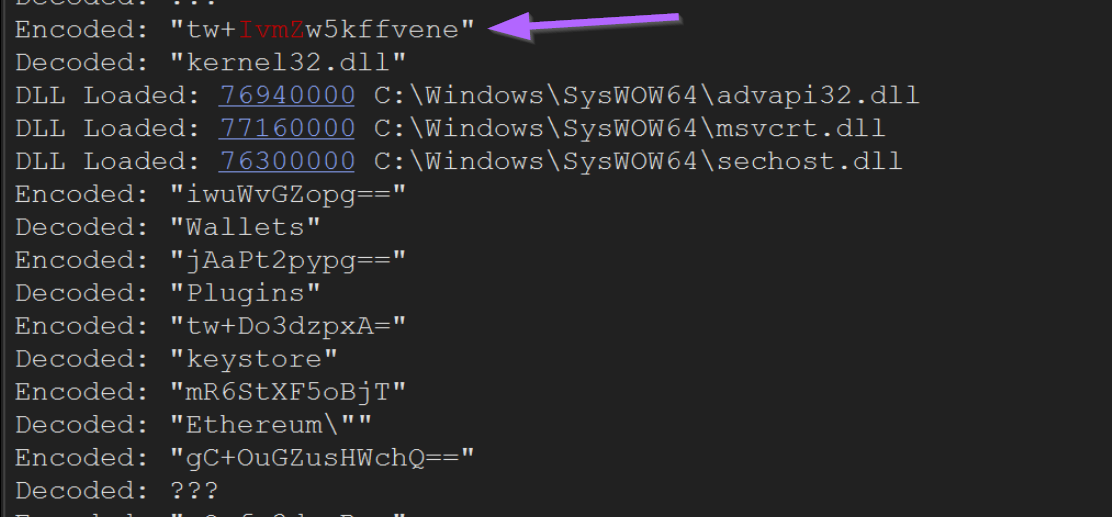
After restarting the malware and leaving the breakpoints intact, we can see our initial encoded string and its decoded value of kernel32.dll.
We can also see additional decoded values related to Ethereum key stores.
Obtaining Only Decrypted Values
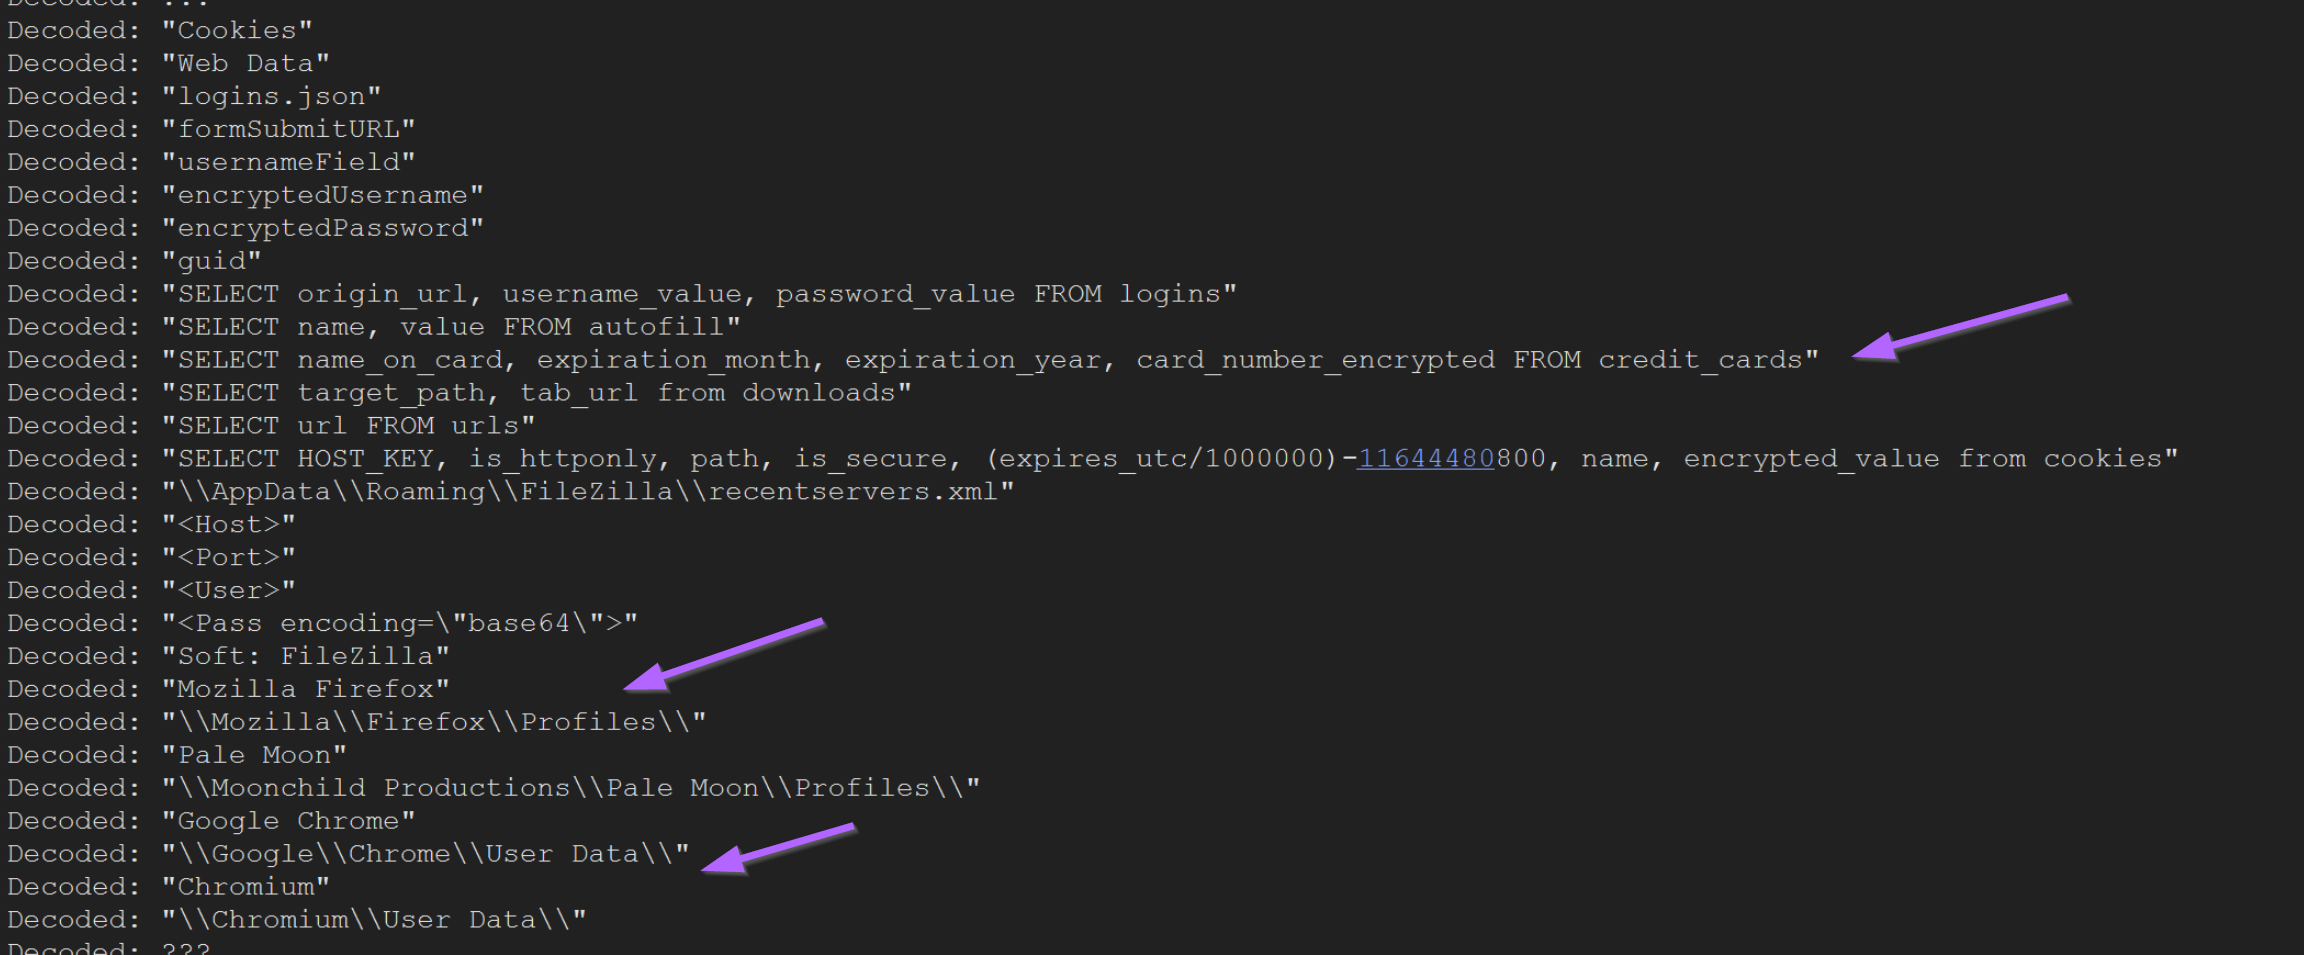
By temporarily disabling the initial breakpoint (right click -> disable) , we can print only the decoded values. Here, we can see some potential encryption keys, as well as SQL commands used to steal mozilla Firefox cookies.
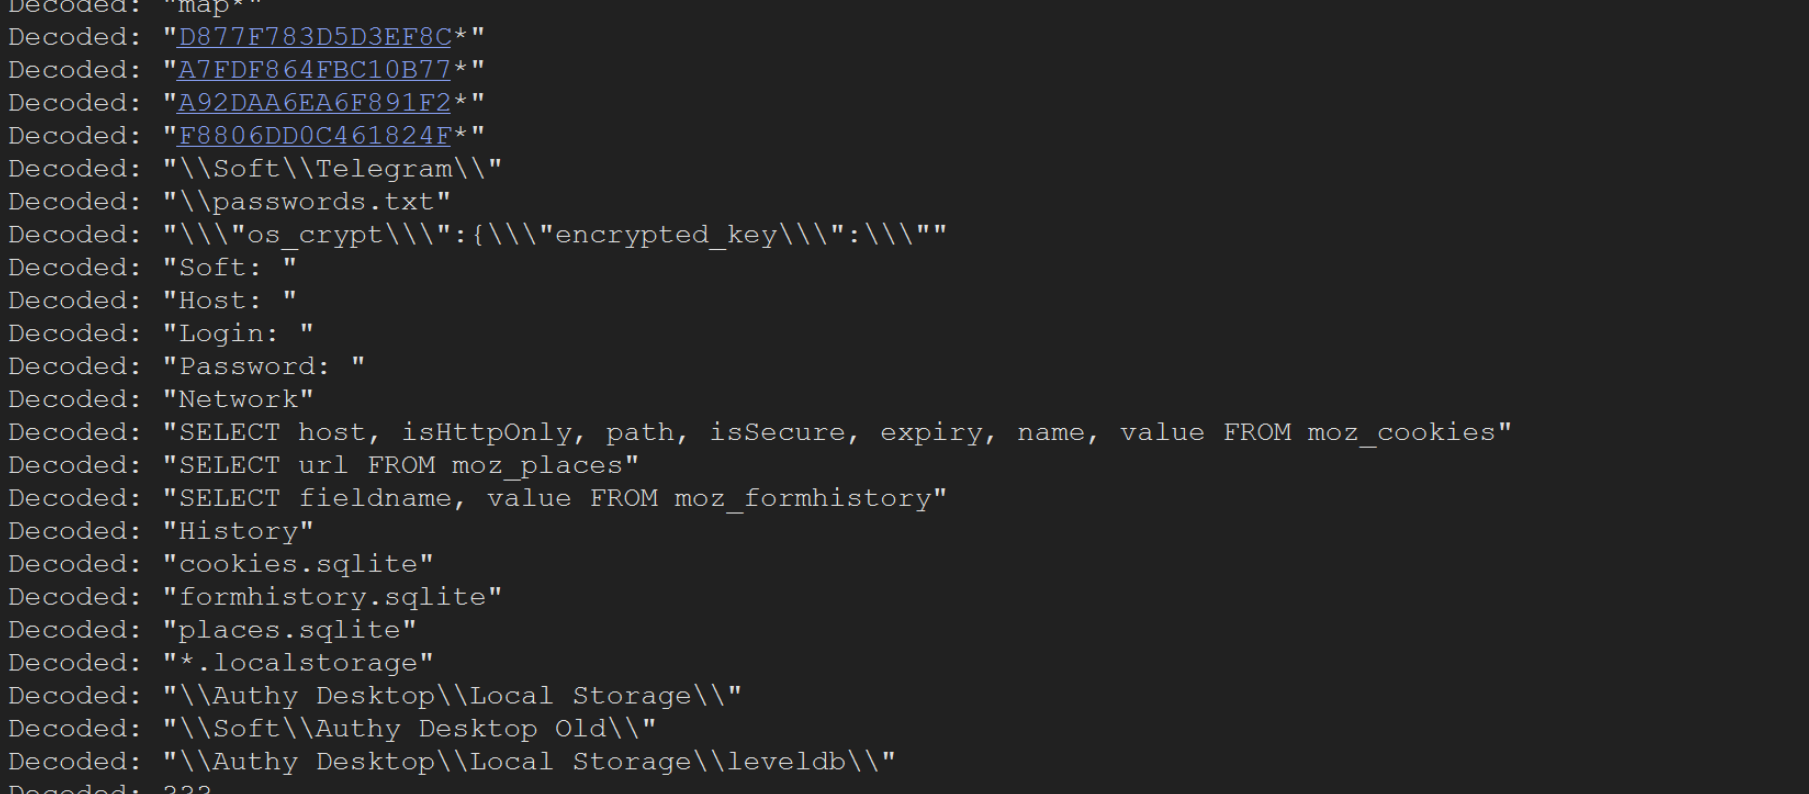
We can also observe that the malware attempts to steal credit card information from web browsers.
Using Results to Edit Ghidra Output
If we go back to Ghidra, we can revisit the initial function containing references to encrypted strings.
Since we now have both the encrypted and decrypted values, we can edit the Ghidra view to reflect the decoded content.
Here we can see decoded values within x32dbg, reflecting the same encoded values as the above screenshot.
We can also note that after each call to the decoding function, the result is stored inside of a global variable (indicated by a green DAT_00138e98 etc on the left-hand side).
This usually means that the same variable will be referenced each time the decoded string is used. If we rename the variable once, it will be renamed in all other locations that reference it.
We will see this in action in a few more screenshots.
Using the output from x32dbg, we can begin renaming those global variables DAT_000* etc to their decoded values.
This will significantly improve the readability of the Ghidra code.
This process can be done manually or by saving the x32dbg output and creating a Ghidra Script. The process of scripting this is in Ghidra is relatively complicated and will be covered in a later post.
For now, we can edit the names manually (Right Click -> Rename Global Variable)
Below we can see the same code after some slight renaming. Make sure to reference the x32dbg output.
We like to prepend each variable with str_ to indicate that it's a string. This is optional but improves the readability of the code. 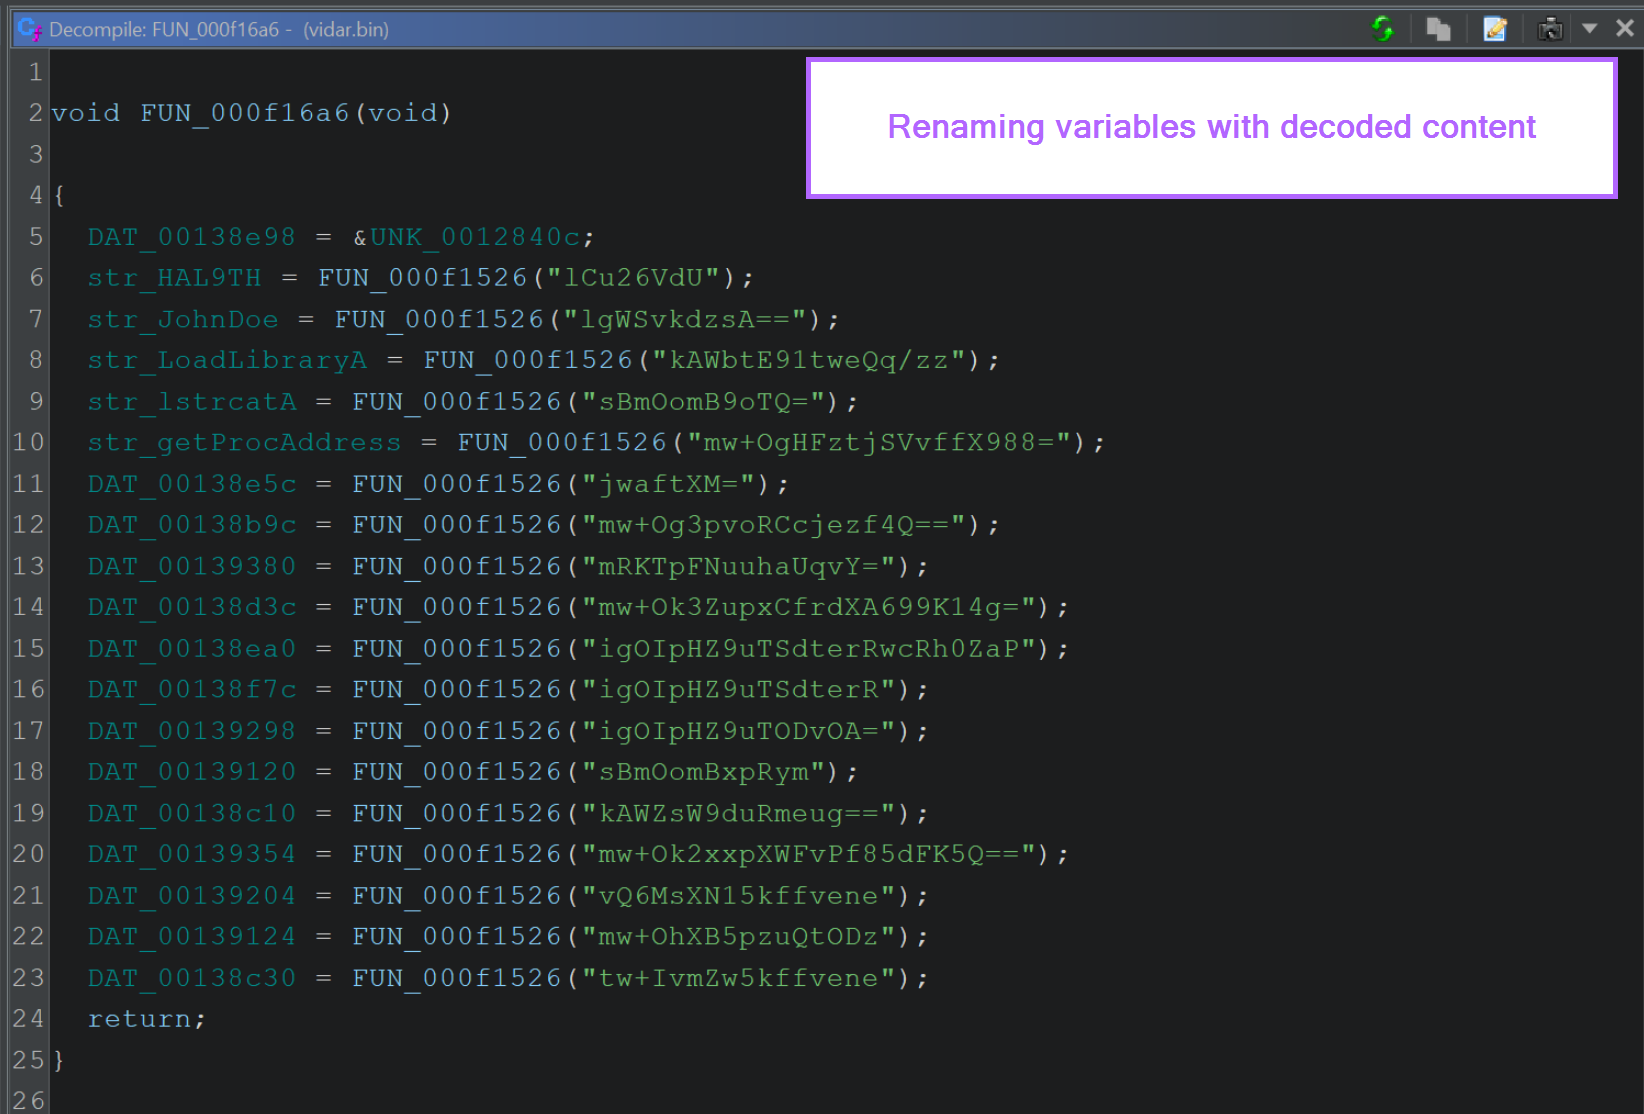
With the DAT_* locations modified to their decoded values, any location within Ghidra that contains the same DAT_ value will now have a suitable name, making it much easier to infer the purpose of the function.
To determine where a variable is used, we can again use cross references. Double clicking on any of theDAT_* values will show it's location and any available cross references where it is used. 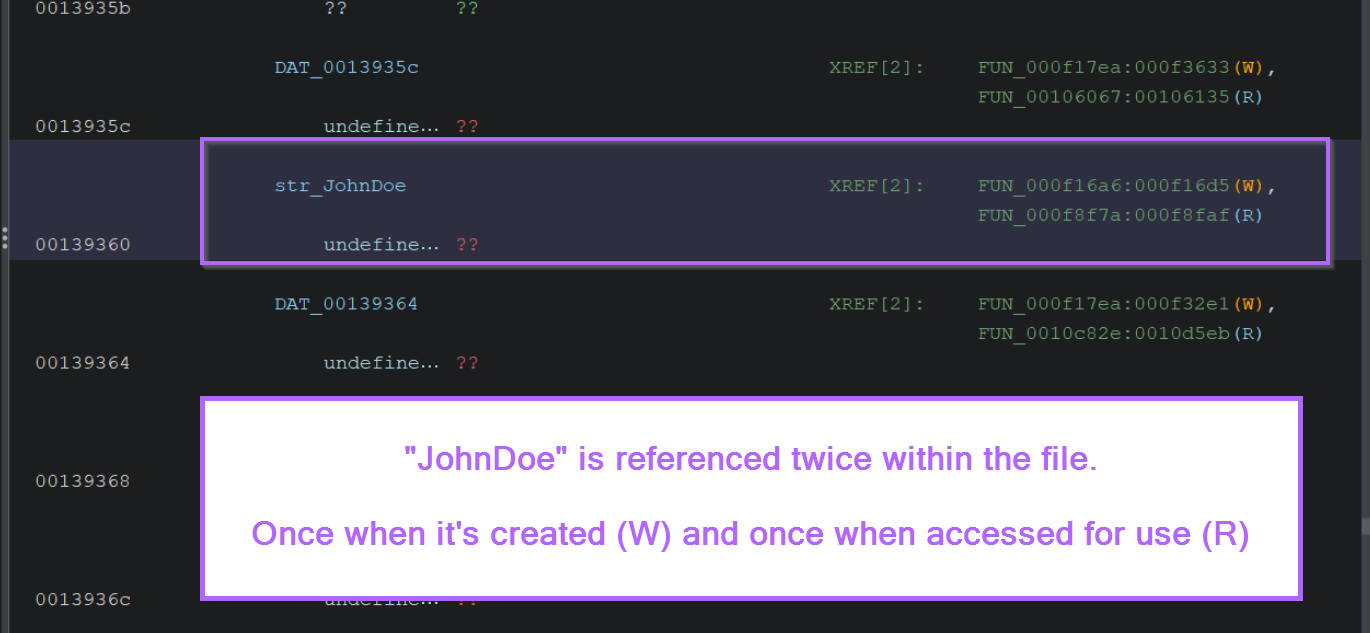
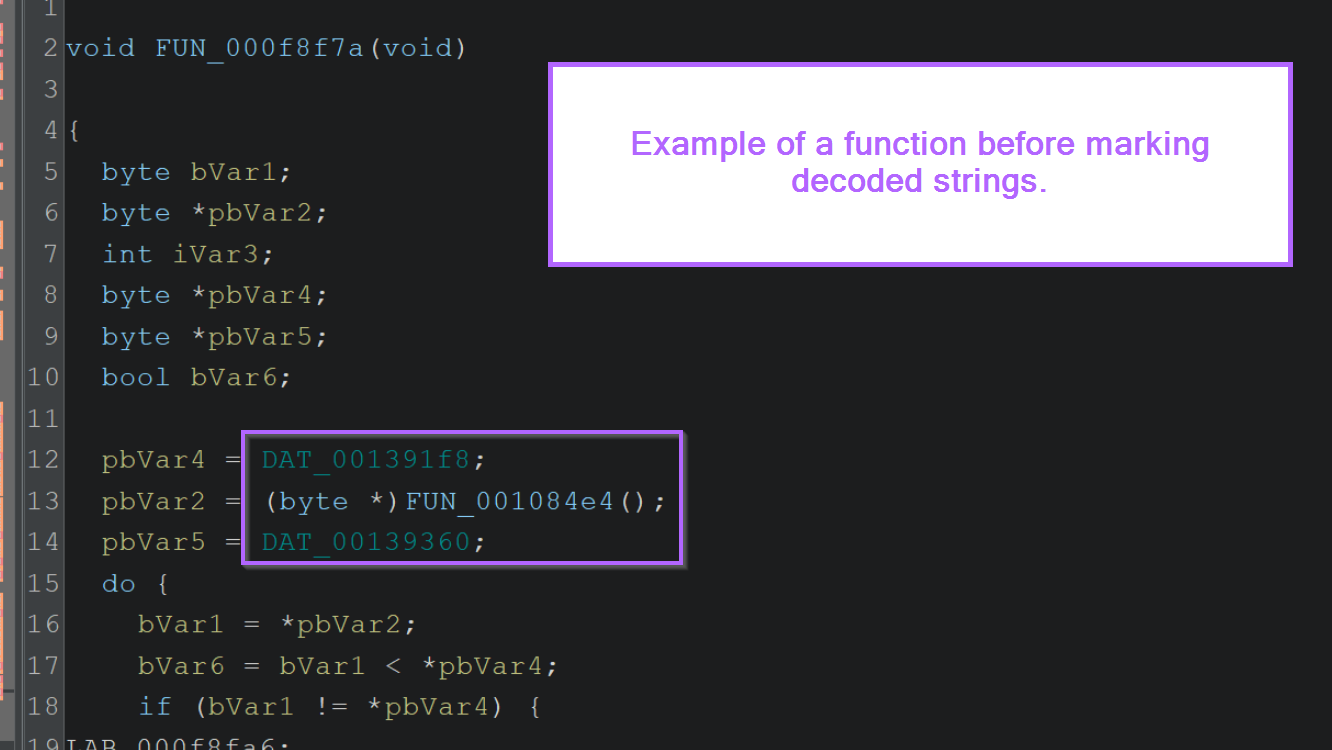
For example, here is the function containing "JohnDoe" before the DAT_* values are renamed.
If we had encountered this function without first decrypting strings, it would be difficult to tell what the function is doing.
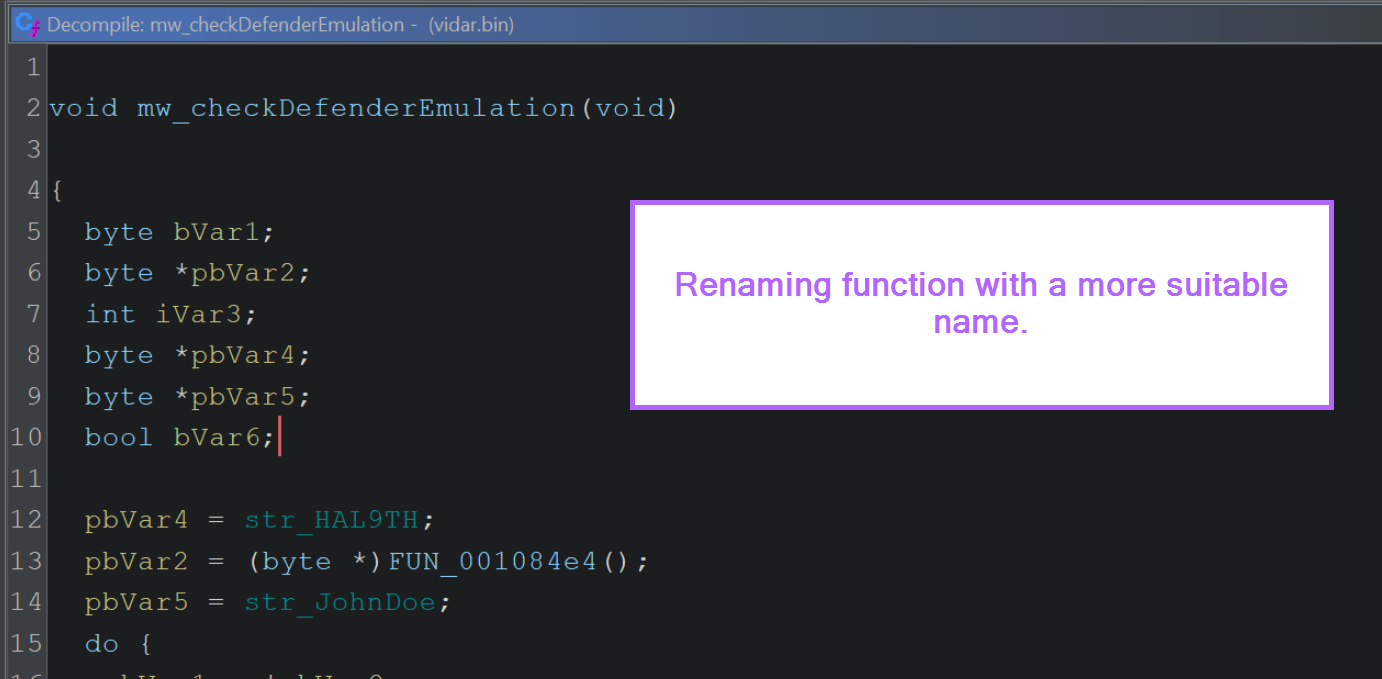
After marking up the DAT_* values with more appropriate names, the function now looks like this.
Since we googled these values and determined they are used for Defender Emulation checks, we can infer that this is (most likely) the purpose of the function.
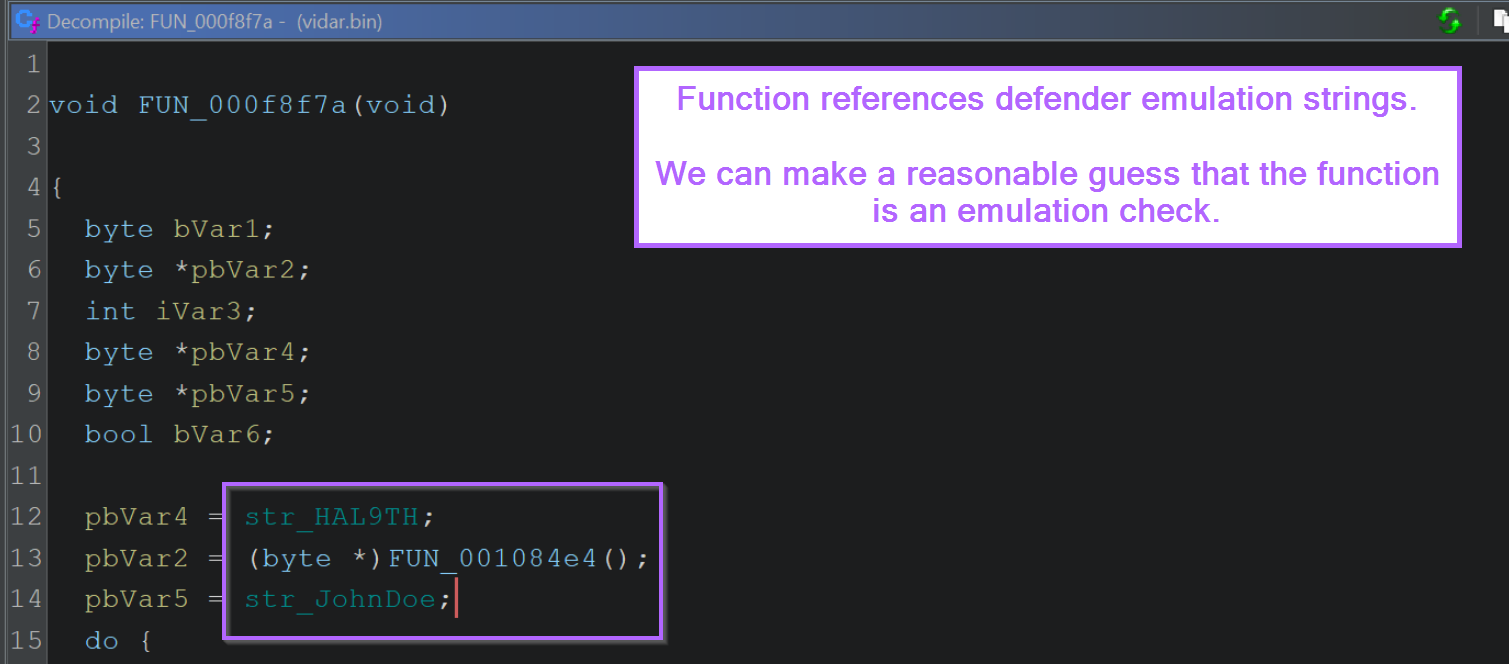
Using that assumption, we can change the name to something more useful.
Now, anywhere where that function is called will be much more understandable.
To see where a function is called, we can double click it and view the x-refs again to see where the function is used.
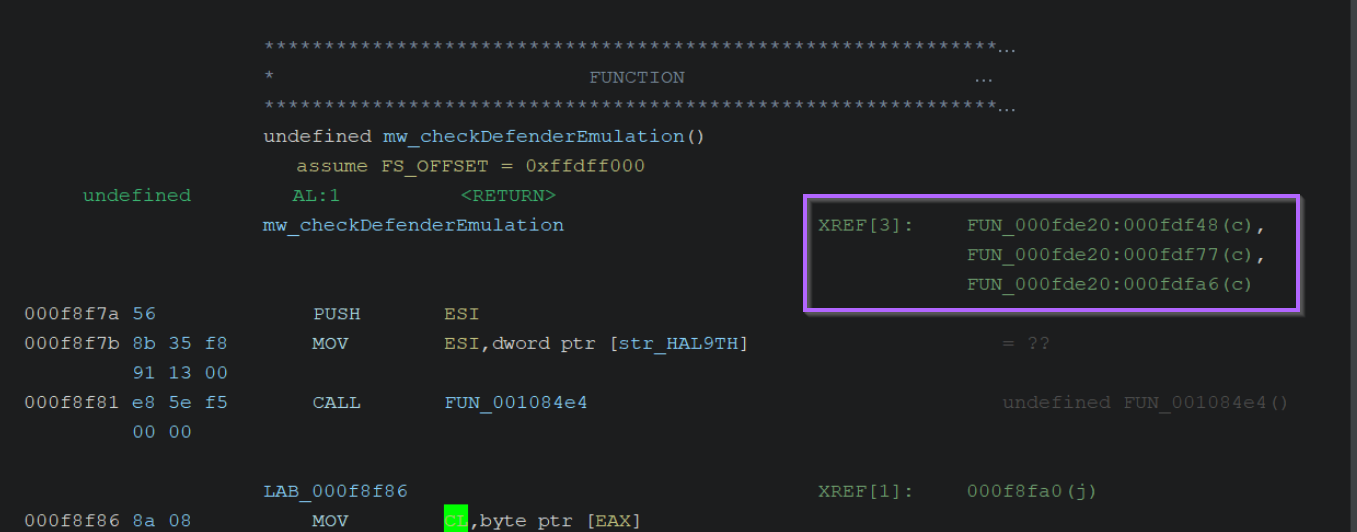
Here is one such reference, which doesn't make much sense at initial glance.
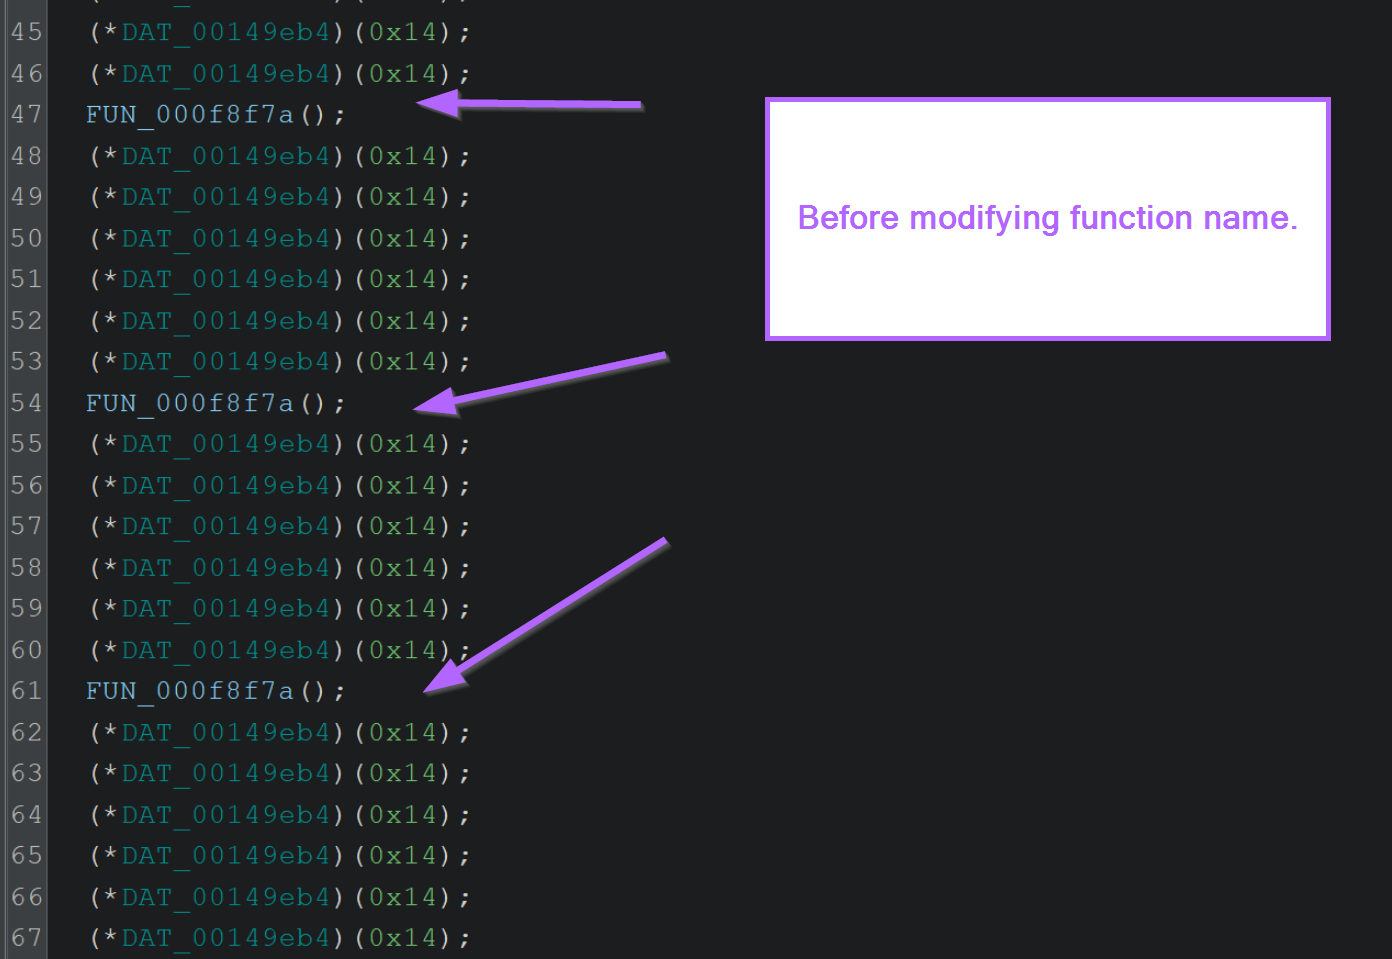
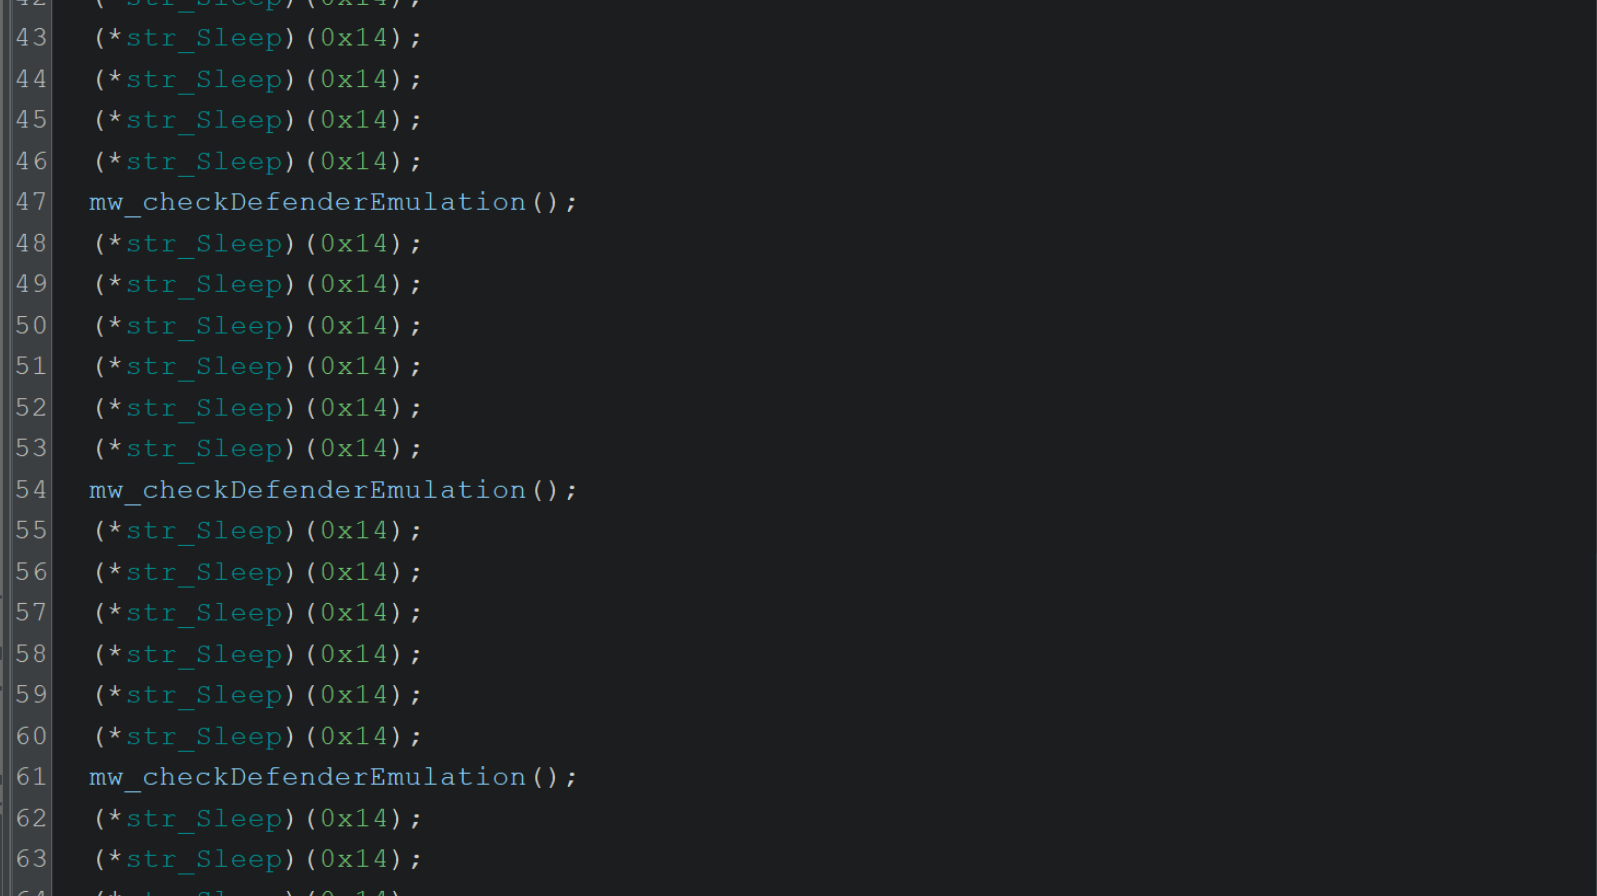
After renaming the function to mw_checkDefenderEmulation, it begins to make more sense.
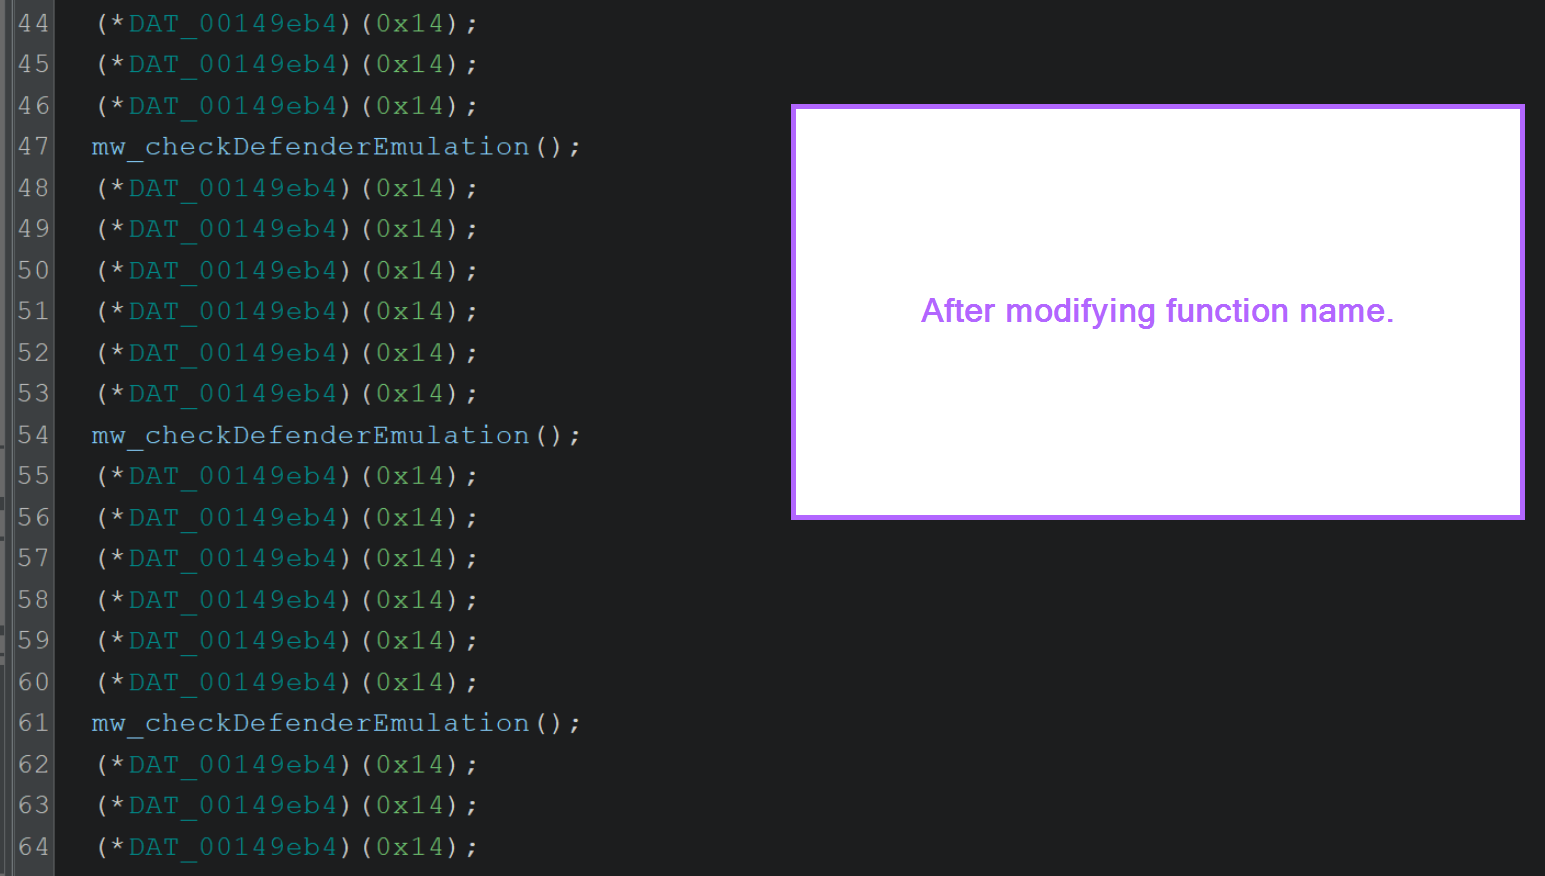
After renaming all remaining DAT_* variables, it begins to make even more sense.
The malware is temporarily going to sleep and repeatedly checking for signs of Defender Emulation.
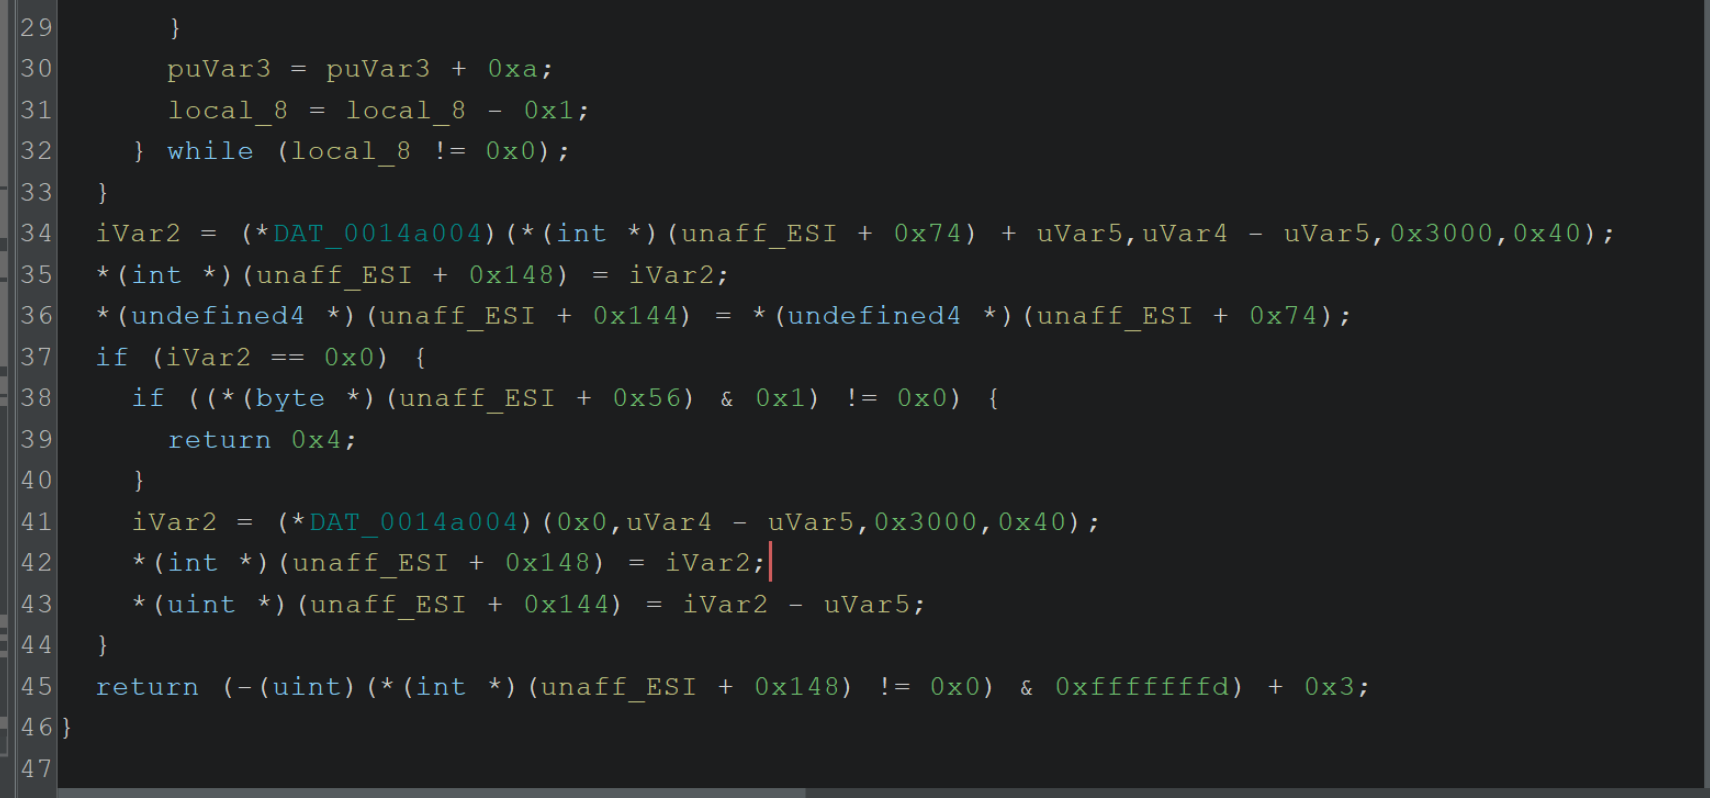
A similar concept can be seen with the decoded string for VirtualAlloc.
Below is a function referencing VirtualAlloc, prior to renaming variables.
After renaming, we can see that its primary purpose is to create memory using VirtualAlloc.
(There are some other things going on, but the primary purpose is memory allocation, hence we can rename this function to mw_AllocateWithVirtualAlloc)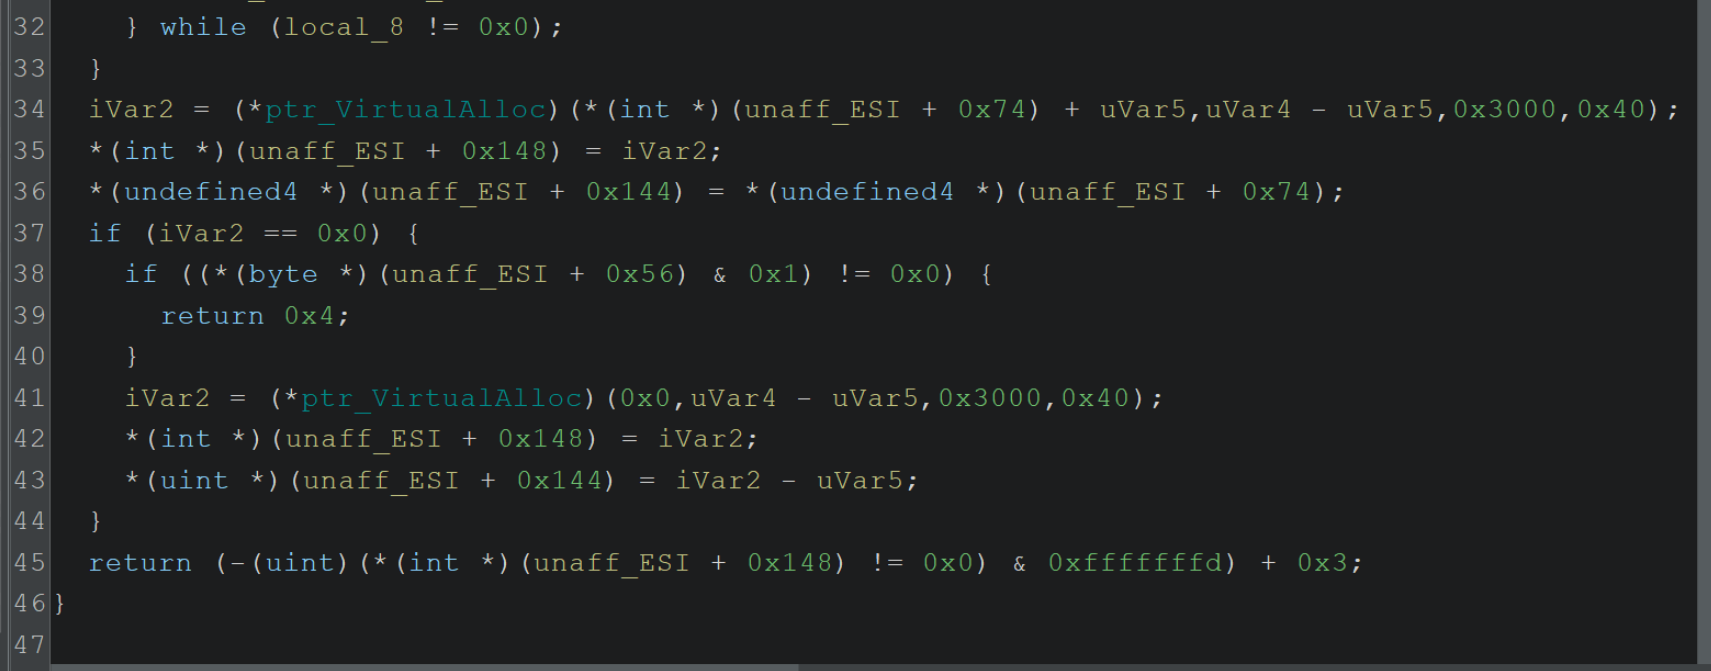
This process can be repeated until all points of interest have been labelled with appropriate values.
This is time-consuming if you wish to mark up an entire file, but it is effective and will reveal a significant portion of the files previously hidden functionality.
Once you're comfortable with performing this process manually, you can eventually create a script to do the same thing for you.
Creating a script will still require obtaining the decrypted strings through some means, but the process of renaming everything can be done well with a Ghidra script.
Conclusion
We have now looked at how to identify basic obfuscated strings, decrypt them, and fix their values within Ghidra.
Although this is a relatively simple example, the same overall process and workflows are repeatable across many many malware samples.
As you become more confident, many of these steps can be automated further or scripted. The renaming process can be replaced with a Ghidra script, and the "debugger" process can be replaced with scripted Emulation (Unicorn, Dumpulator etc).
Regardless, this blog demonstrates some core skills that are important for building the baseline skills to begin exploring future automation.
Sign up for Embee Research
Malware Analysis and Threat Intelligence Research
No spam. Unsubscribe anytime.