Ghidra

Deep-dive analysis of a packed Redline Stealer sample. Utilising manual analysis and semi-automated string decryption to extract C2 information and ultimately identify the malware.
In this write-up, I intentionally try to touch on as many concepts as possible in order to demonstrate practical applications and hopefully provide a better learning experience for the reader.
Note that I have now added a second post c0vering analysis of the C2 server from this sample.
Quick Caveat
I realized after the initial post that this sample is actually Amadey Bot. The analysis and RE techniques remain equally relevant, but the sample is not actually Redline as the title suggests :)
(There is a second file in the .cab which contains Redline Stealer, which may explain why the initial file was semi-incorrectly marked as Redline)
I was able to determine this by researching the decrypted strings that are detailed at the end of the post.
If you're interested in how to use decrypted strings to identify or confirm a malware family. Jump to the bonus section "Utilising Decrypted Strings To Identify the Malware Family" of this blog.
Link Sample
The initial file can be downloaded from Malware Bazaar with SHA256: . 449d9e29d49dea9697c9a84bb7cc68b50343014d9e14667875a83cade9adbc60
Analysis Summary
Feel free to jump to certain sections if you are already comfortable with some of these concepts.
- Saving the file and extracting the initial .exe
- Using Entropy to identify that the initial .exe is packed
- Using a debugger to manually unpack the first payload
- Initial analysis of the unpacked payload
- Identifying interesting strings and imports
- Static Analysis to establish the context of interesting strings and imports
- Utilising a debugger to analyse the String Decryption function
- Automating the String Decryption using X32dbg
- Utilising Decrypted strings to identify the malware family.
Actual Analysis
The analysis can kick off by downloading the above file and transferring it into a safe analysis machine. (I strongly recommend and personally use FLARE-VM for analysis)
The file can be extracted with the password infected.

After successful extraction - detect-it-easy can be used to perform an initial analysis of the file.
This reveals that the file is a 32-bit executable. Which, in this case, is actually a Microsoft Cabinet file.Microsoft Cabinet file This is essentially a .zip that can be executed as a .exe file.
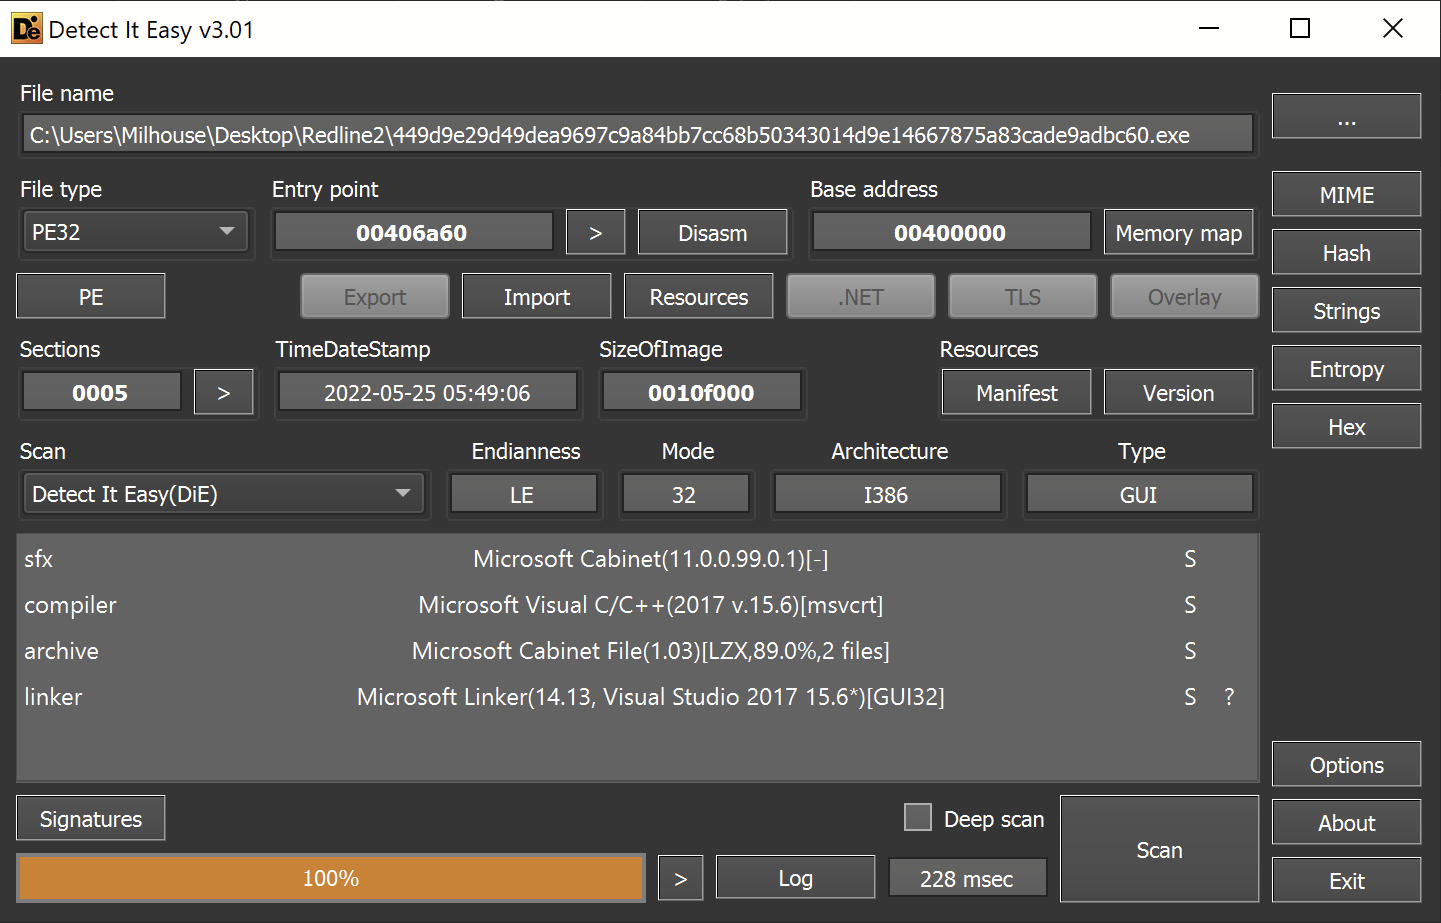
The file is similar enough to .zip that 7-zip is able to extract the contents of the file just like a regular zip file.
I was able to use 7zip to extract the contents, creating two new exes in the process. These are si684017.exe and un007241.exe in the screenshot below.
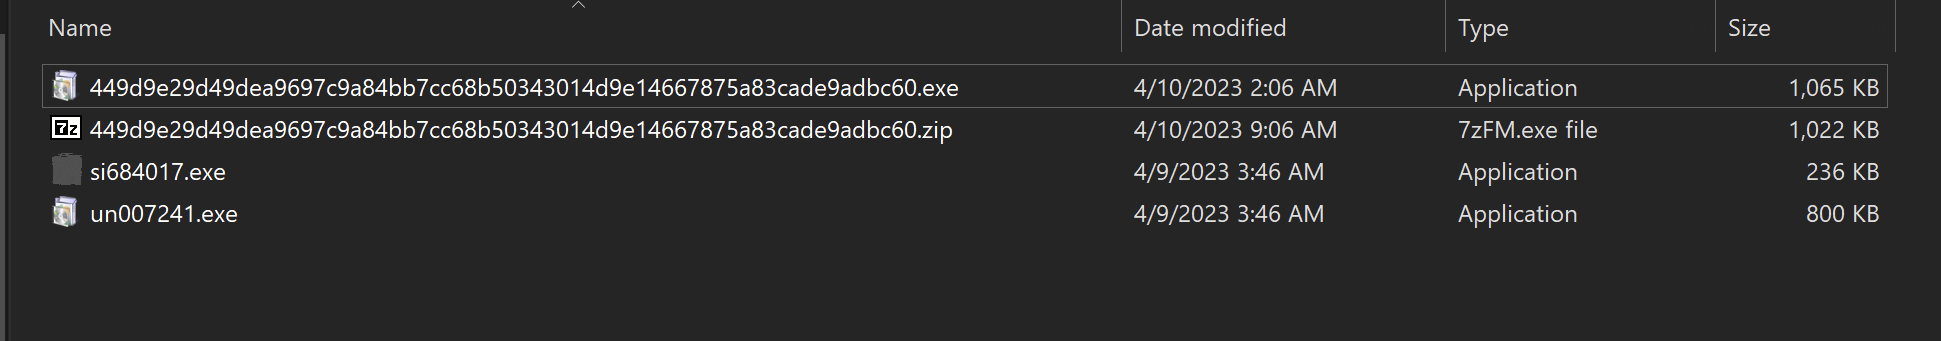
For now, I'll focus on the si684017.exe file.
Initial Executable File
The initial is file recognized as a 32-bit exe file by detect-it-easy.
Interestingly - it was not a .NET as most Infostealers generally are. This means that the usual DnSpy won't be applicable here.
(Check out my analysis of dcrat for tips on using Dnspy)
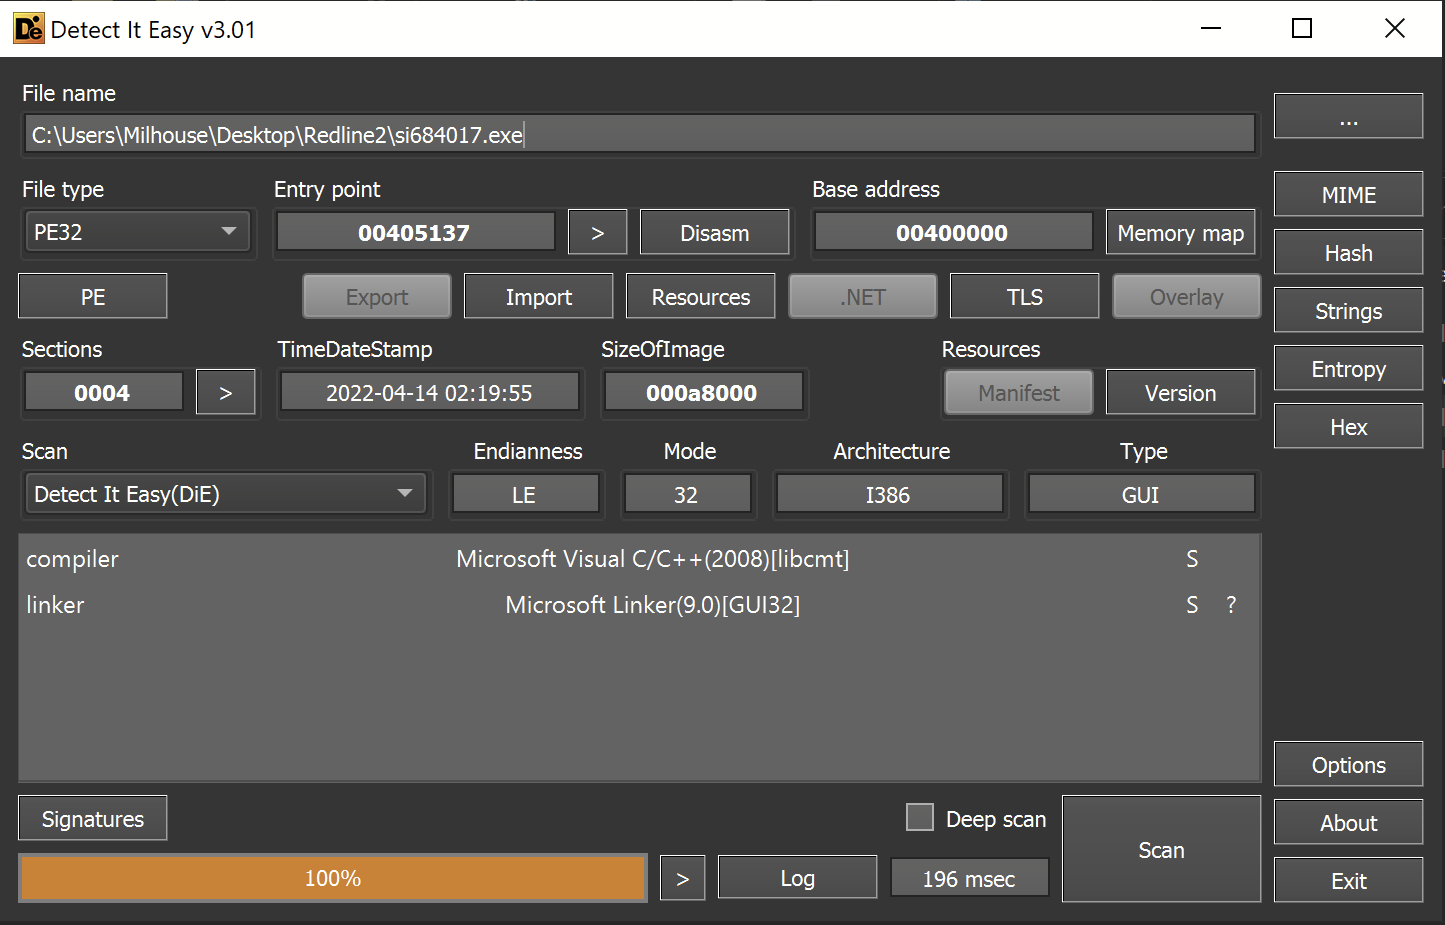
During initial analysis, I always want to determine if the file is potentially a packed loader rather than a final payload. If I have reason to suspect a packed payload, I typically focus on unpacking rather than strings or other static analysis.
A packed sample will typically contain areas of significantly high entropy.
To determine areas of entropy - I utilized the Entropy Graph feature within Detect-it-easy.
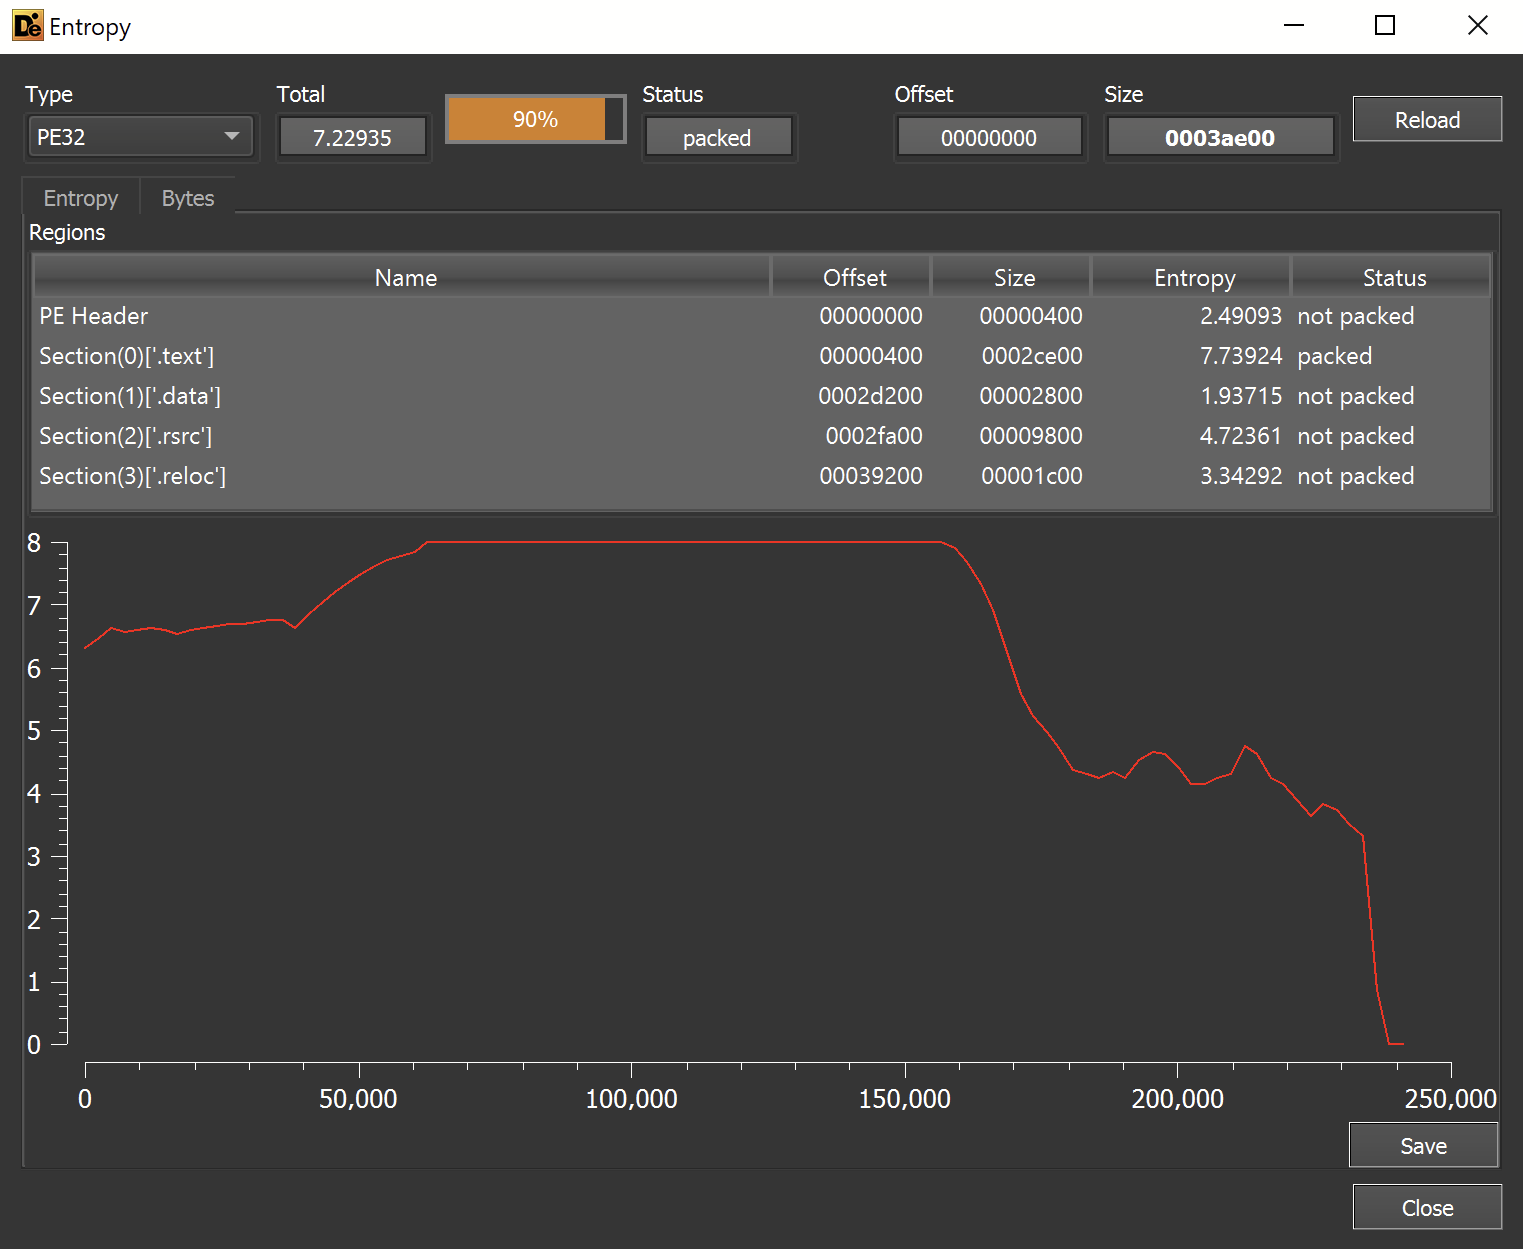
This revealed a very area of high entropy within the file. This is a strong indicator that the file is a packed loader and not the final payload.
In situations like this - I proceed to focus on unpacking the file.
Since this is a "regular" exe file and not a .NET-based file - I proceeded to unpack the file using X32dbg.
Unpacking Using X32dbg
When a standard loader unpacks a file, it typically uses a combination of VirtualAlloc , VirtualProtect and CreateThread. These functions allow the malware to allocate new sections of memory that can be used to store and execute the unpacked payload.
Advanced malware will heavily obfuscate these functions and/or avoid using them completely. But in 90% of cases - the previously mentioned functions are relevant.
(Check out my blog on API hashing for how this obfuscation can be done)
In most malware - We can set breakpoints on the VirtualAlloc and VirtualProtect function calls and monitor the results using Hardware Breakpoints . This will alert when the newly allocated buffer is accessed, from there it is generally simple to obtain the decoded payload.
To summarise this:
- Identify a Function of Interest (In this case
VirtualAlloc) - Create a breakpoint to monitor
VirtualAlloc - Obtain the Memory Buffer created by
VirtualAlloc - Use a
Hardware Breakpoint- to alert when the new memory buffer is accessed - Allow the malware to execute until the buffer is filled
- Save the buffer to a file
I've previously written a thread on how to use Hardware Breakpoints to unpack Cobalt Strike Loaders. You can check it out here.
Loading the File into X32dbg
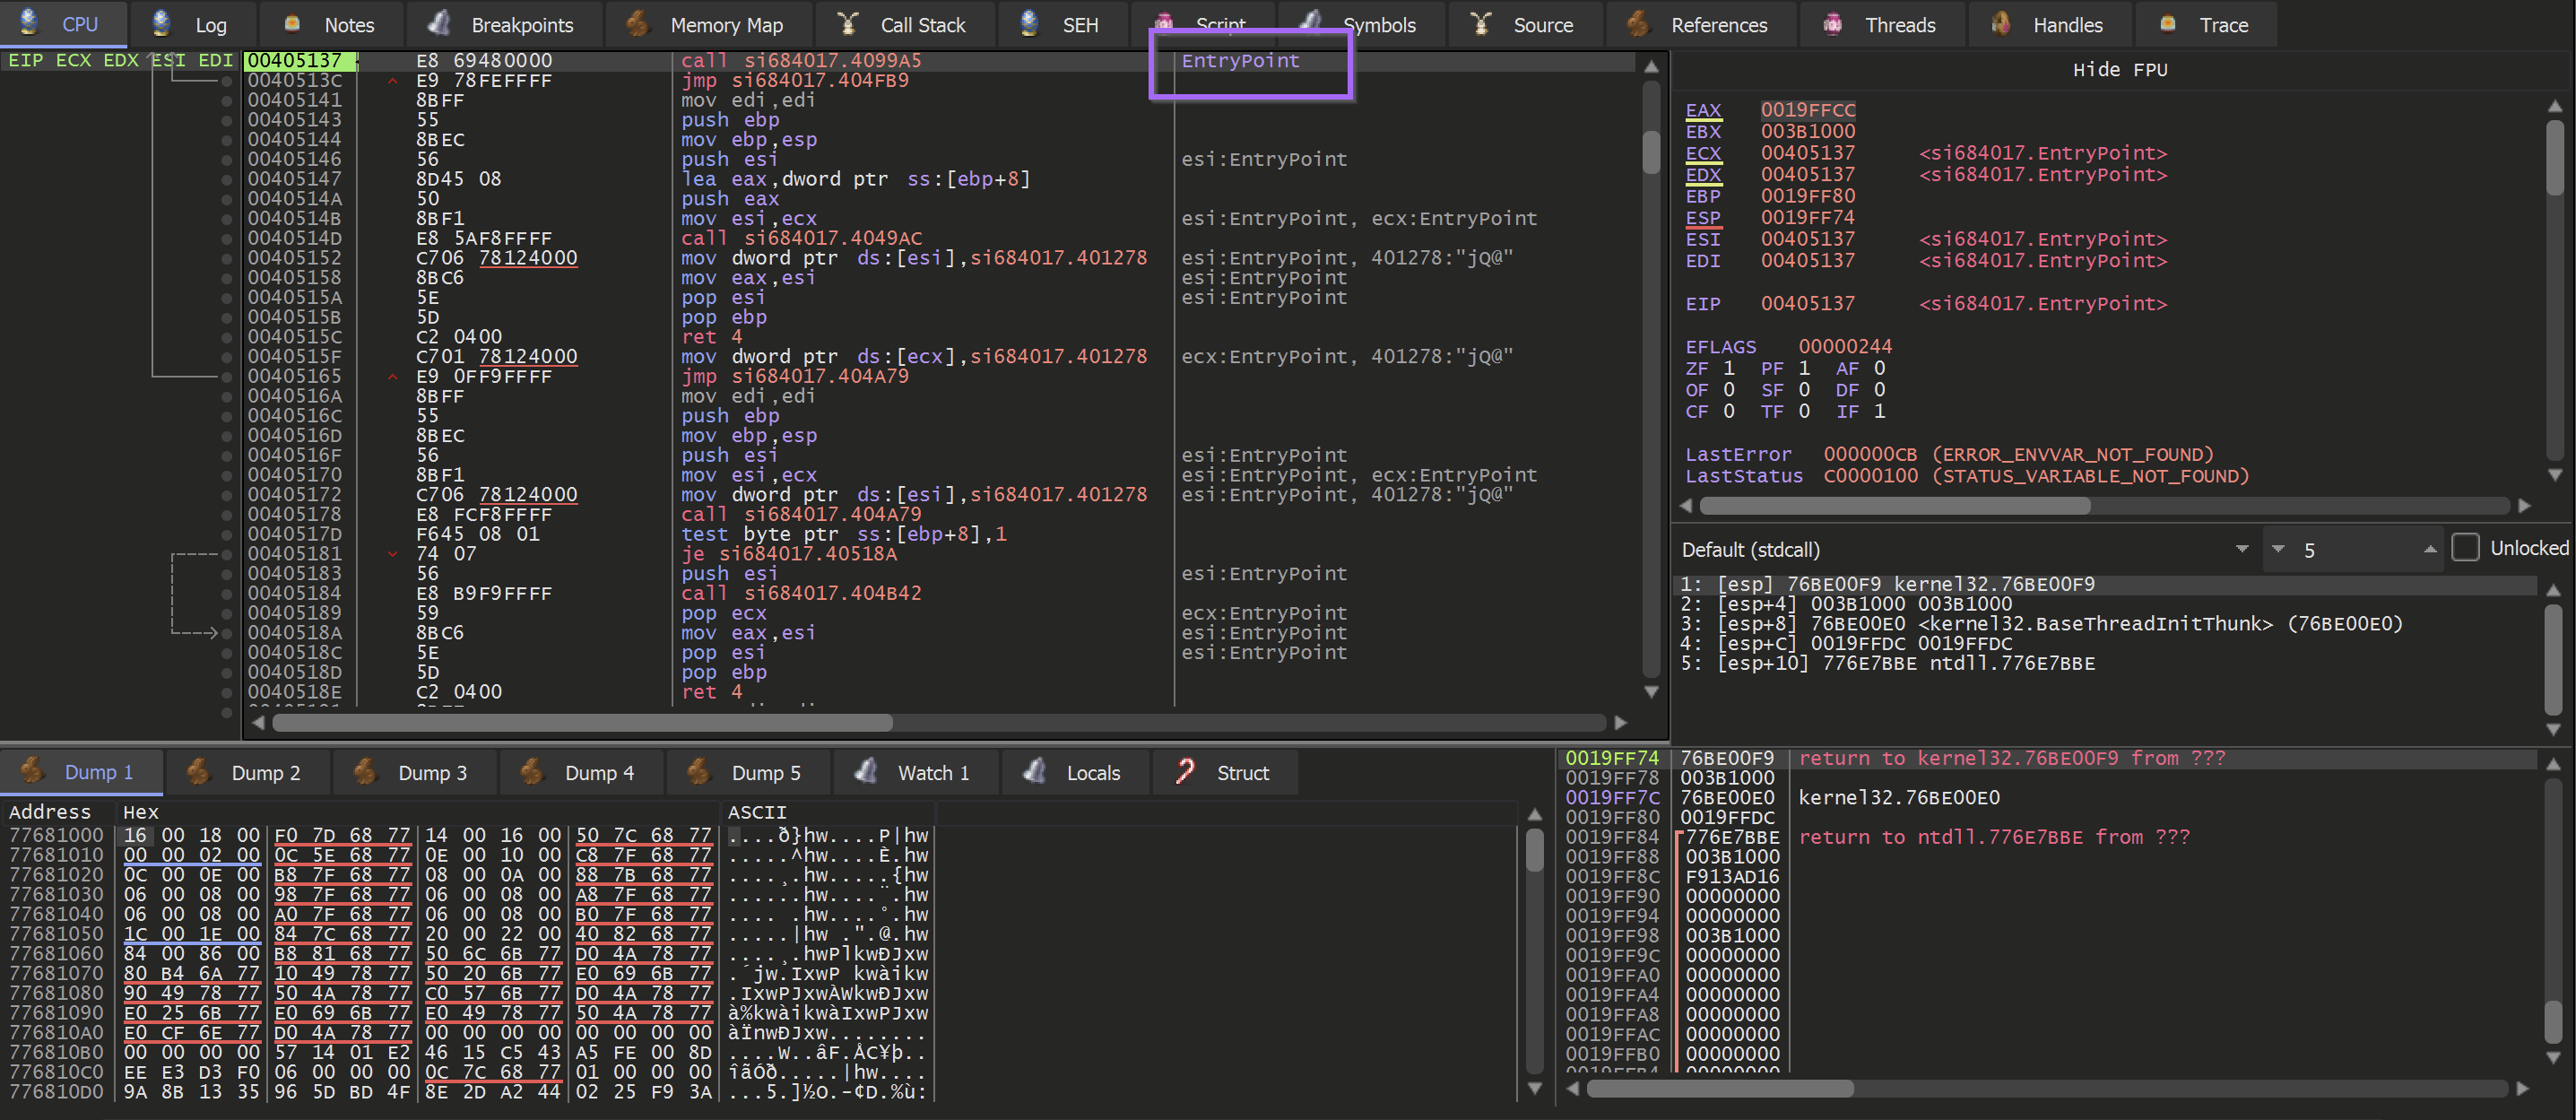
To initiate this process - I dragged the file into a debugger (x32dbg) and allowed the file to execute until the Entry Point. This can be done by loading the file and once clicking the F9 button.
Creating The Breakpoints
Breakpoints were then required in order to inspect the appropriate VirtualAlloc function.
Note that in this case - the primary interest is in the output (or return value) of VirtualAlloc. The relevance of this is that we care about the data at the "end" of the breakpoint, and not at the moment where the breakpoint is hit. If that's confusing then let's just see it in action (it's always confusing the first dozen times)
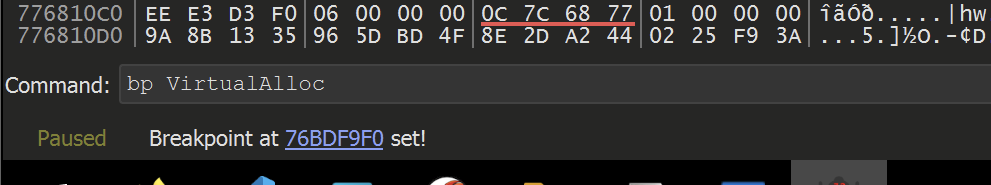
Set two breakpoints using the following commands
bp VirtualAlloc , bp VirtualProtect
Hit F9 (Continue) again, allowing the malware to execute until a breakpoint is hit.
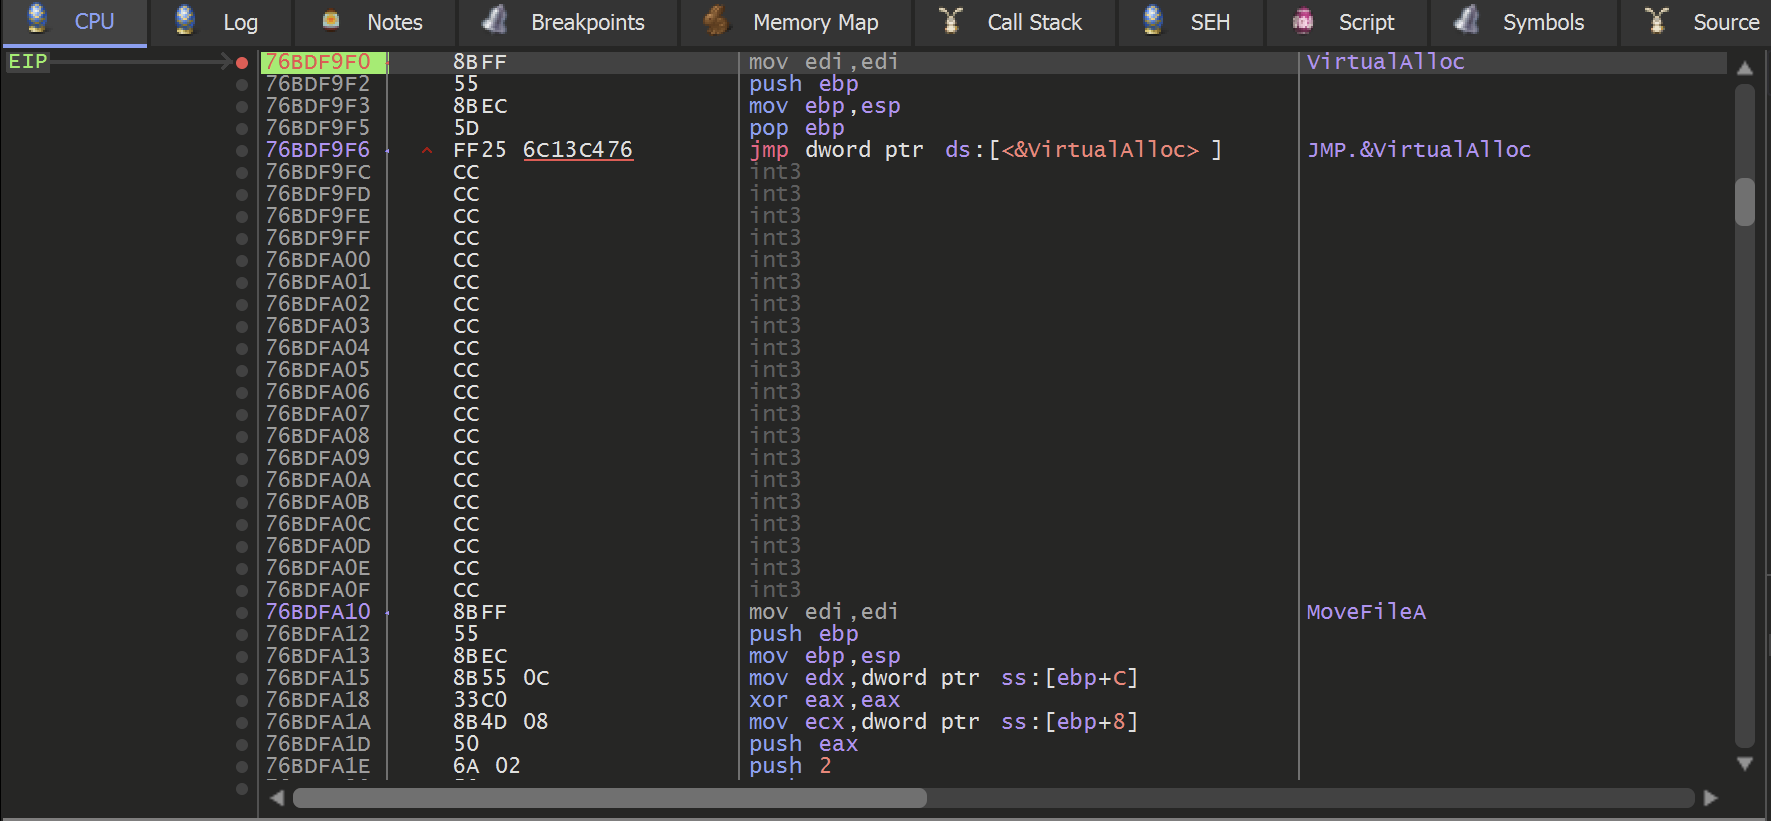
A breakpoint is immediately hit on the VirtualAlloc function
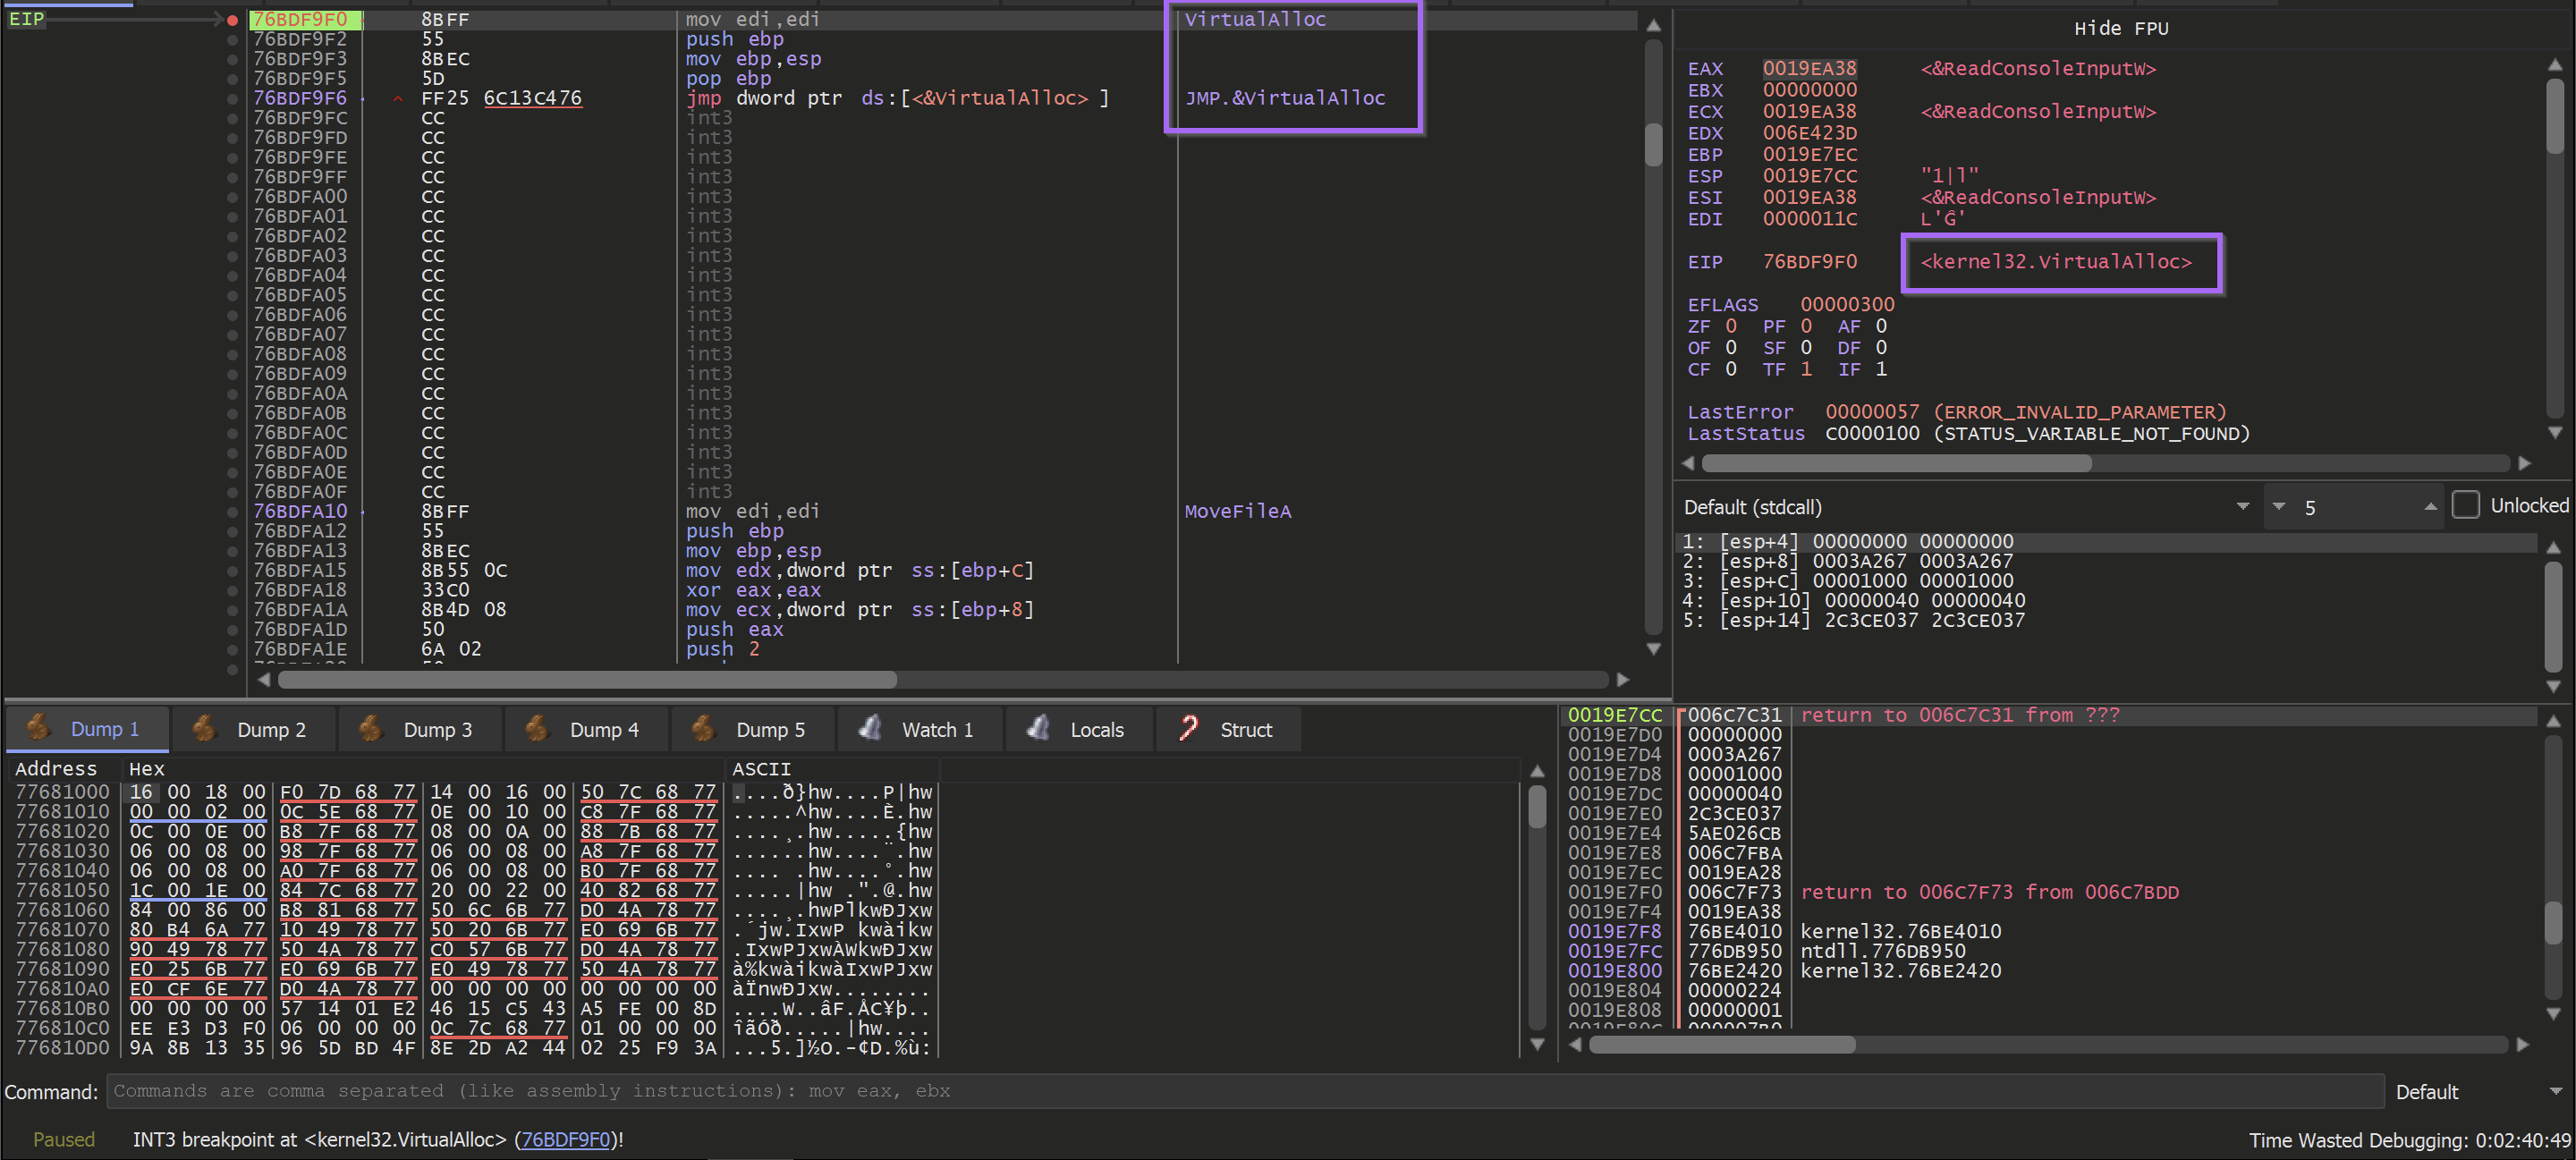
The primary purpose of VirtualAlloc is to allocate memory and return an address to the newly allocated buffer. This newly allocated memory is contained in the EAX register when the function is completed.
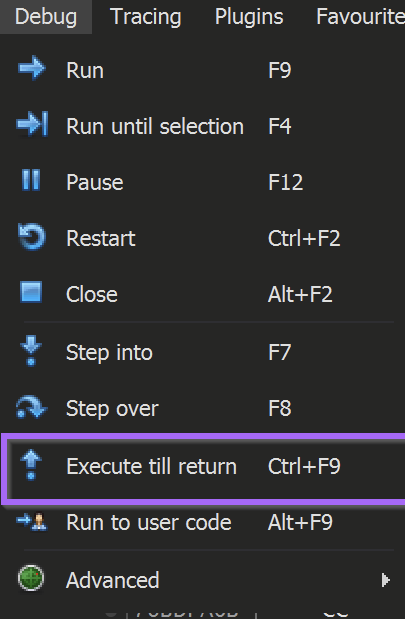
TLDR: Since I'm only interested in that buffer - I utilized the Execute Until Return or CTRL+F9 to jump straight to the end of the function and obtain the result.
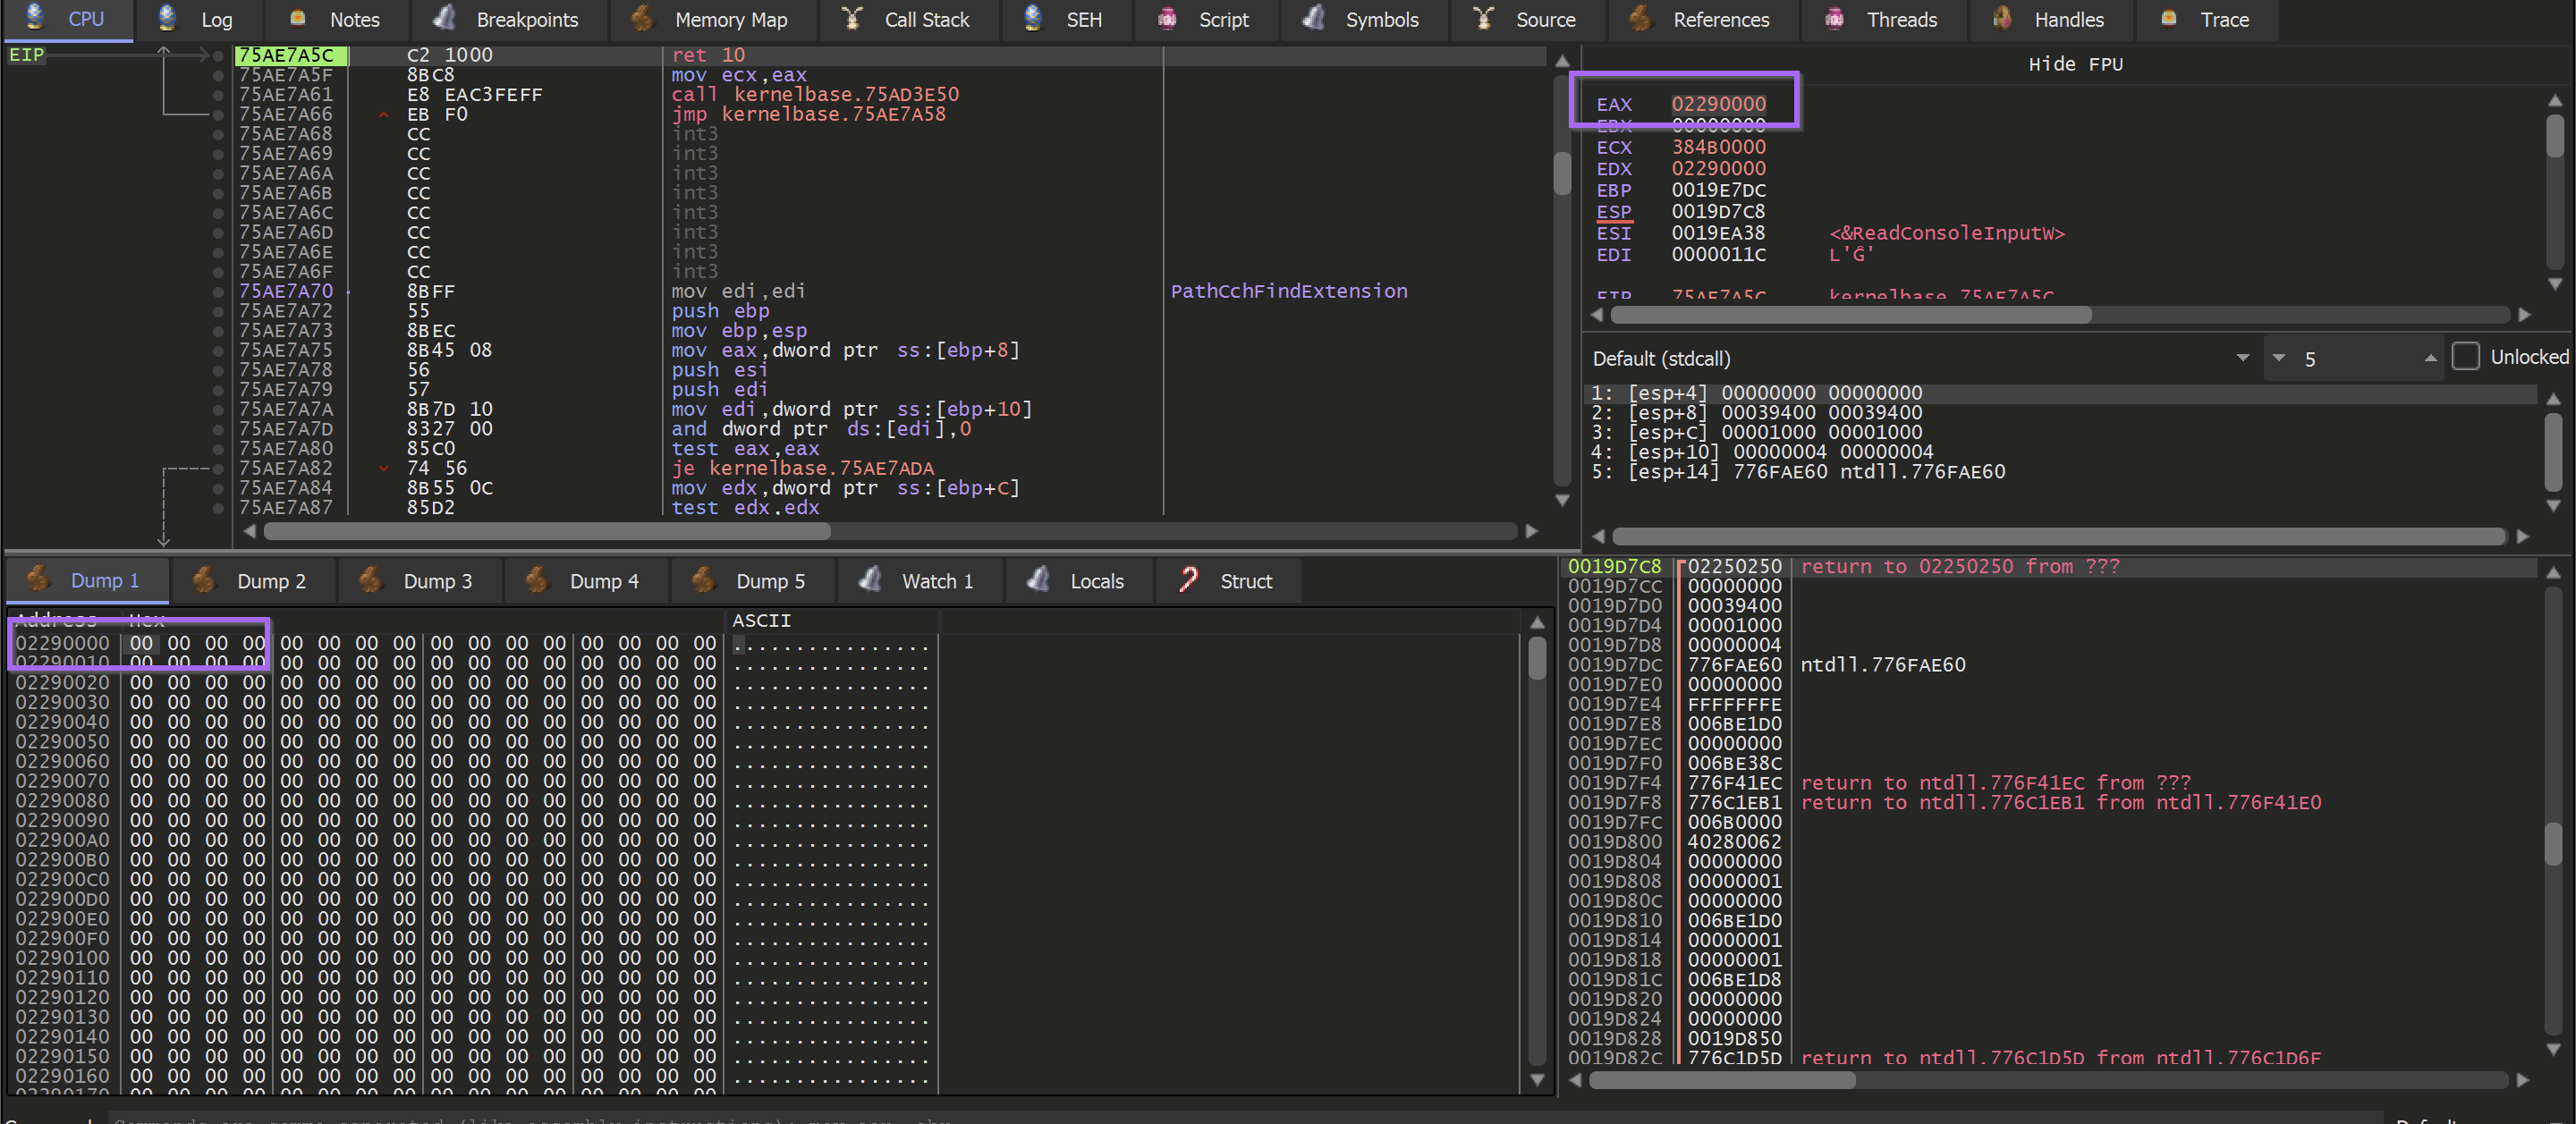
Allowing the malware to Execute Until Return - provides an EAX register containing the address of the memory buffer to be used by the malware.
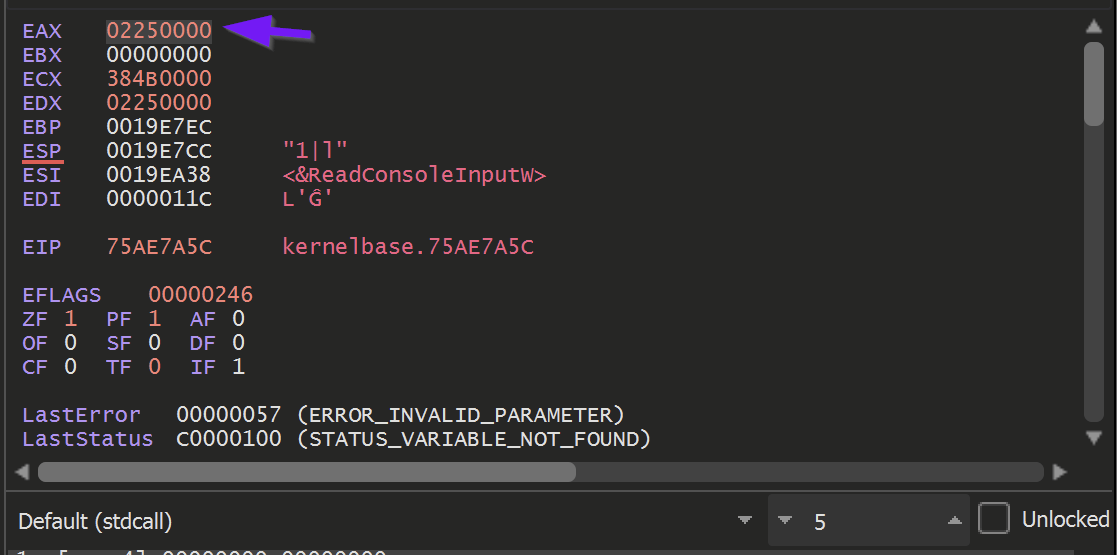
There is nothing particularly special about EAX, it is just the standard register used for returning the results of a function.
To learn more aboutEAXand calling conventions - there's a great video on that from OALABS.
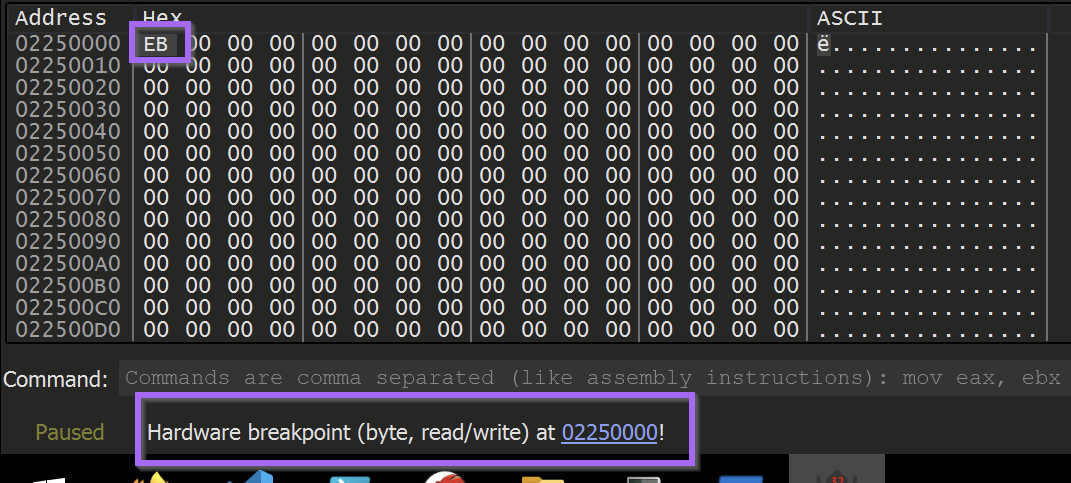
To monitor the buffer returned by VirtualAlloc, Right-click on the returned address 02250000 address and select Follow in Dump.
This will cause the bottom-left window to display the newly allocated memory.
The buffer of memory currently contains all 00's, as nothing has been used or written to the buffer yet.
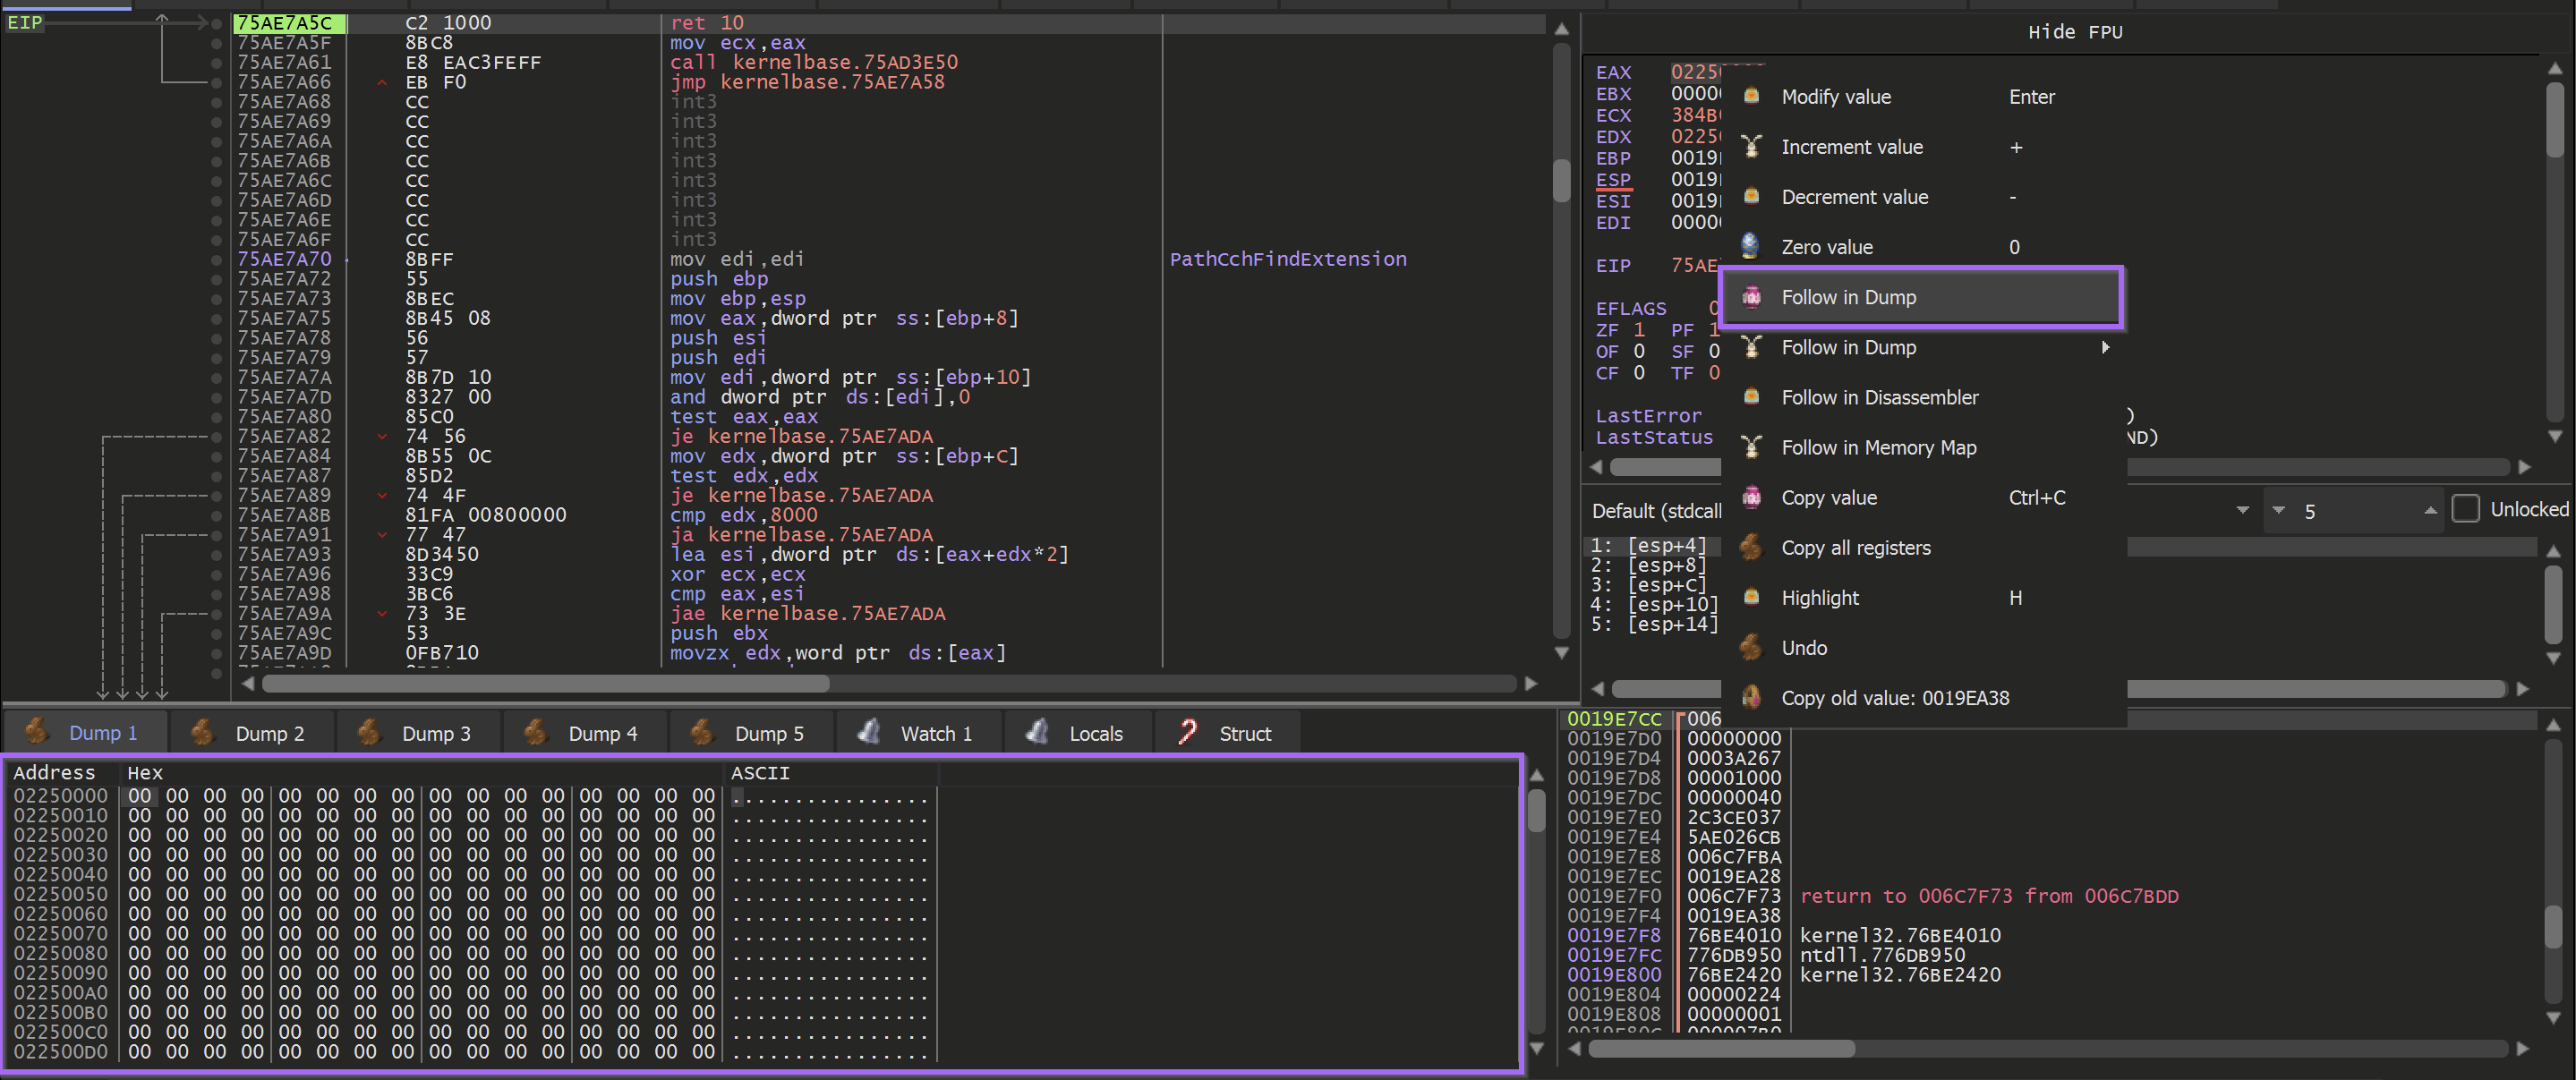
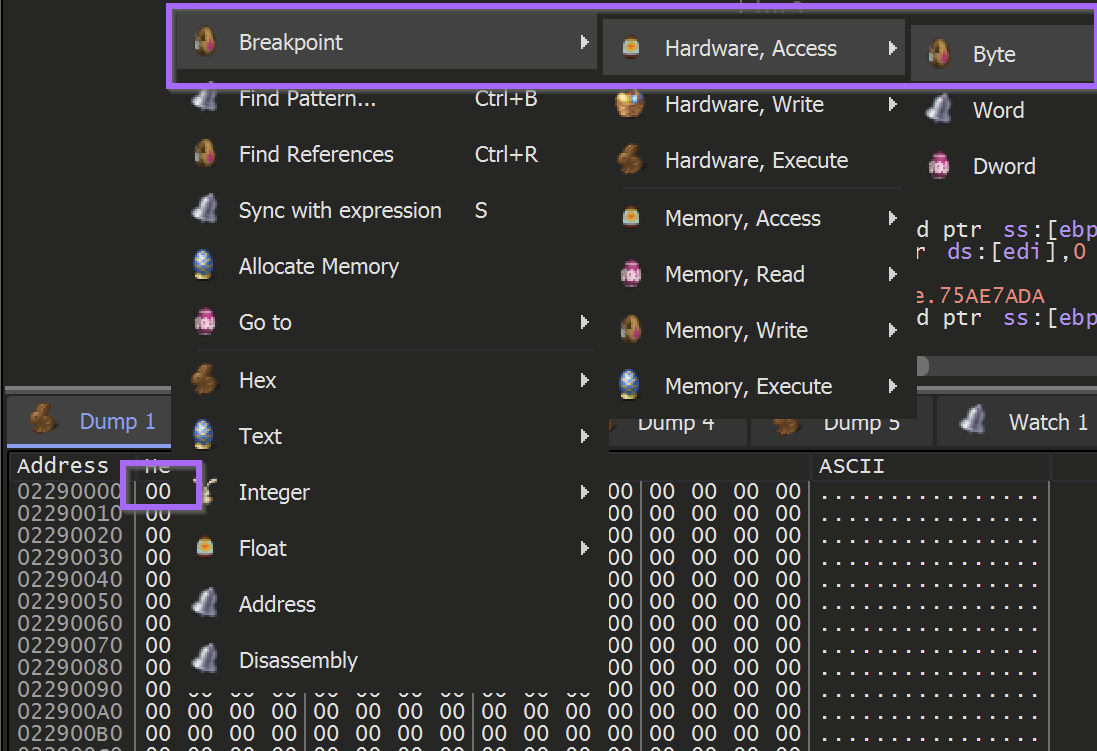
It is important to be notified when that buffer of 00's is no longer a buffer of 00's.
To achieve this - A hardware breakpoint can be applied on the first byte of the newly allocated buffer.
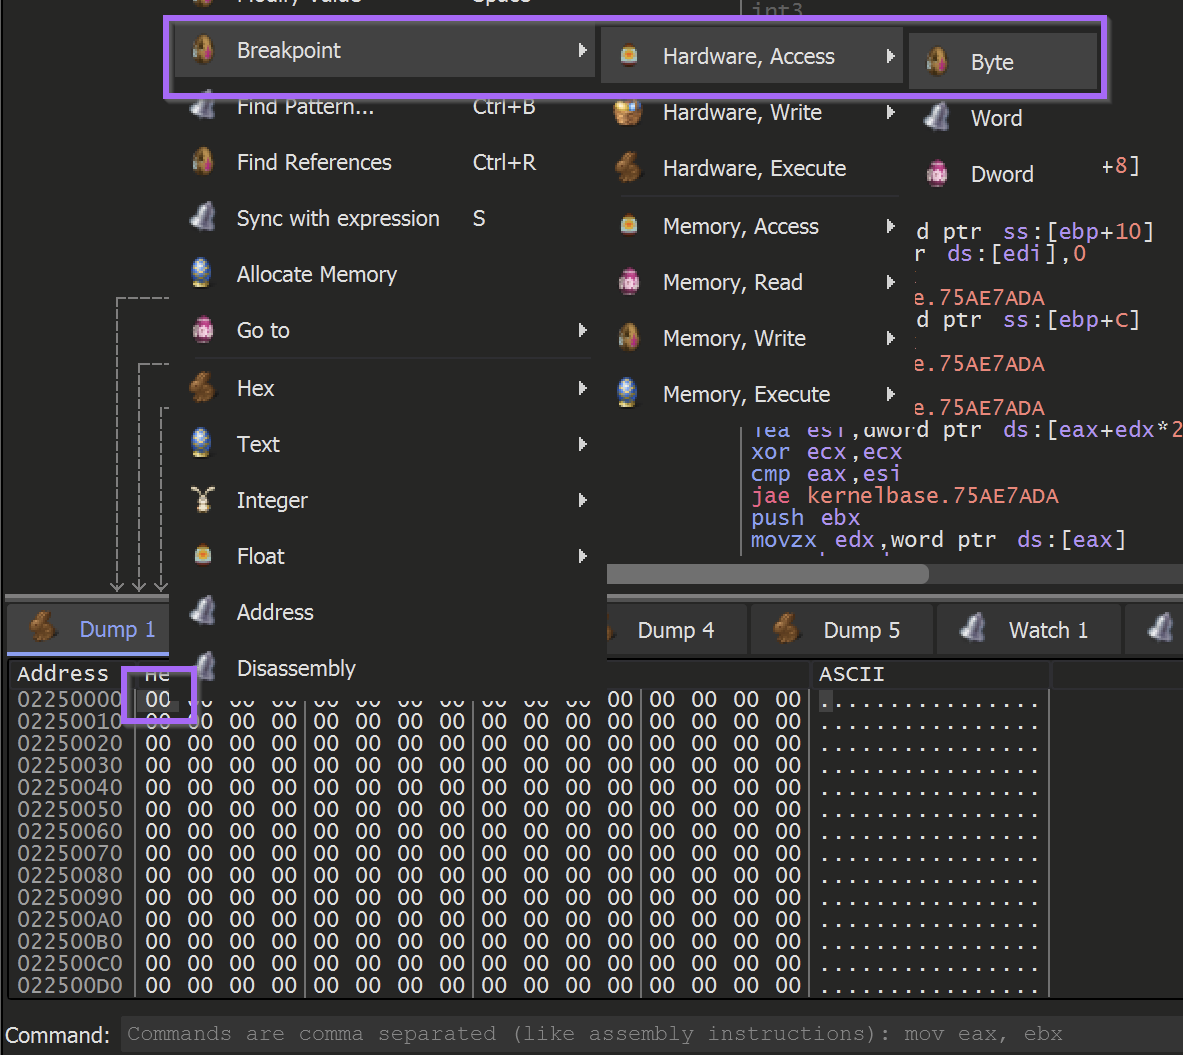
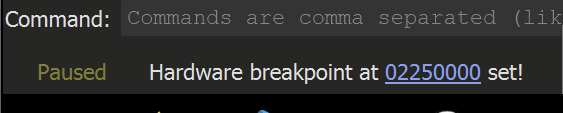
Once the hardware breakpoint is set - the malware can continue to execute using the F9 button.
The Hardware Breakpoint will immediately be triggered.
Once this happens, use CTRL+F9 (Execute Until Return, aka "just finish what you're doing now, but don't do anything else") to allow the malware to continue writing to the buffer without actually executing it.
(Utilising CTRL+F9 will cause the malware to stop at the end of the current function - preventing the execution of the rest of the malware)
Once the current function is finished - the buffer will look something like this.
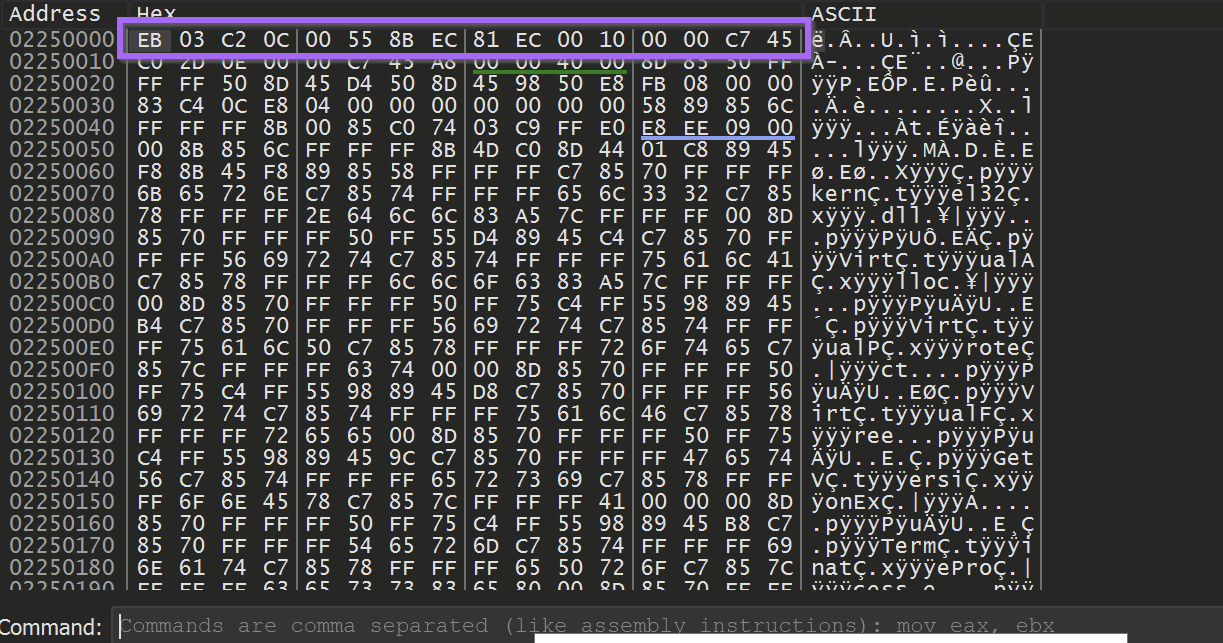
Unfortunately - the first buffer does not contain an unpacked PE file. It does contain a large buffer of shellcode which is used to unpack the next section using another VirtualAlloc.
If the file was successfully unpacked - it would typically look something more akin to this
In this case, there is only shellcode in the buffer. You can typically determine that the buffer is shellcode by the presence of the EB (jmp) byte. You can also confirm the suspected shellcode by inspecting the instructions using Right-Click -> Follow in Disassembler.
If the code disassembles without errors (No glaring red sections) - it is highly likely to be shellcode.
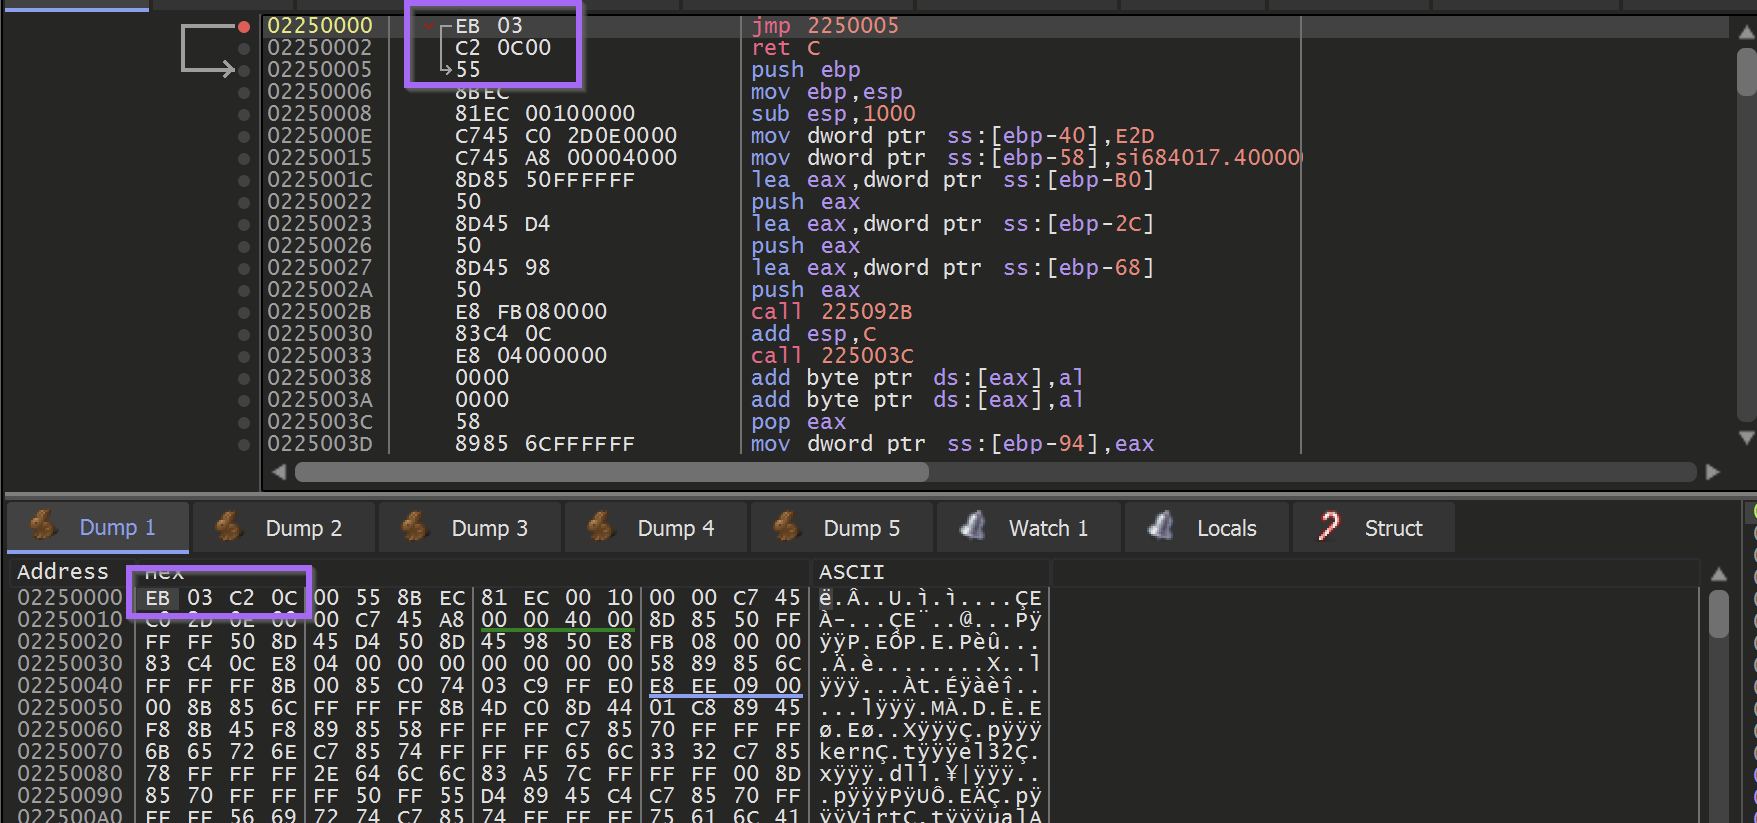
At this stage - the shellcode could be dumped into a file for further analysis.
However, it is often better to allow the shellcode to execute. The malicious actions taken by the shellcode will often trigger the same breakpoints intended for the "original" malware.
Obtaining The Unpacked Payload
Hitting F9 (Continue) to allow the malware to execute - another breakpoint is hit on VirtualAlloc
Using the same trick of Execute Until Return , Select EAX and Right-Click -> Follow in Dump, the second allocated buffer can be obtained.
Another Hardware Breakpoint will need to be set at the start of the buffer.
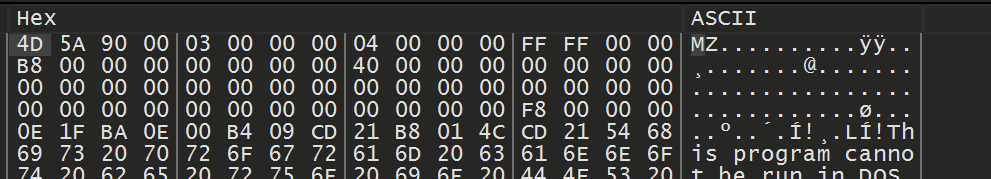
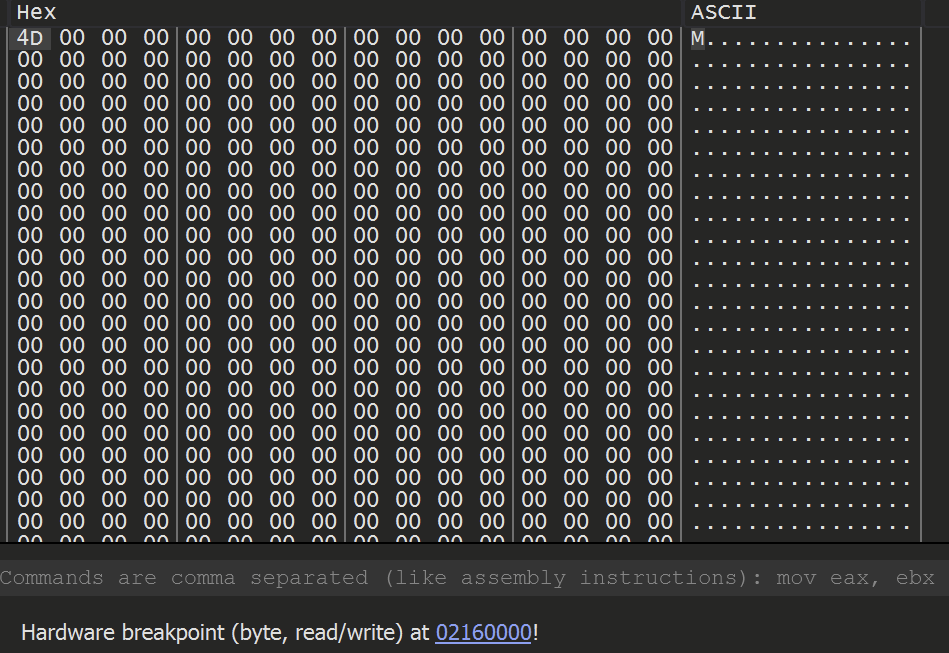
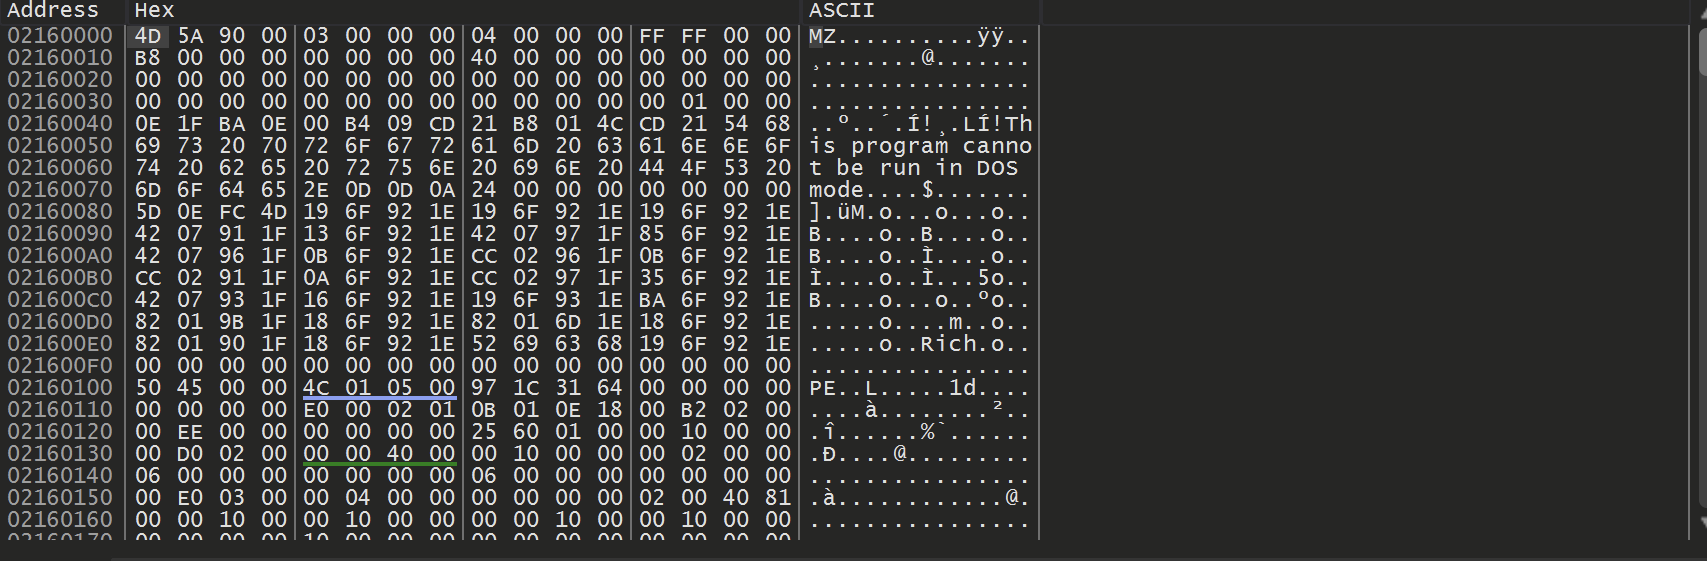
Allowing the malware to continue to execute - the hardware breakpoint is hit. This time containing a promising M. (First half on an MZ header)
(Side note that my debugger suddenly crashed here and had to be restarted - hence the slight change of address in future screenshots)
Allowing the malware to continue to execute - A complete MZ/PE file can be found. At this point, the unpacked file has been successfully loaded into memory.
Saving the Unpacked File
To save the unpacked file - Right-Click on the start address and select Follow in Memory Map
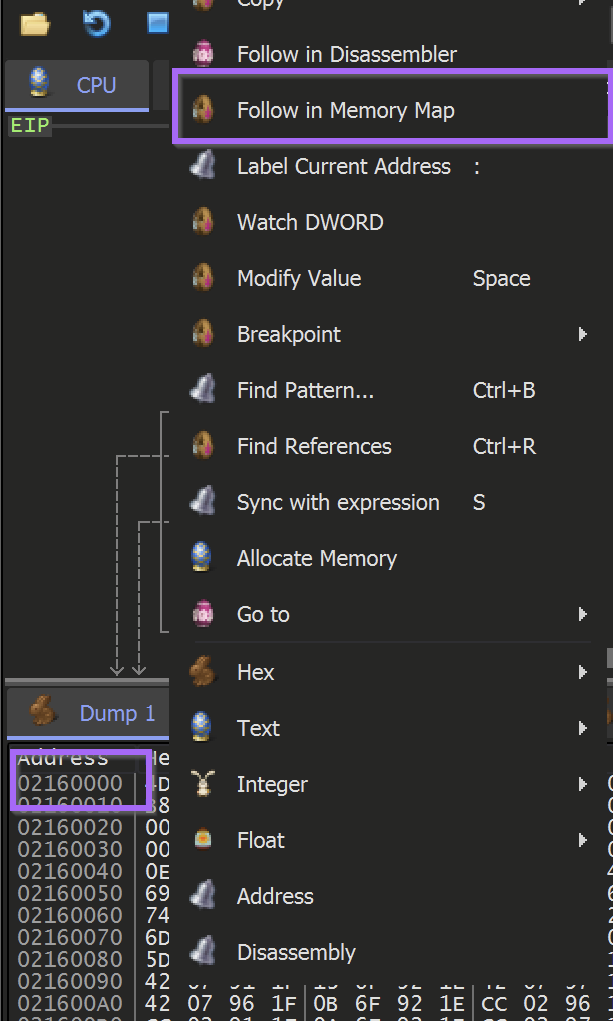
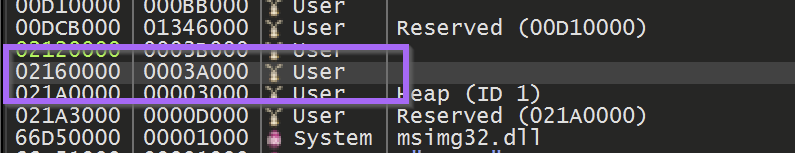
This will reveal the location where the buffer was allocated. The entire memory buffer can then be saved by using Right-Click and Dump Memory to File
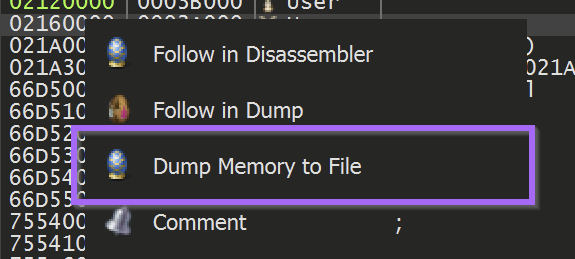
The file can now be saved as unpacked.bin (or any other file name of choosing)
Initial Analysis - Unpacked Payload
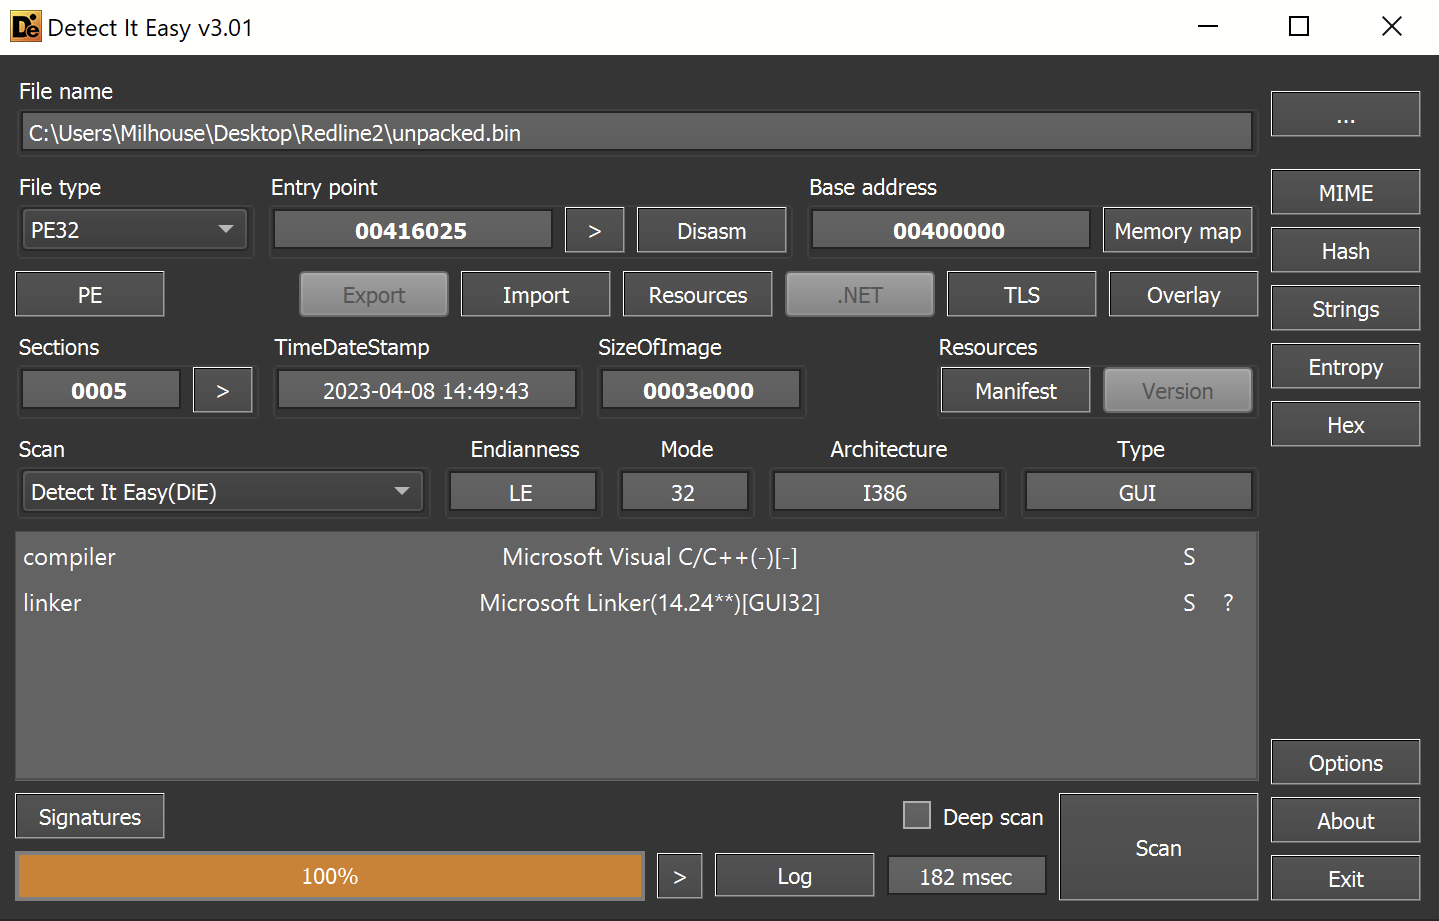
The file is a 32-bit executable with no (recognized) packers or obfuscation.
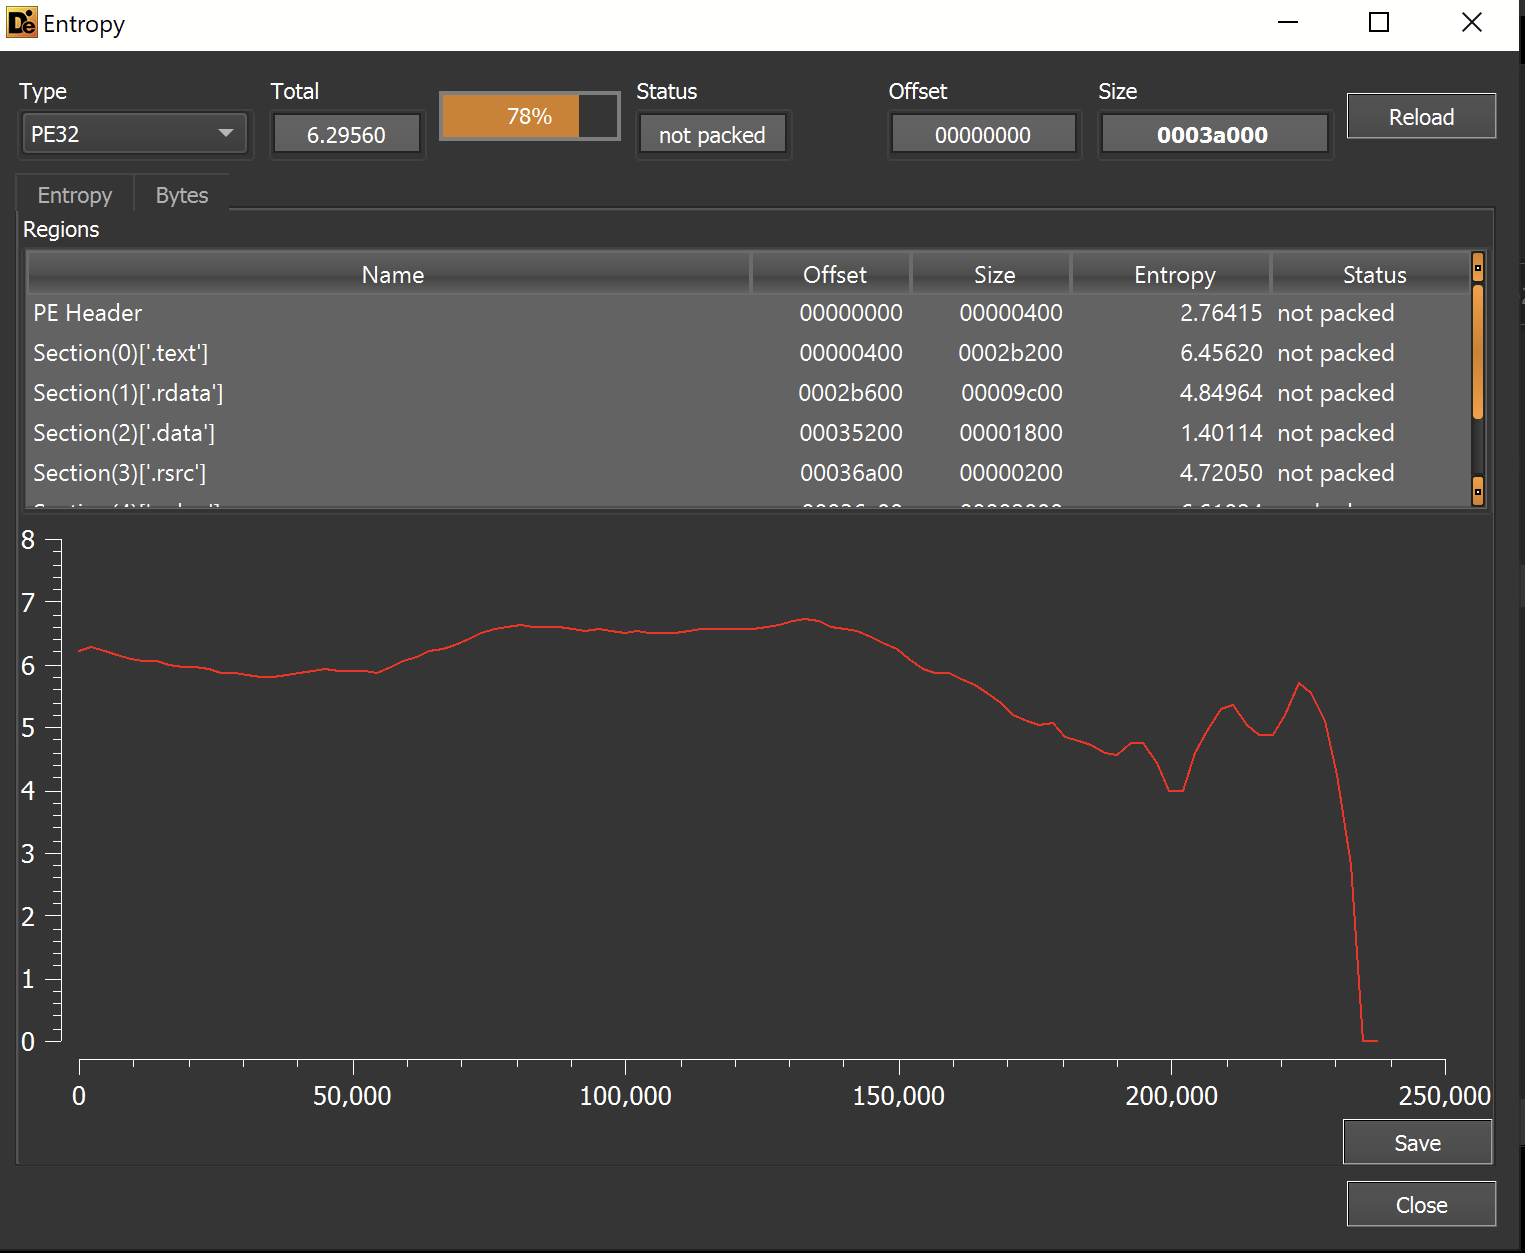
The entropy graph does not contain any areas of significantly high or flat entropy - suggesting that the file is not packed and does not contain any additional payloads.
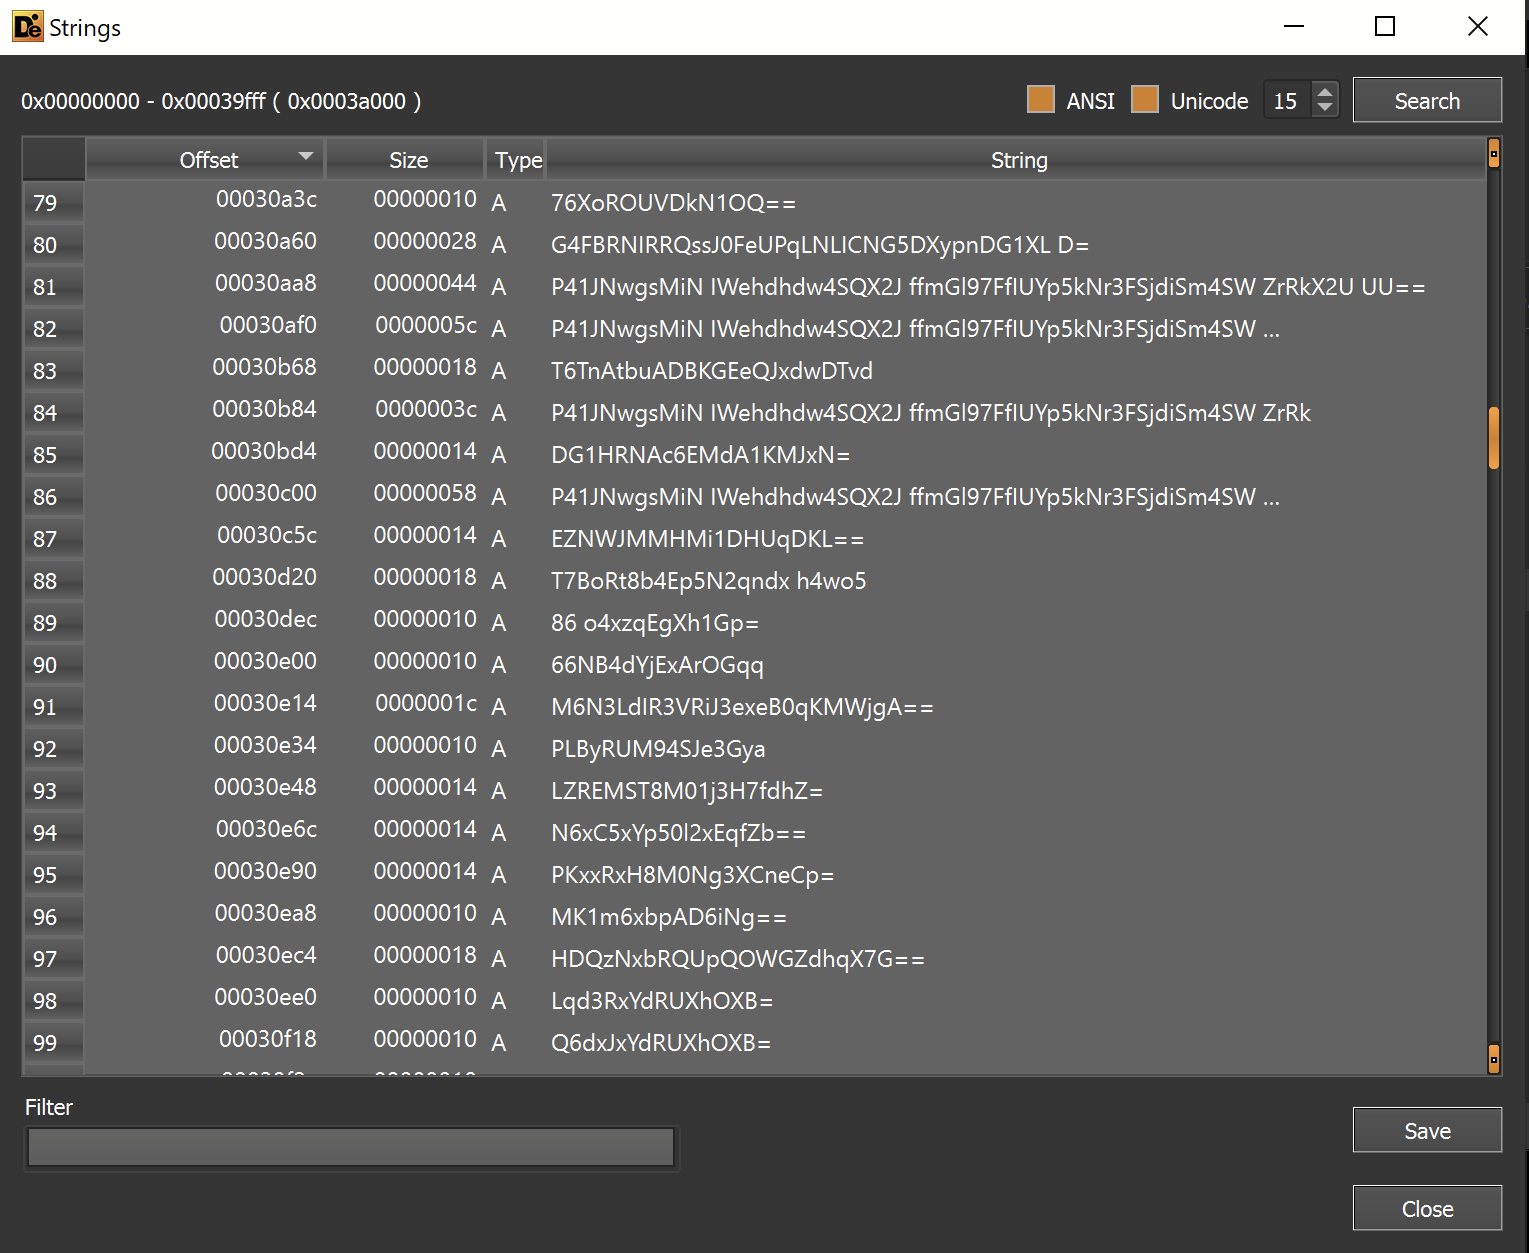
Since this was potentially a final payload - I checked the strings for any unobfuscated information.
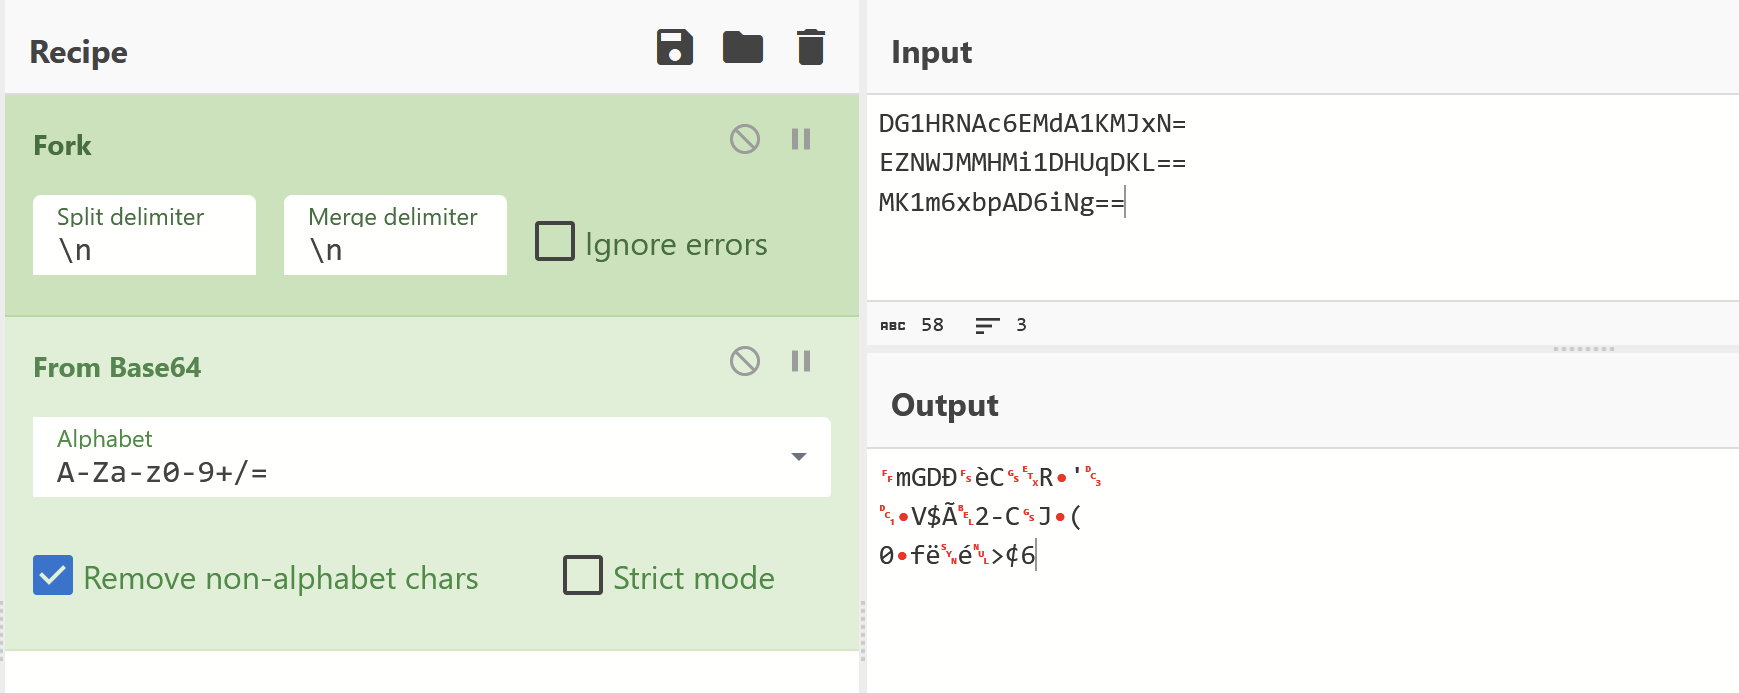
This revealed some base64 encoded data - but I wasn't able to successfully decode it.
The base64 encoding has likely been combined with additional obfuscation.
Failing to decode the "base64"
Import Analysis
Imported functions are an additional valuable source of information. Especially for suspected unpacked files.
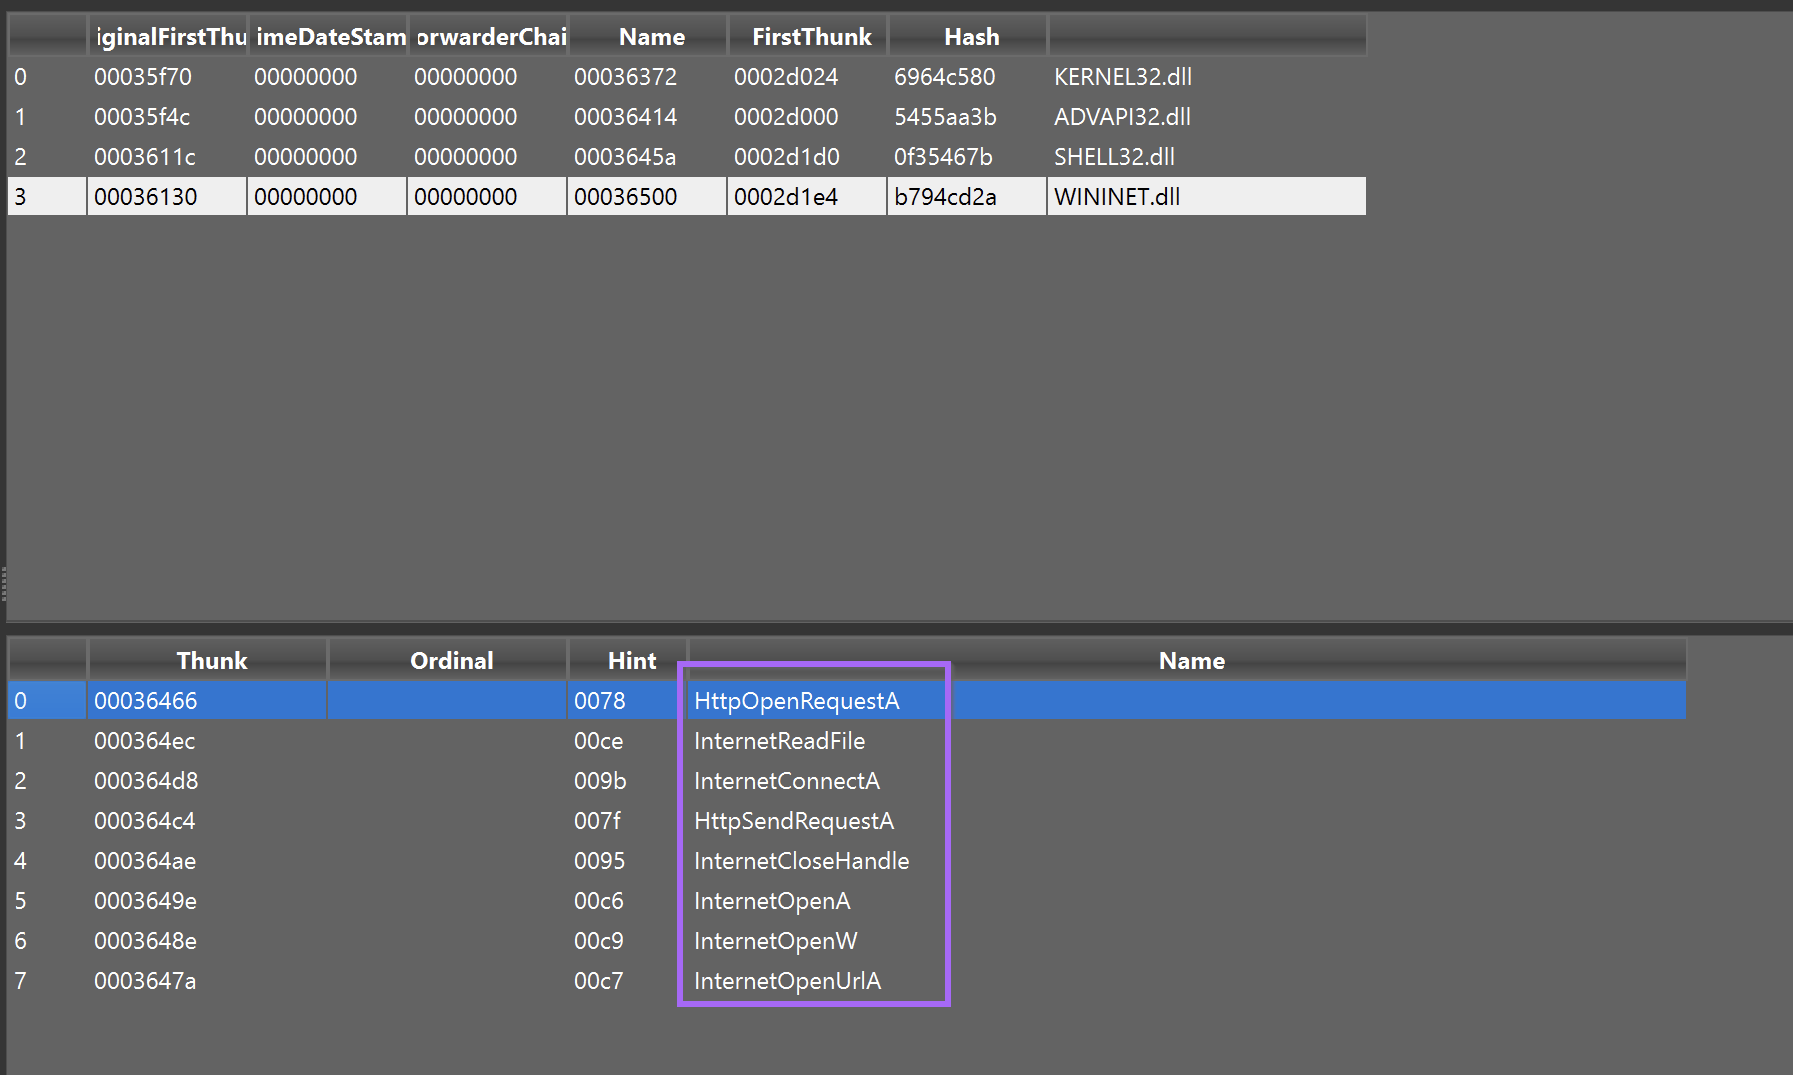
The imported functions referenced capability that suggested the file can download data and make internet connections.
Since these functions need C2 information in order to work, this is a good sign that the C2 config may be contained within this file.
Ghidra Analysis
At this point, I decided to analyze the file further using Ghidra. My plan was to utilise Ghidra to gather more information on the suspicious imports related to c2 connections InternetReadFile, InternetConnectA, HttpSendRequestA etc.
In addition to this - I wanted to investigate the suspicious "base64" strings identified with detect-it-easy.
To investigate both - I intended to utilise cross references or X-refs to observe where the strings and imports were used throughout the code. From here I hoped to find arguments passed to the internet functions (hopefully containing a C2), or to find the logic behind the function that accesses the base64 encoded strings.
To Summarise - My plan was to Utilise Ghidra to...
- Investigate the suspicious strings - which function are they passed to? what does that function do with them? Can I trace the input and output of that function?
- Investigate Suspicious Imports - Check where the imports were used, and what arguments were being passed. Can I set a breakpoint and view the decrypted C2s?
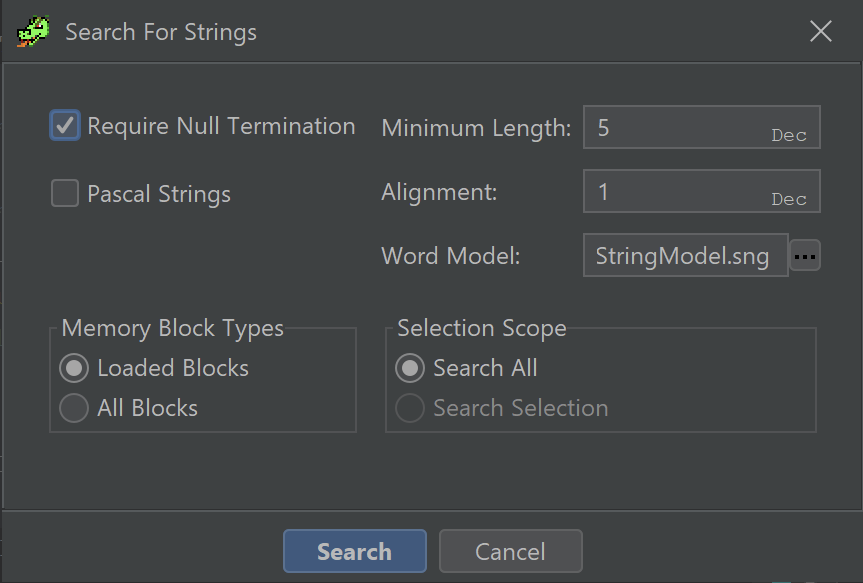
String Searching with Ghidra
I took the first approach first, using Ghidra to search for strings within the file.
By filtering on ==, I was quickly able to narrow the results down to the previously identified base64 strings. This was not all relevant strings, but it was a solid starting point.
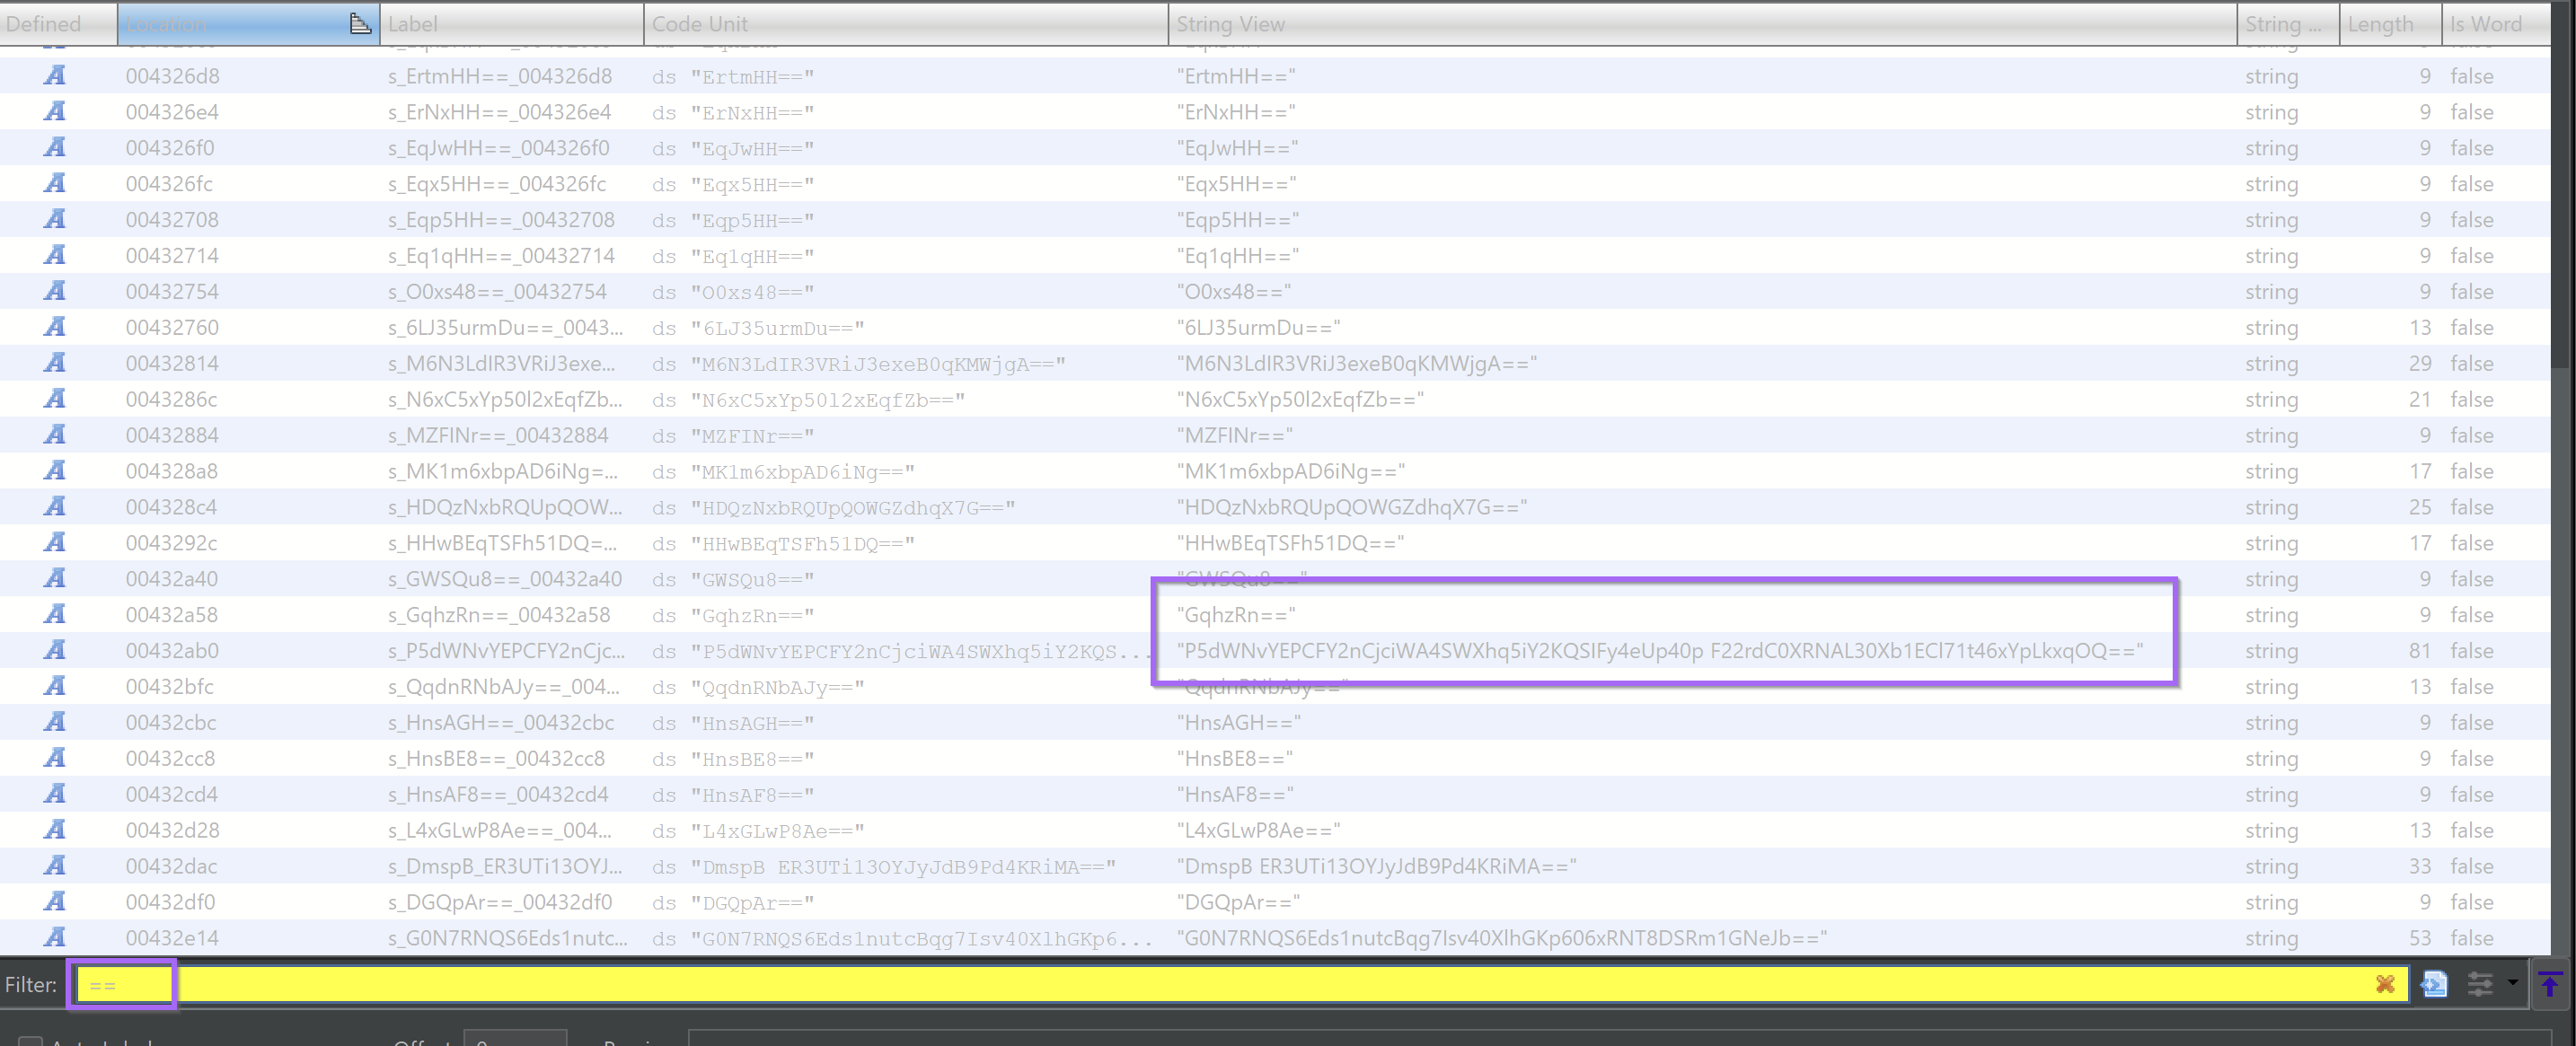
I double-clicked on one of the larger strings, taking me to its reference within the file.

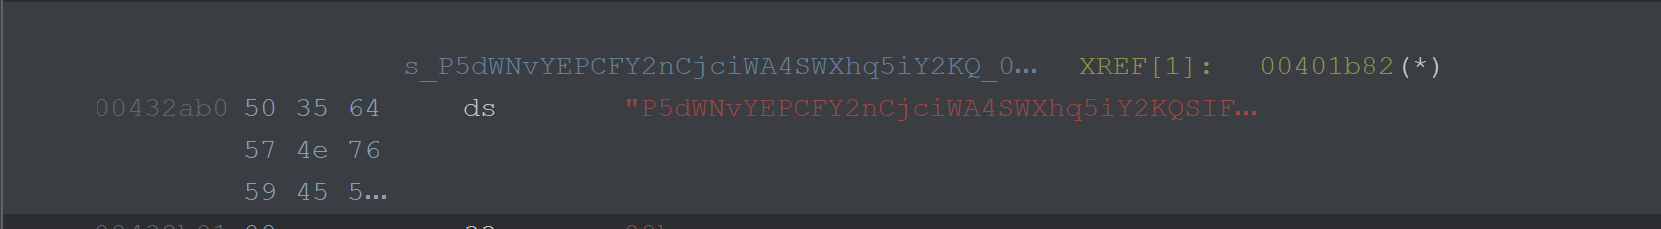
From here I could hit CTRL+SHIFT+F to find references to this string. Alternatively, you could Right Click -> References -> Show References to Address
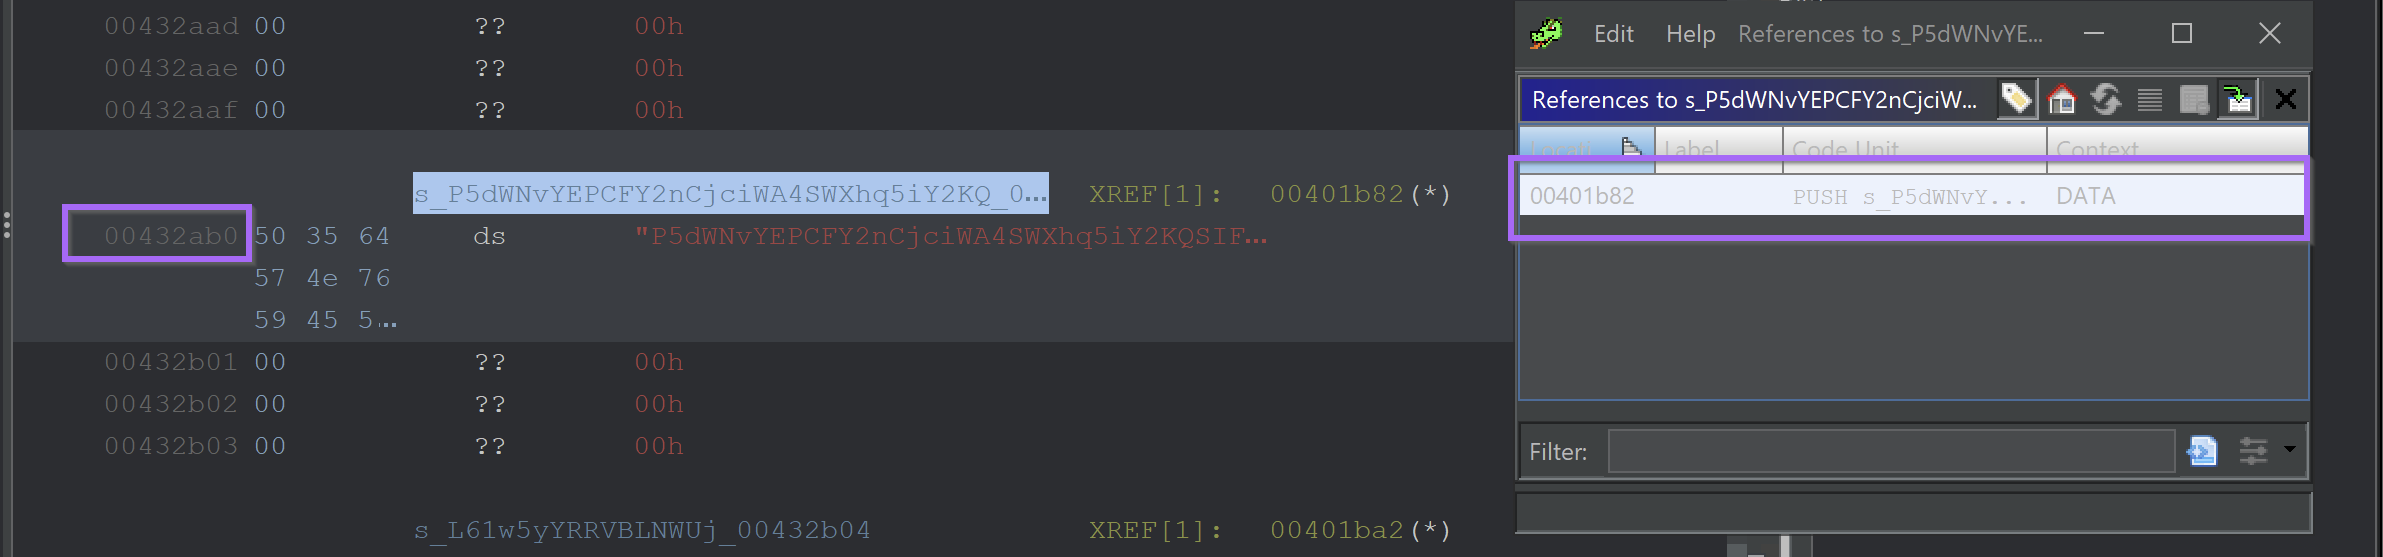
Clicking on the one available reference - reveals an undefined function acting upon the string.
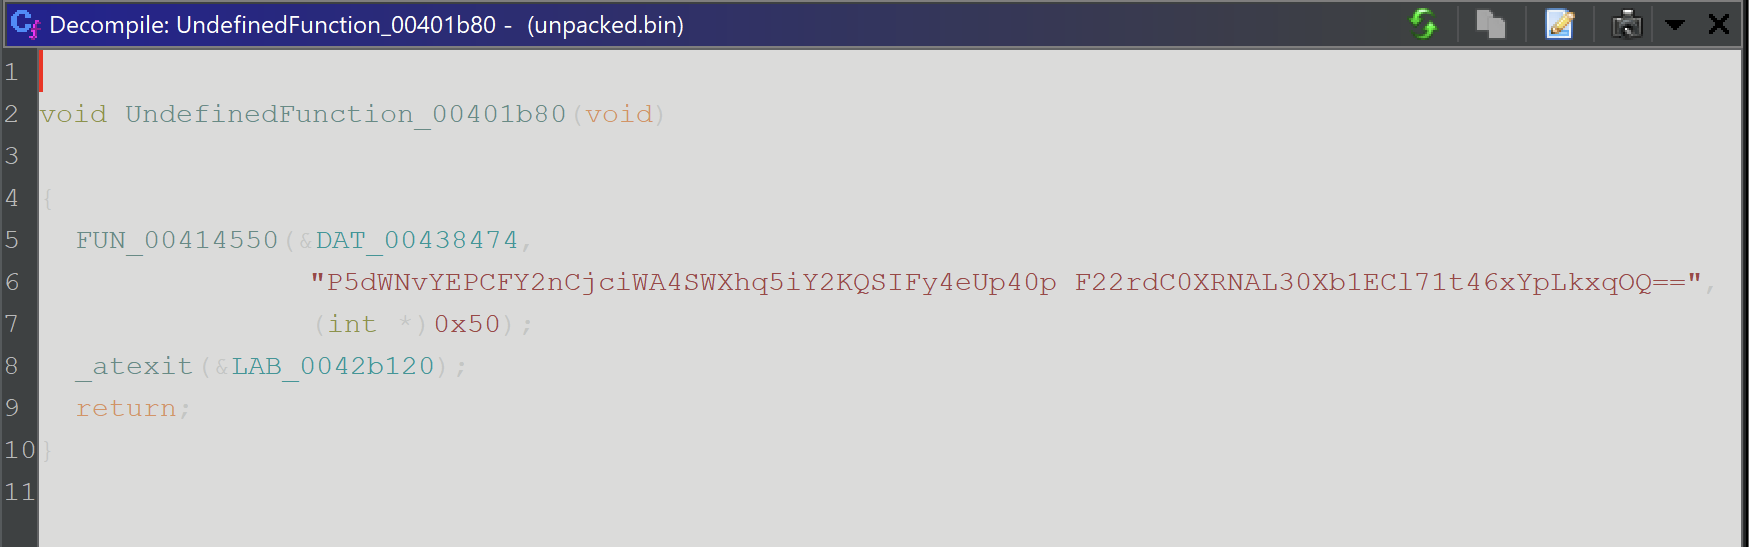
By clicking on the first address of the function and hitting F, we can define a function at the current address.
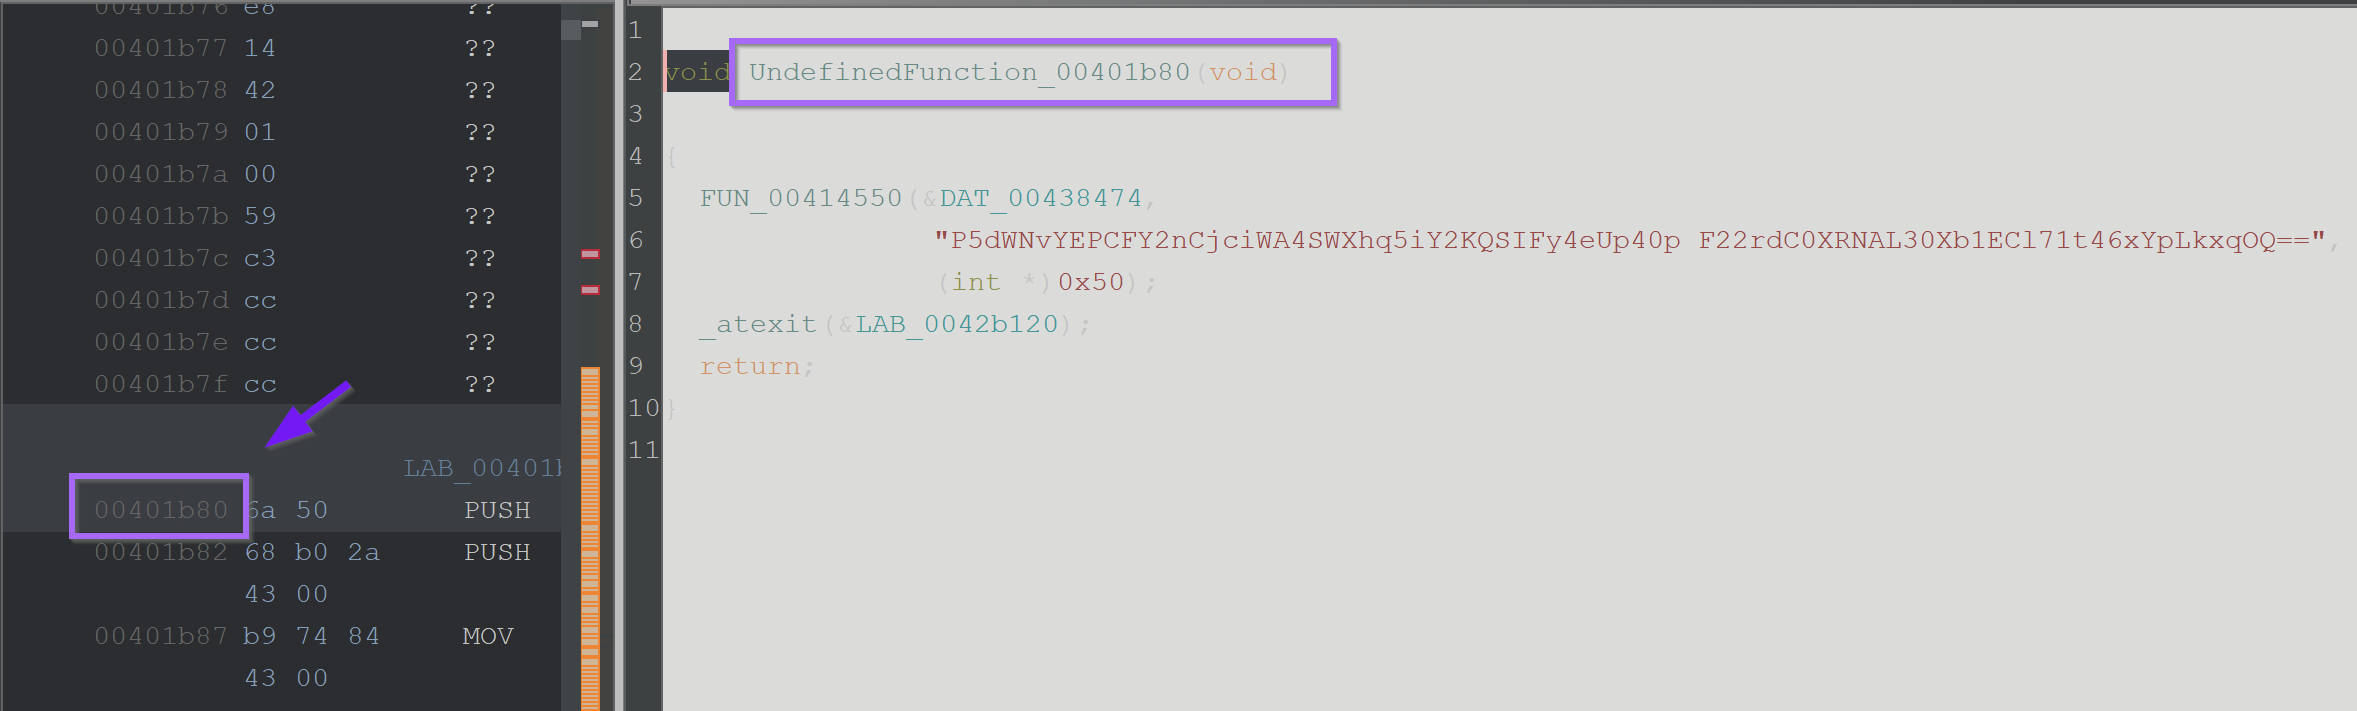
After defining a function - the decompiler output now looks much cleaner.
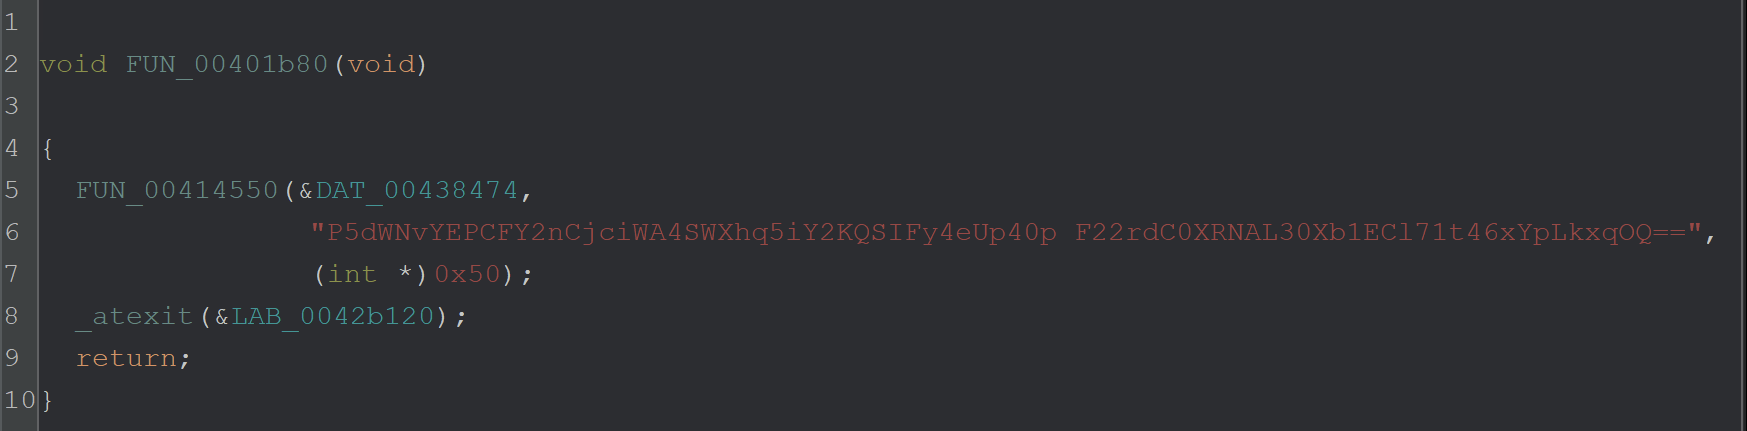
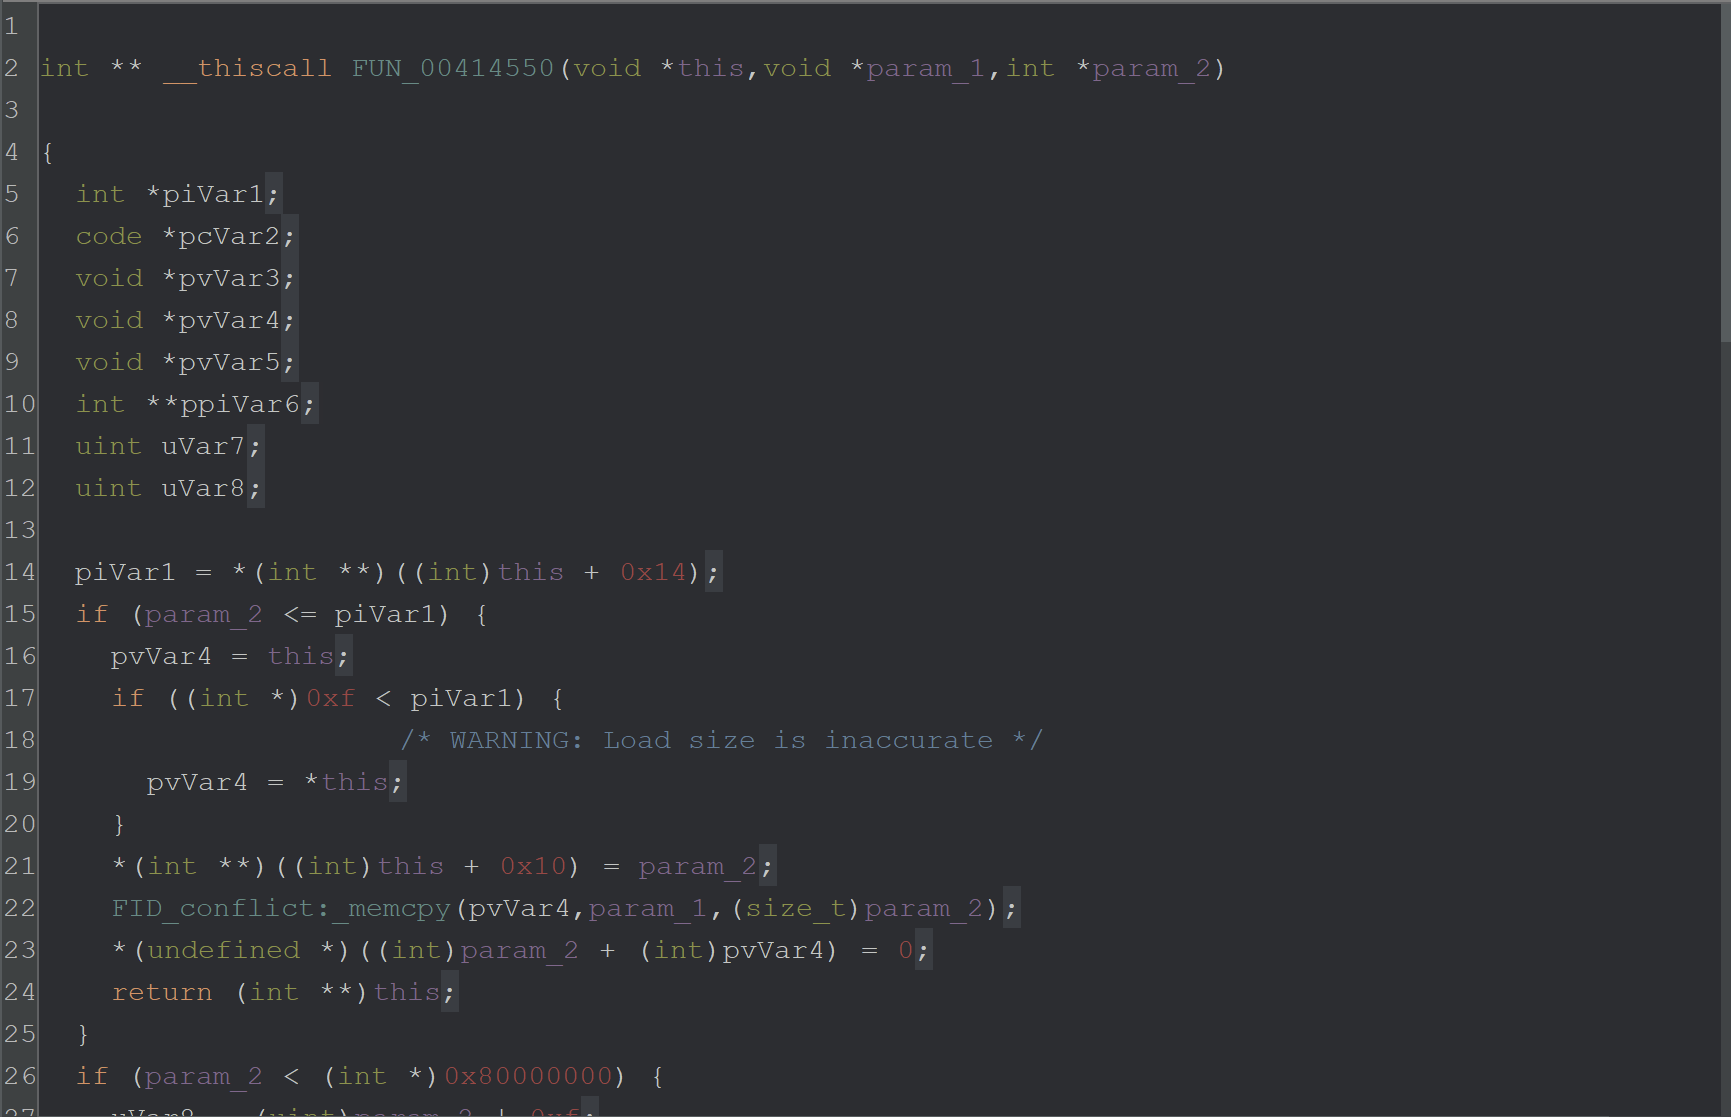
From here we can enter the function at FUN_00414550 and investigate.
The function contains a bunch of C++-looking junk, which was difficult to analyse - so I decided to take a slightly different approach.
I checked the number of cross-references on the FUN_00414550 function. A high number of cross-references would indicate that the function is responsible for decoding more than just this encoded string.
If the same function is used for all string-related decryption, then perhaps a debugger and a breakpoint are the better approach.
At minimum - a debugger will at least confirm the theory that this function is related to string decryption.
String Decryption Via X32dbg
I decided to investigate the string decryption using X32dbg.
To do this - I would need to set a breakpoint on the function that I suspected was responsible for string decryption.
Attempting to copy and paste the address directly from Ghidra will likely result in an error as the addresses may not align.
Syncing Addresses with Ghidra and X32dbg
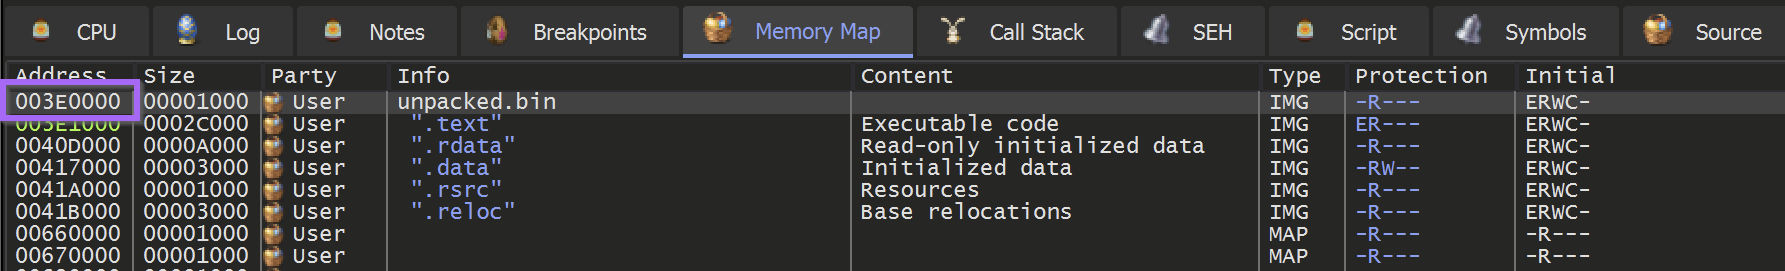
To Sync the Addresses between Ghidra and X32dbg. We need to find the base of our current file. This can be found in the memory map and in this case is 003e0000. Although it may be different for you.
From here we can select the memory map within Ghidra.
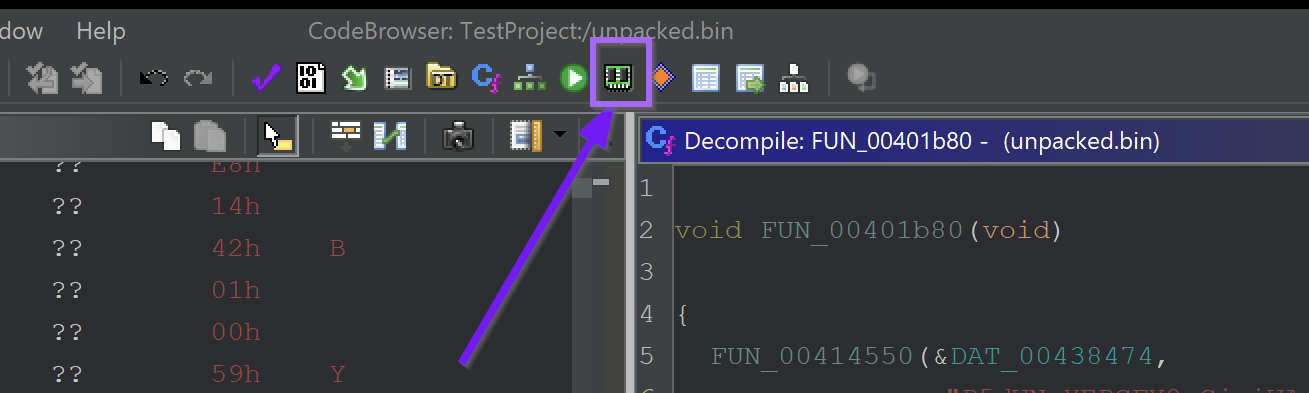
Then select the Home button
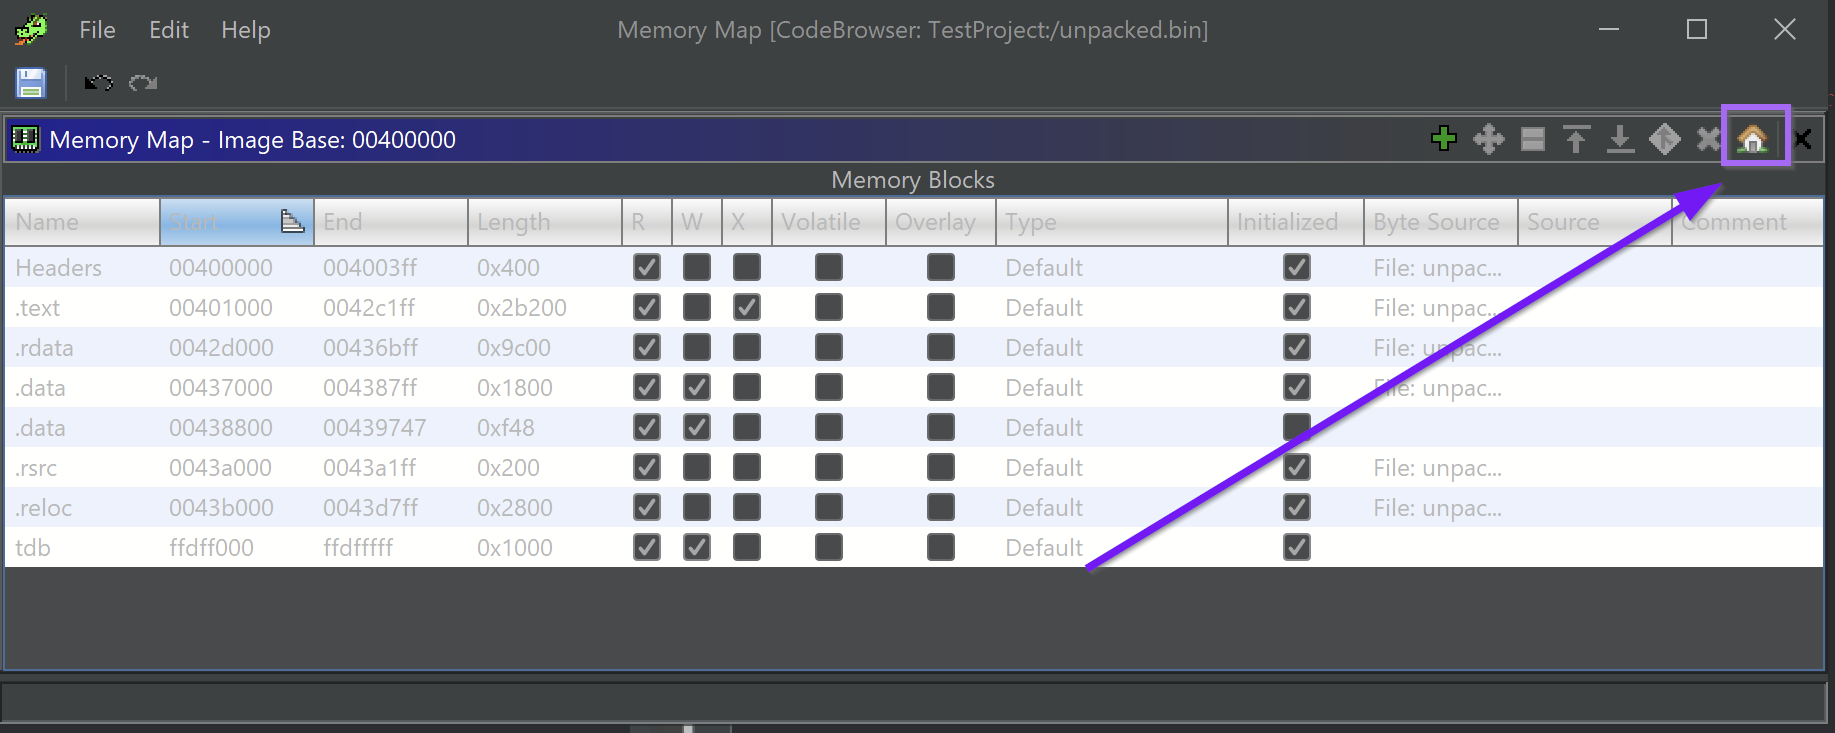
and set the base address according to what was obtained with x32dbg.
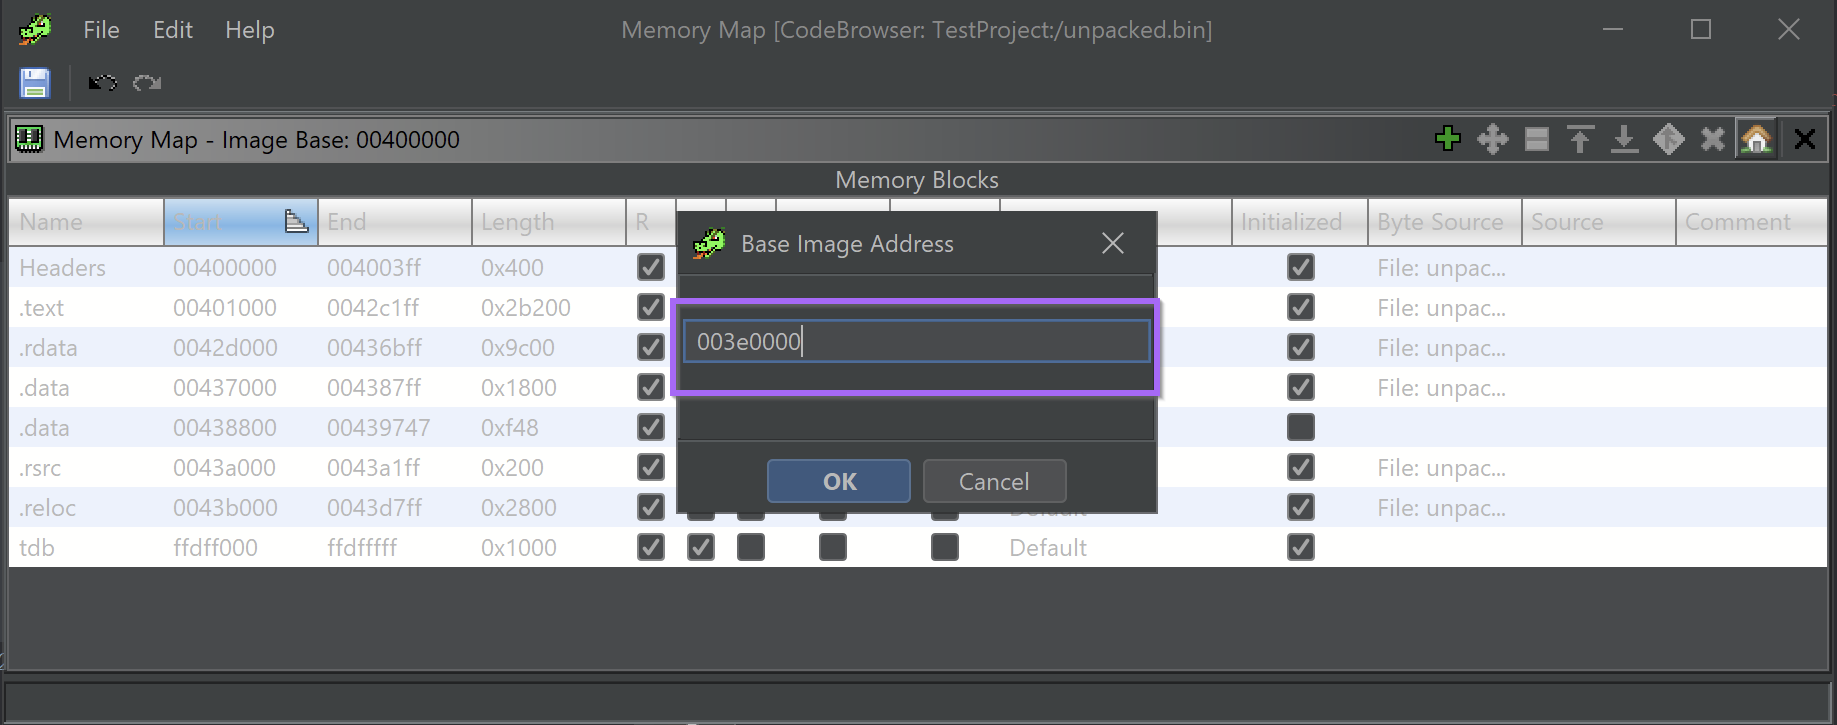
From here, the address of the suspected string decryption function will be updated accordingly and be in sync with x32dbg.
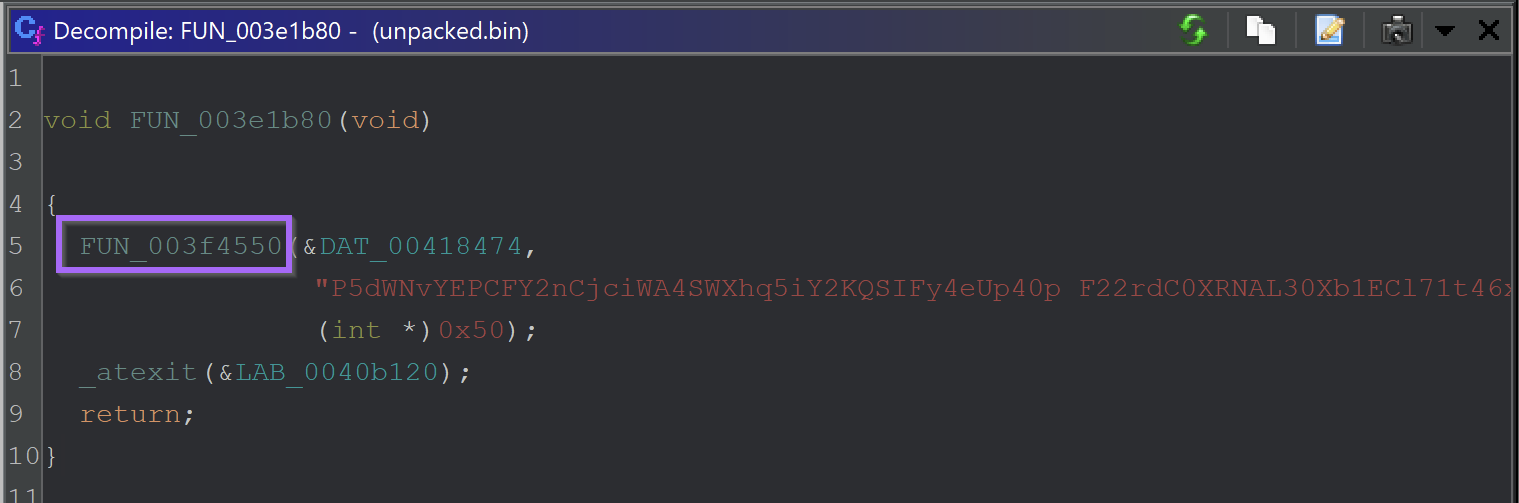
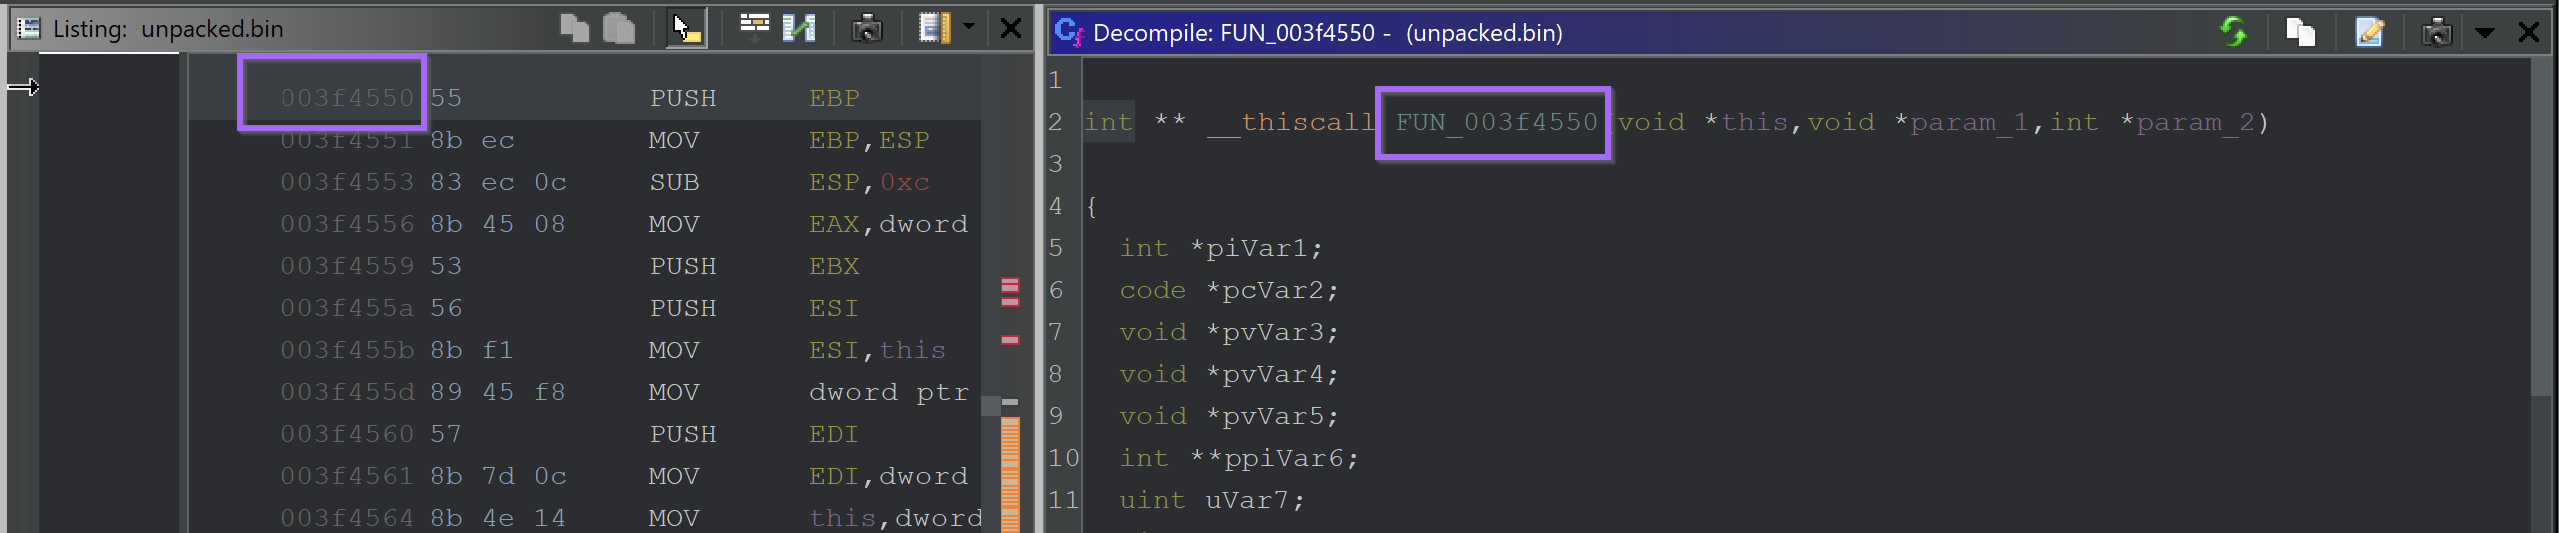
The new function address is 003f4550 . This value can be used to create a breakpoint inside of x32dbg.
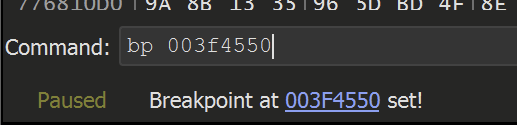
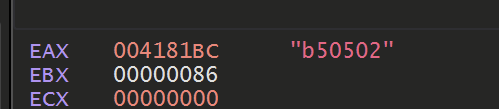
The breakpoint is then hit with an argument of j hl#A
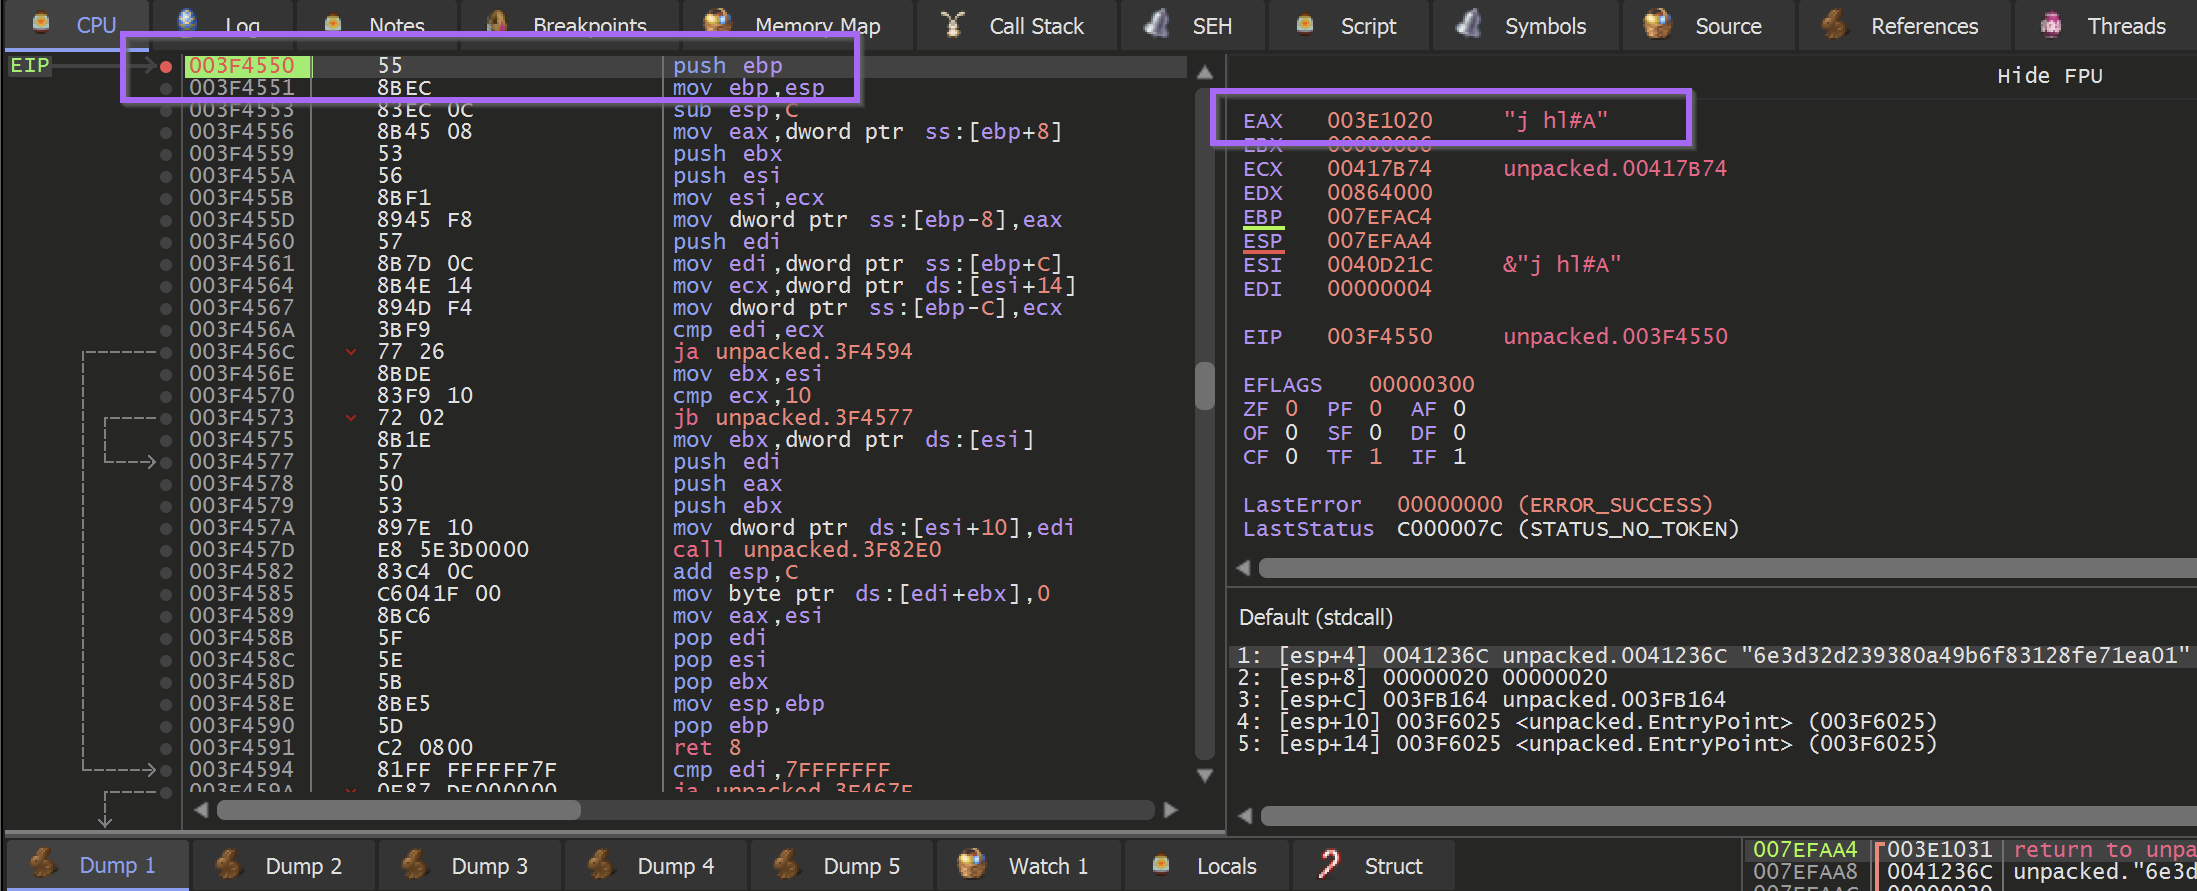
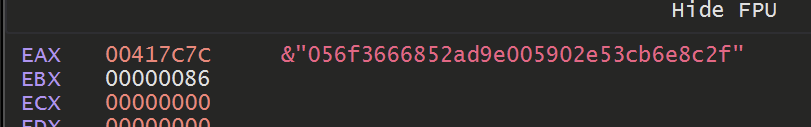
Allowing the malware to Execute Until Return will retrieve the result of the function. In this case, it was a large hex string that was pretty uninteresting.
However, Clicking F9 or Continue will cause the Decryption code to be hit again.
Sadly, this again revealed some largely uninteresting strings
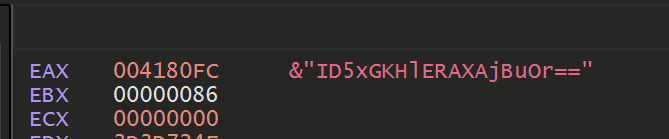
I eventually realised that this function was not used to decode the final strings. But was rather to obtain copies of the same base64 obfuscated strings that were previously found.
At this point, I experimented with the Suspicious imports but could not reliably trace them back to a function that would obtain the decrypted c2's .
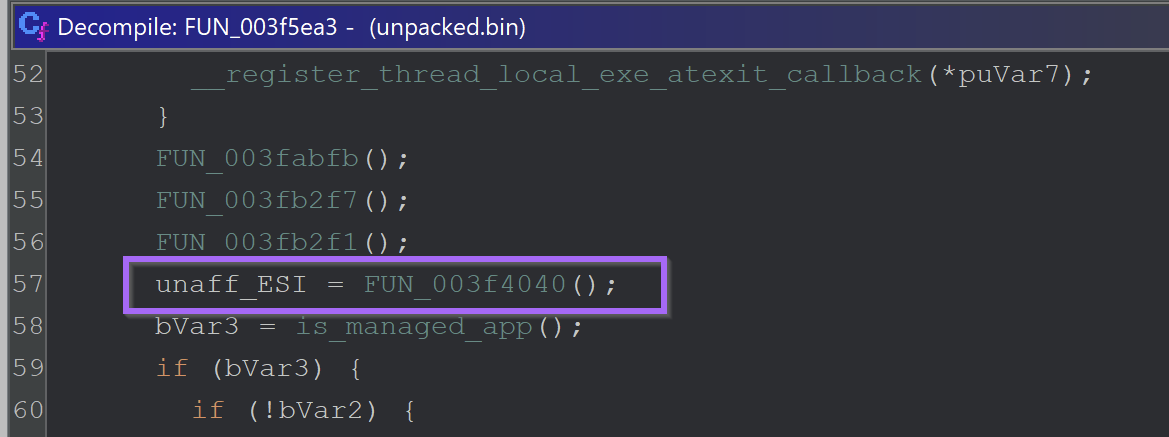
However - I did get lucky and was able to locate an interesting function towards the main malware function of the code.
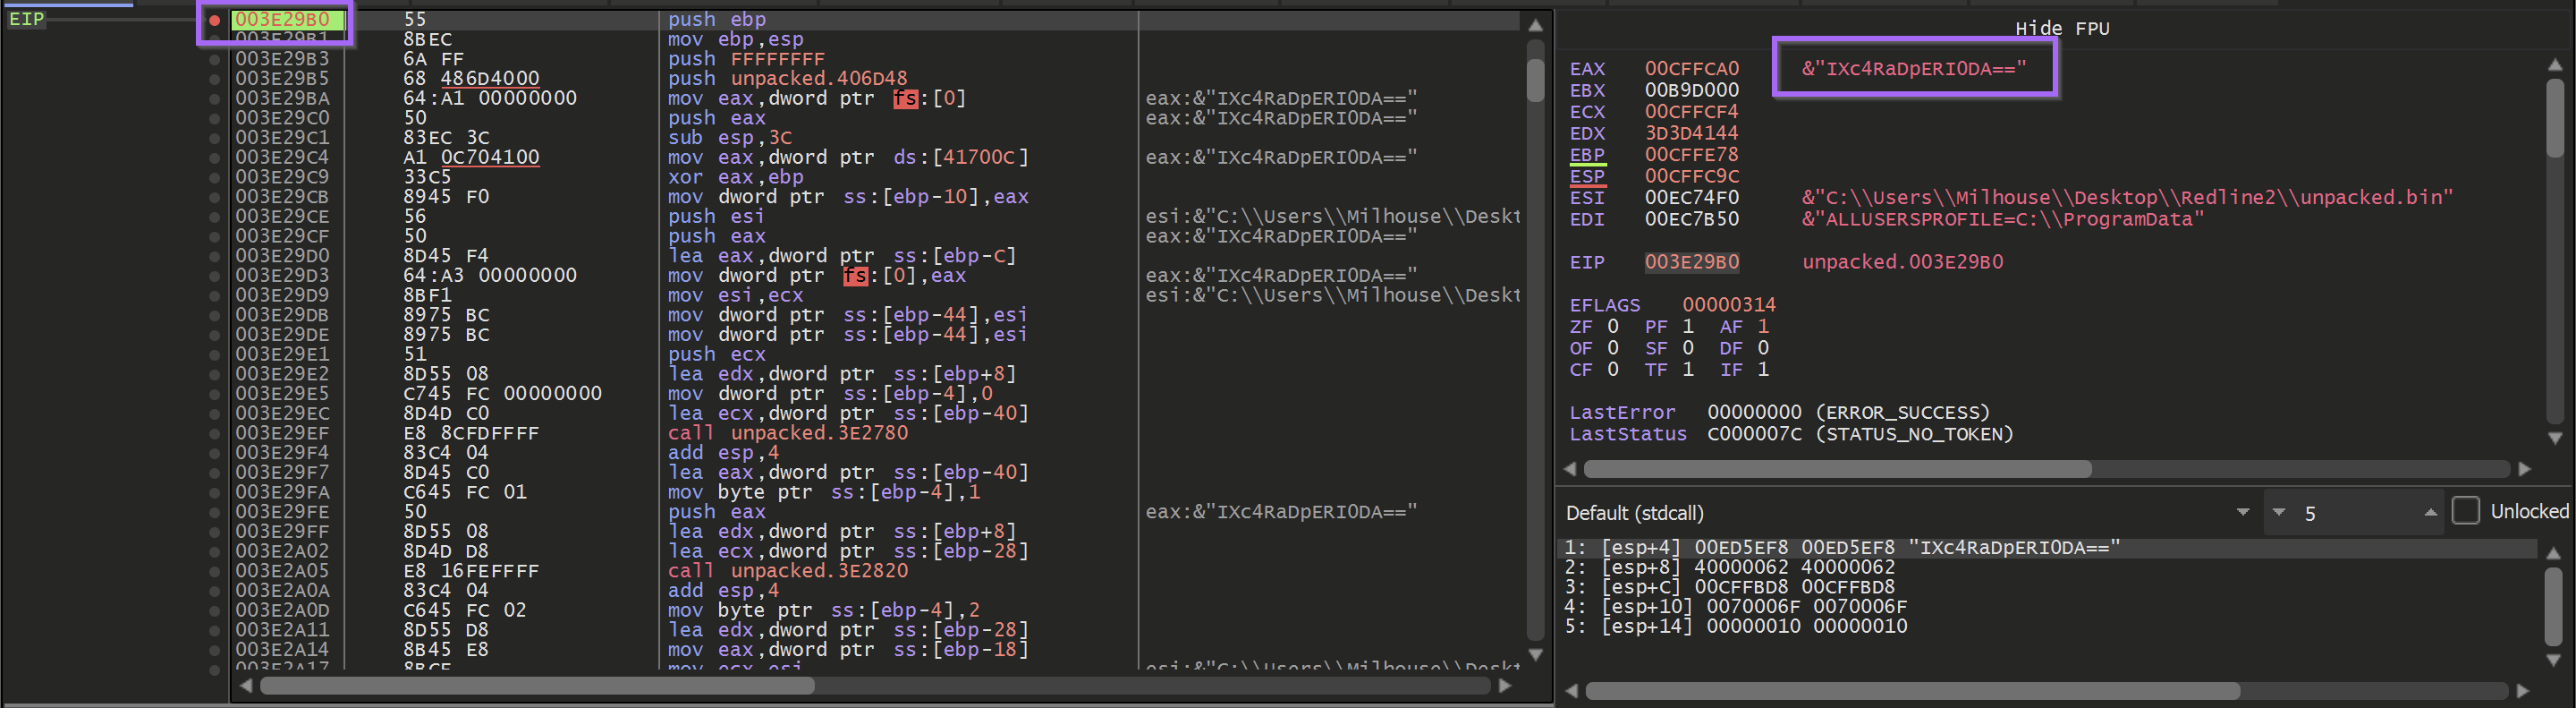
This function was located at 003d29b0.
Locating Main
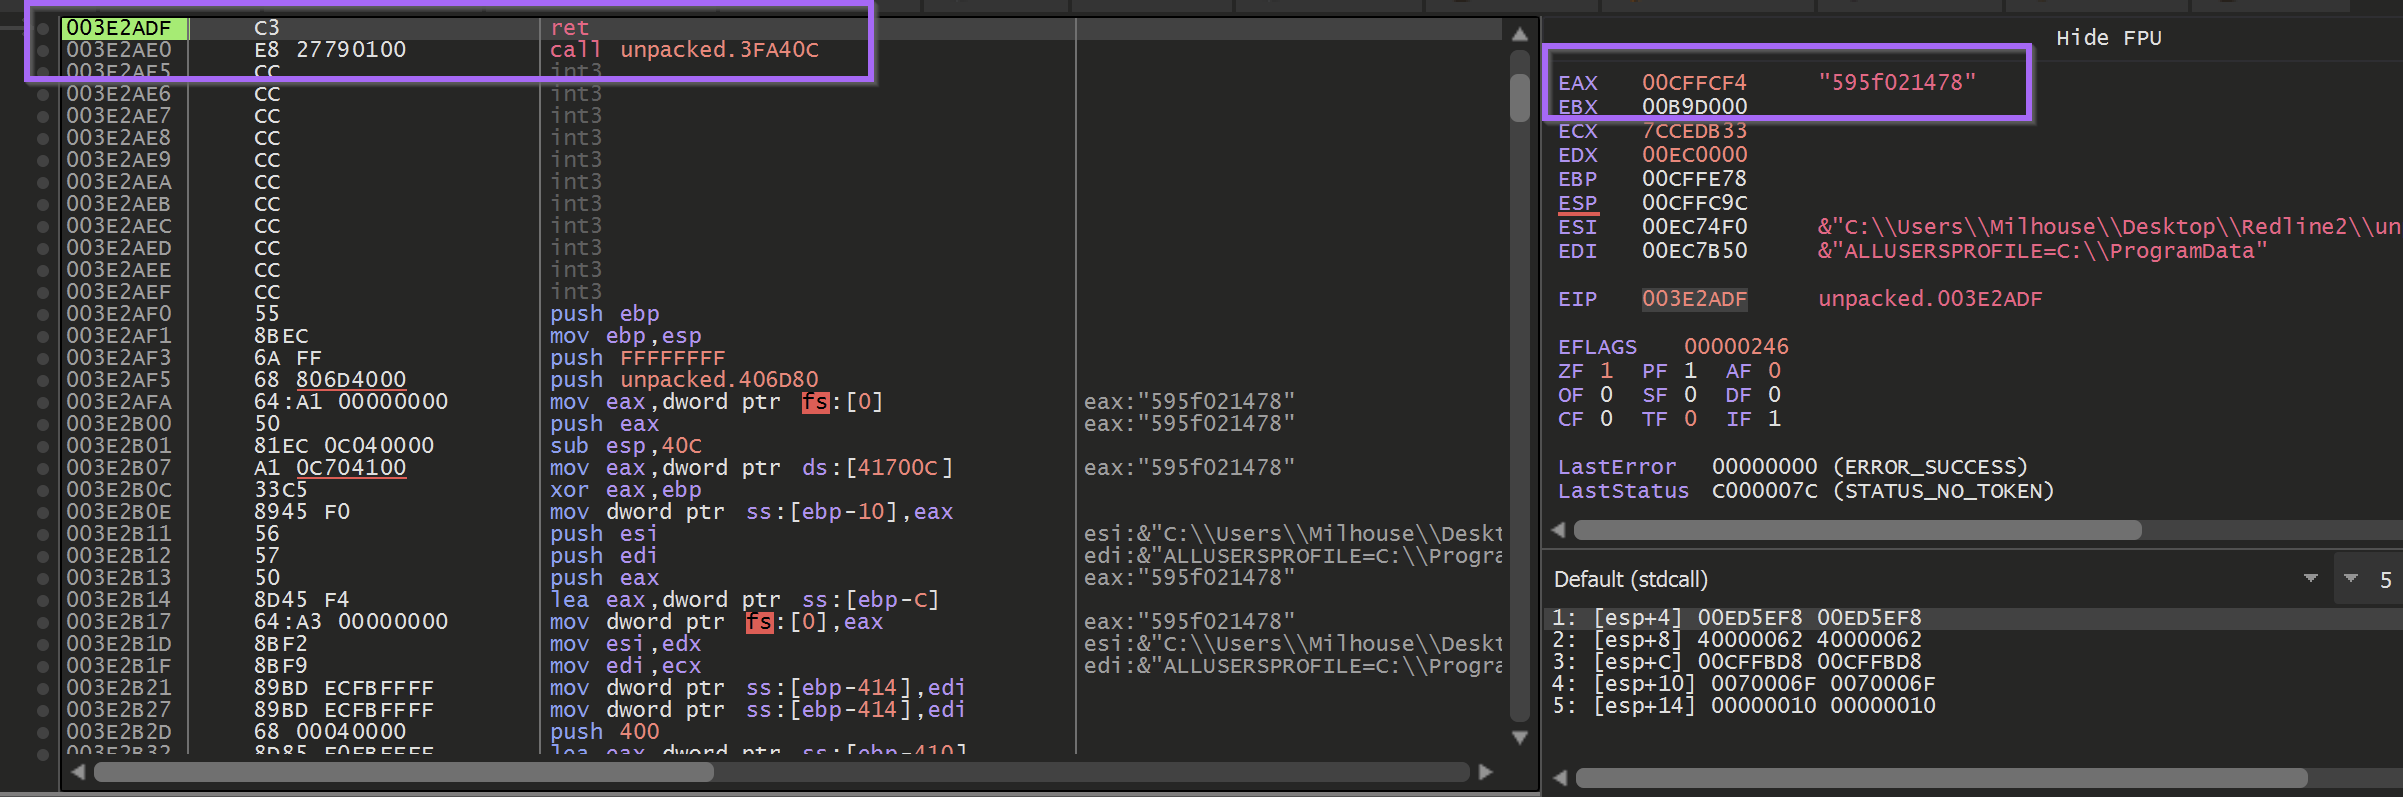
I was able to locate main by browsing to the EntryPoint.
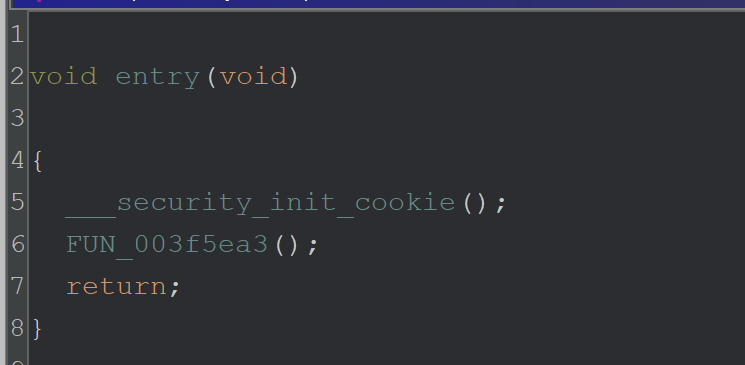
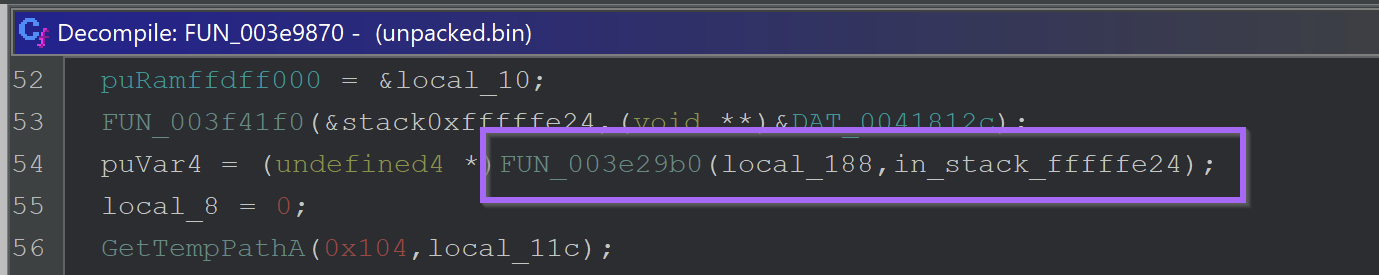
When this function is executed - a base64 encoded value is passed as an argument.
Executing until the end of the function - A value is obtained, which the malware used to create a folder in the user's temp directory.
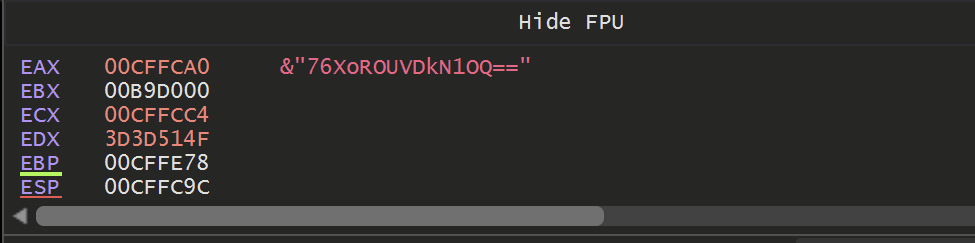
The next call to this function - took a base64 encoded argument and returned a file name that the malware was copied into.
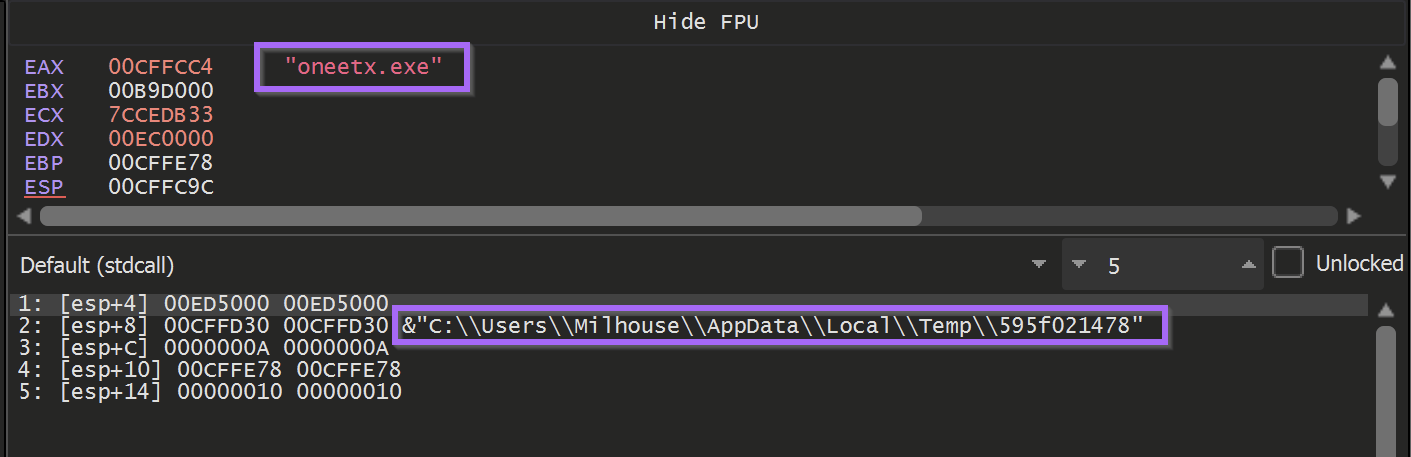
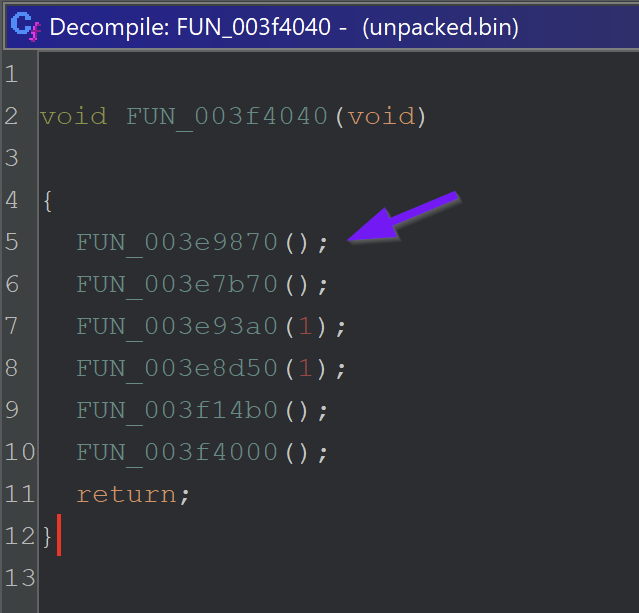
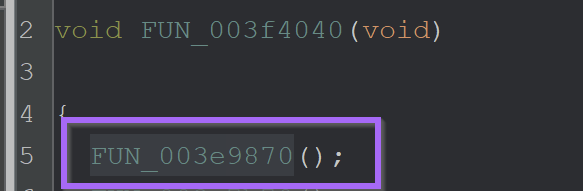
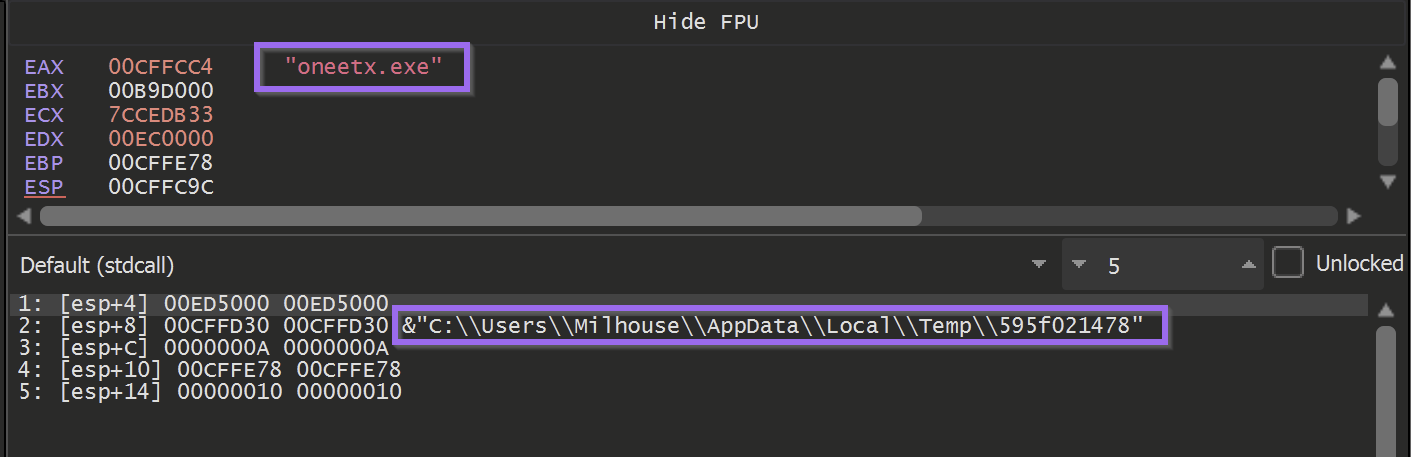
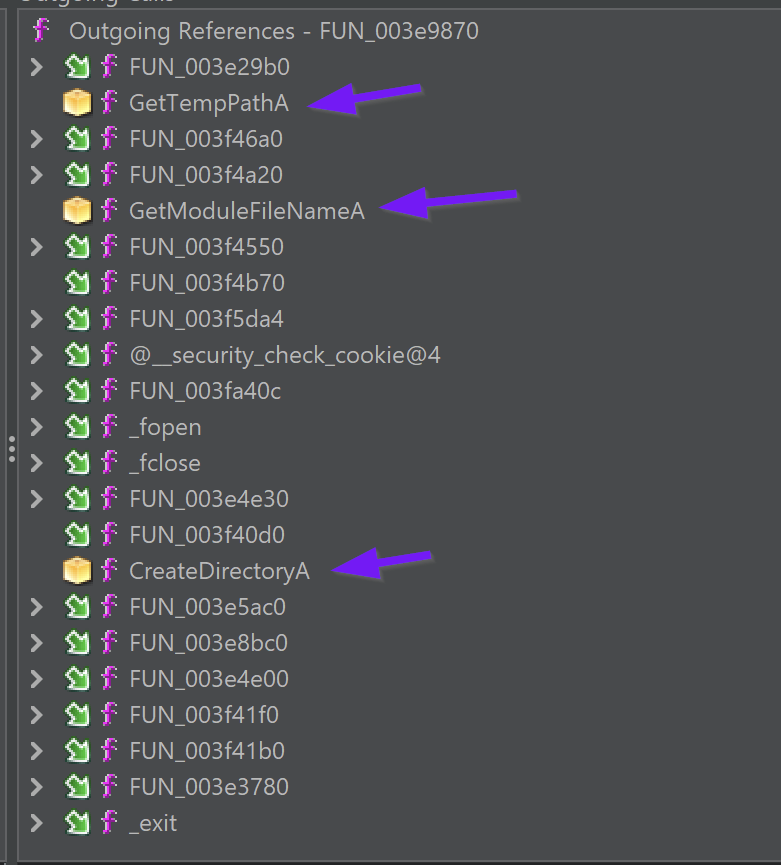
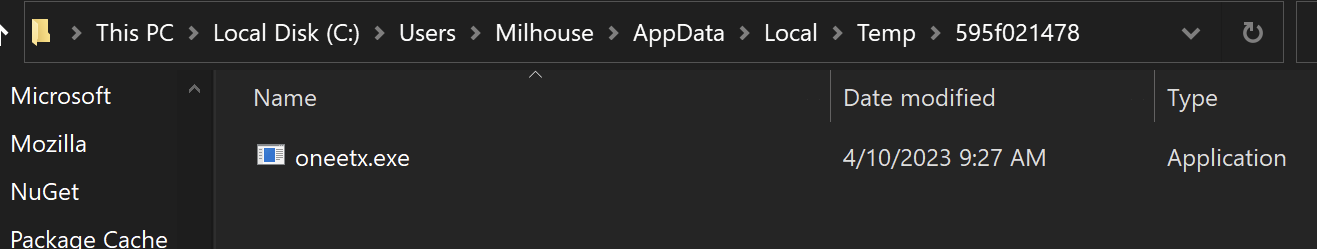
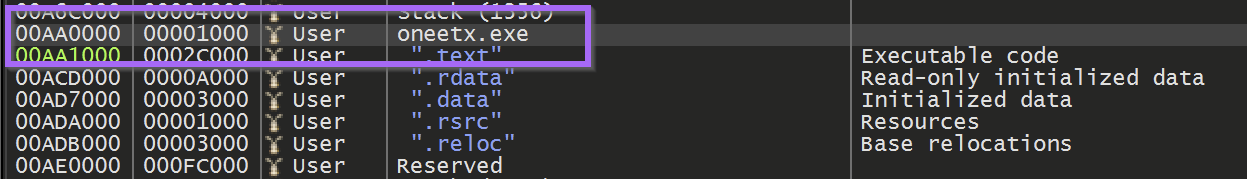
At a location of 003e9870 - was a function responsible for checking the location of the current running file.
If the location did not match C:\\users\\<user>\\appdata\\local\\temp\\595f021478\\oneetx.exe - then the malware would terminate.
Here we can see the return value from the function.
As well as the outgoing function calls in the Ghidra Function Tree.
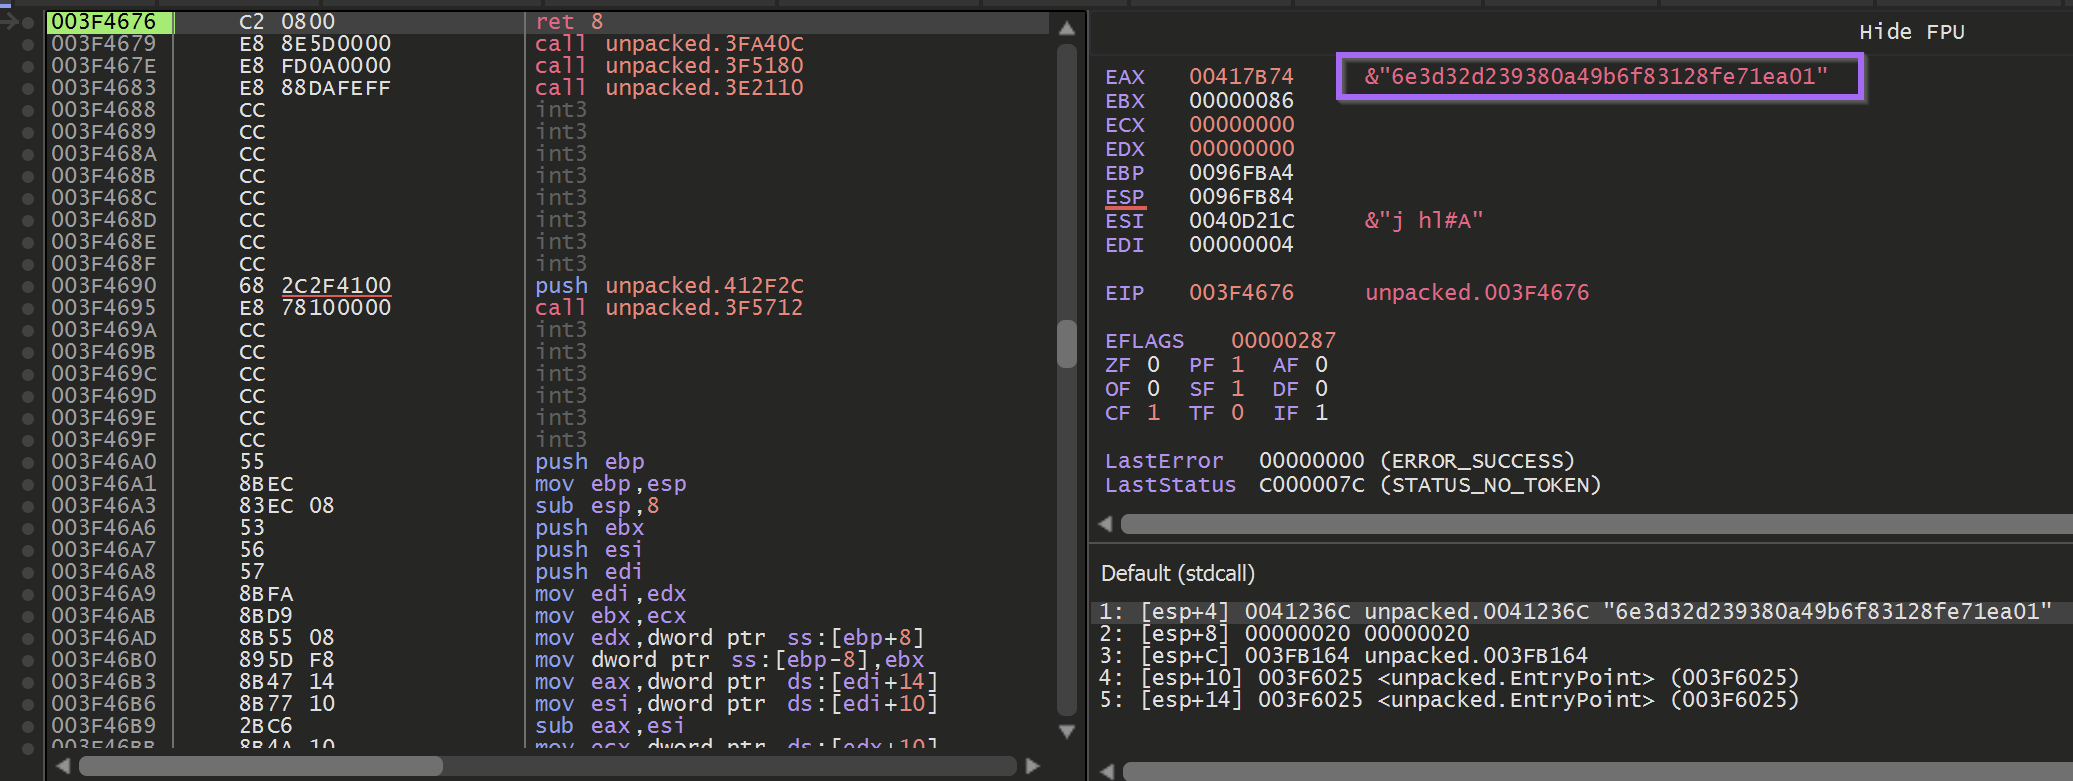
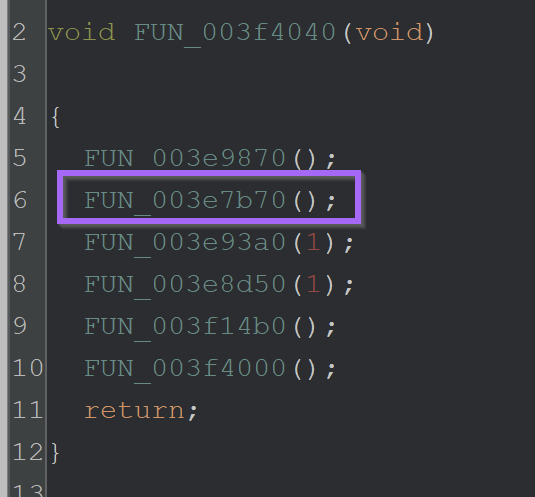
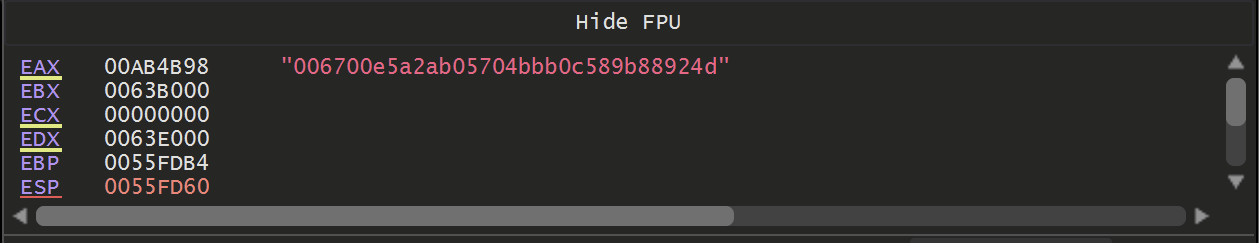
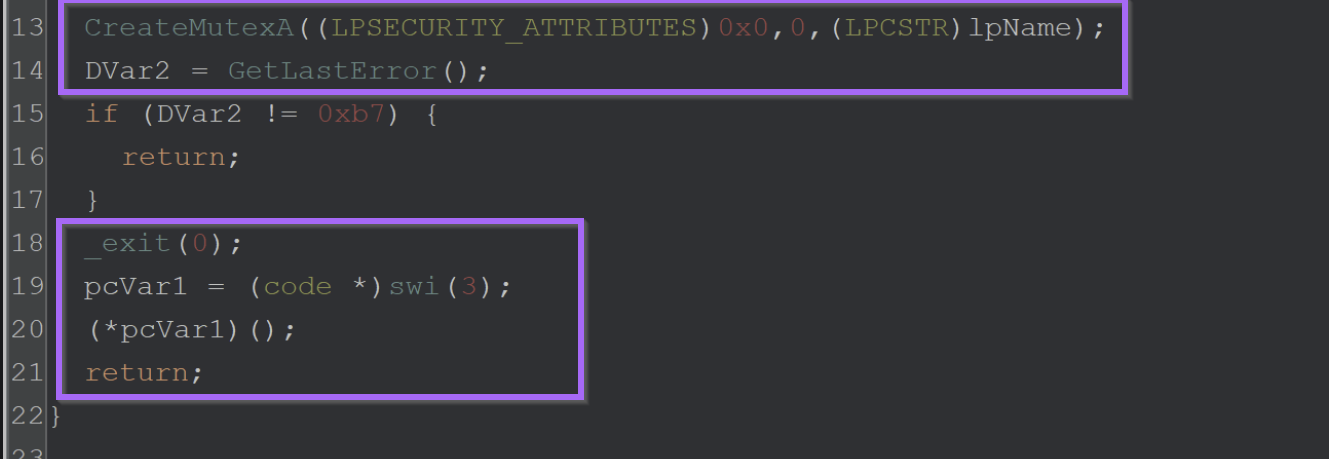
After the directory check is performed - the malware enters FUN_003e7b70 attempts to create a mutex with a value of 006700e5a2ab05704bbb0c589b88924d
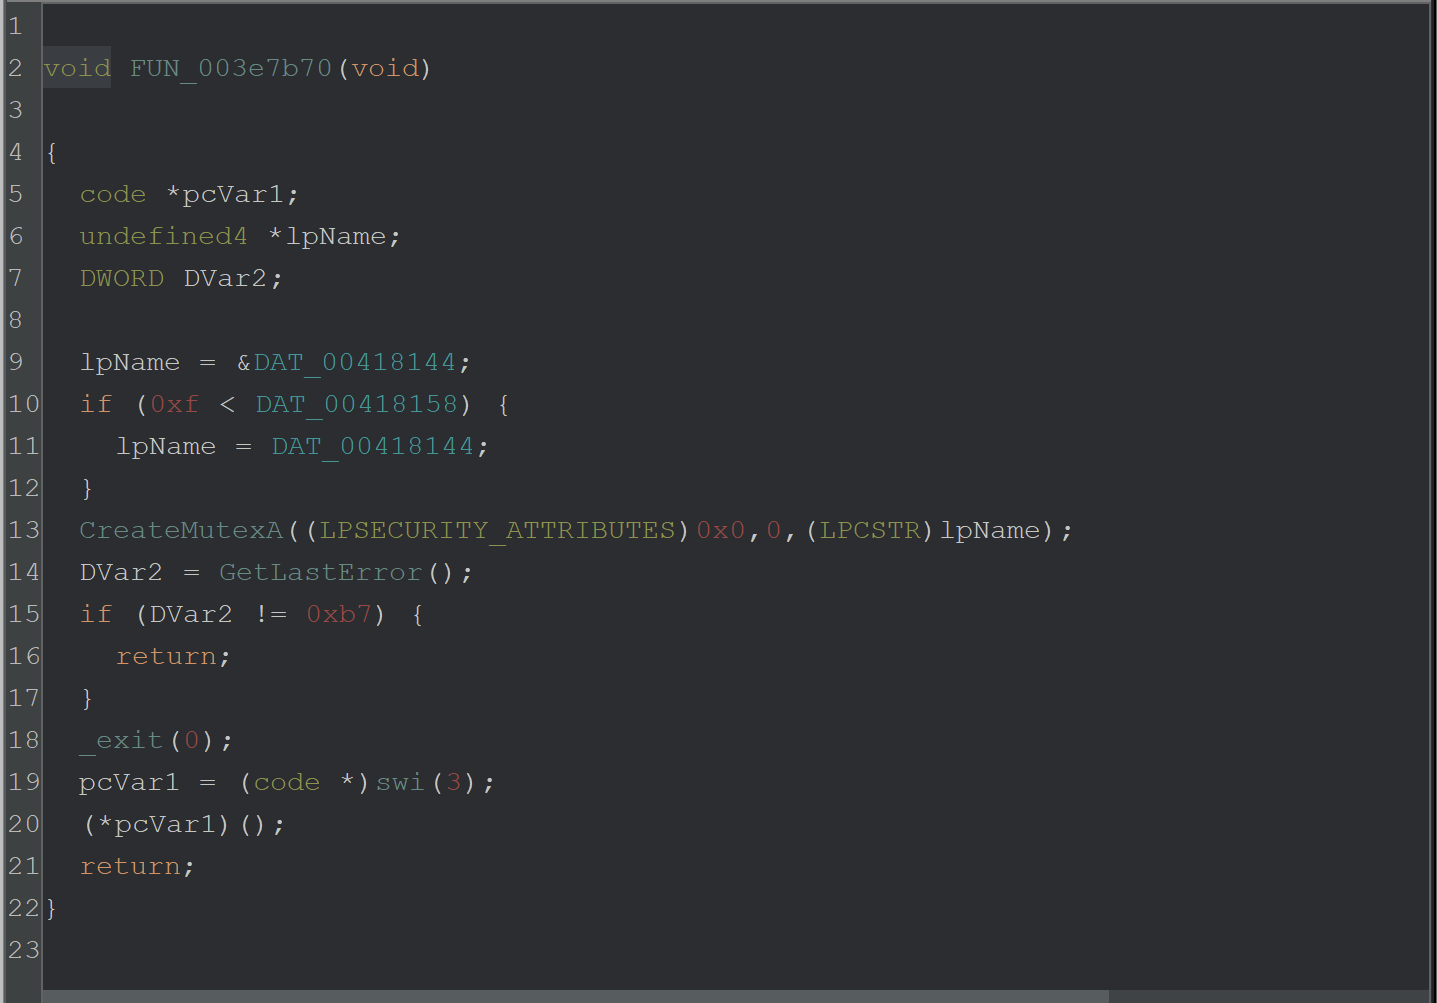
By breaking on CreateMutexA - The value of 006700e5a2ab05704bbb0c589b88924d can be seen as an argument.

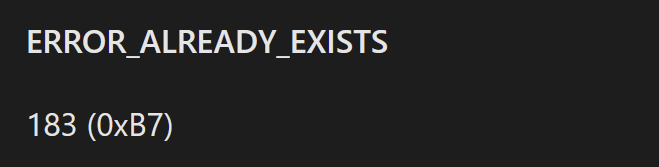
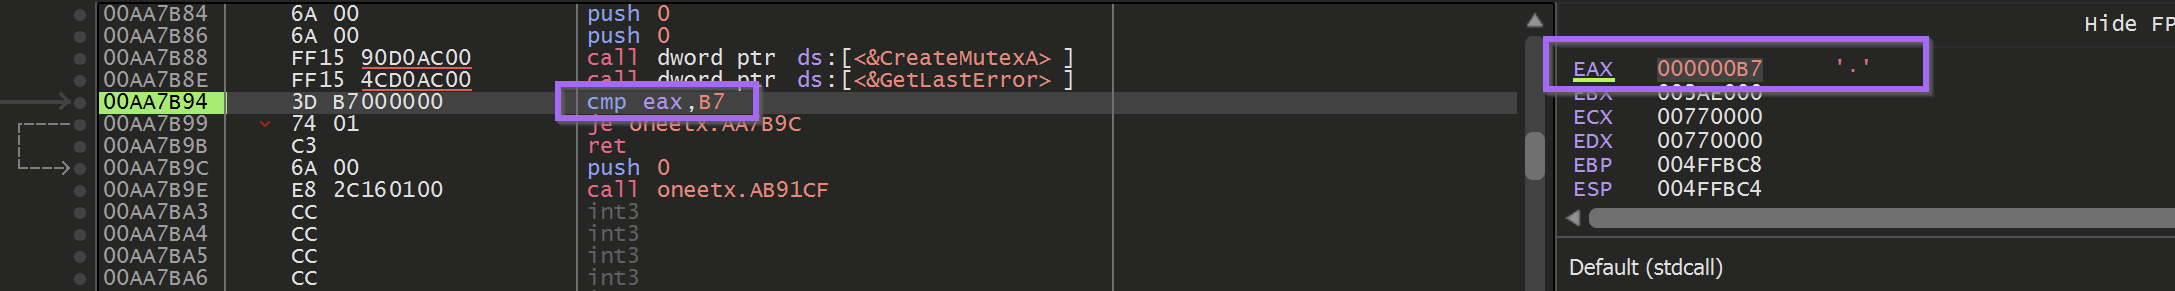
If the mutex creation returned a value of 0xb7 (Already Exists) - then the malware would terminate itself.
Bypassing Anti-Something Checks
These two checks on the file path and Mutex can function as pseudo-anti-debug checks. In order to continue analysis, they needed to either be patched or bypassed.
In order to bypass the file path check - I allowed the malware to execute inside the analysis VM and copy itself to the correct folder. I then opened the new file inside the debugger.
Alternatively - You could have patched or nop'd the function. but I found that just moving it to the expected folder worked fine.
Once the new file was loaded - I updated the base address in Ghidra to match the new address in x32dbg.
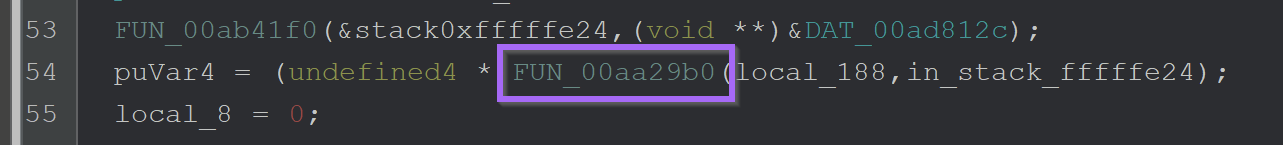
Once I updated the base address - I set a breakpoint on CreateMutexA and the suspected decryption function FUN_XXXX29b0
Once I hit the breakpoint on CreateMutexA - I stepped out of the function using Execute Until Return and then Step Over twice.
This allowed me to see the return value of b7 from the GetLastError function. When I allowed the malware to continue to run - it quickly terminated itself without hitting the decryption breakpoint.
To fix this - I used Edit to patch the return value to be B6 instead.
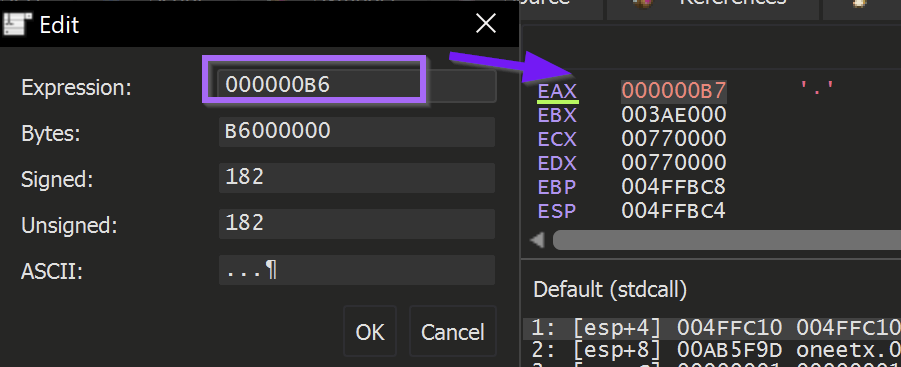
Upon running the malware - The decryption function was hit again.
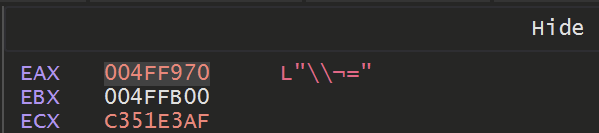
Following the return of the decryption function using Exeute Until Return revealed a pretty boring \\ character.
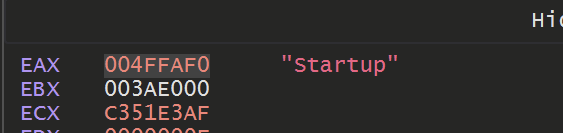
But allowing it to hit a few more times - it eventually returned a value of Startup which was pretty interesting.
Hitting again revealed a registry path of
SOFTWARE\\Microsoft\\Windows\\CurrentVersion\\Explorer\\User Shell Folders

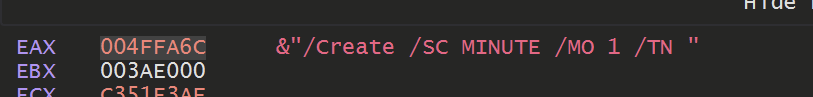
Eventually some more interesting values were returned. Including a partial command likely used to create persistence.
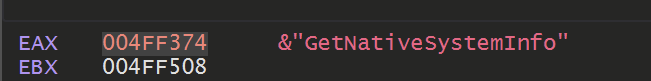
As well as some possible signs of enumeration


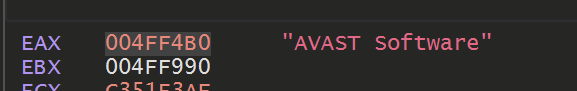
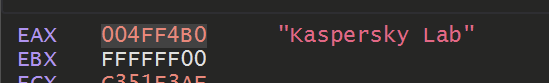
Eventually - The names of some security products was also observed. Likely the malware was scanning for the presence of these tools.
Eventually, the constant breakpoint + execute until the return combination got tiring.
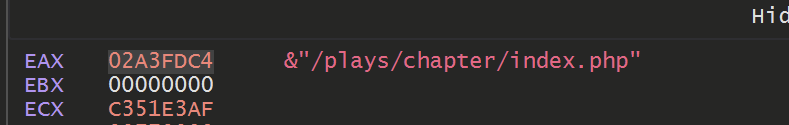
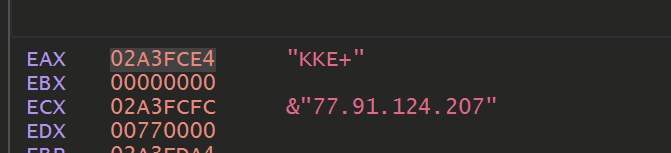
Allowing the decryption function to continue to execute and hit our breakpoint. We can eventually observe C2 information.
Automating the Decryption - Kinda
Eventually, the constant breakpoint + execute until the return combination got tiring. So I decided to try and automate it using a Conditional Breakpoint and Log.
To do this - I allowed the malware to execute until the end of a decryption function.

And then created a Conditional Breakpoint that would log any string contained at eax, then continue execution.
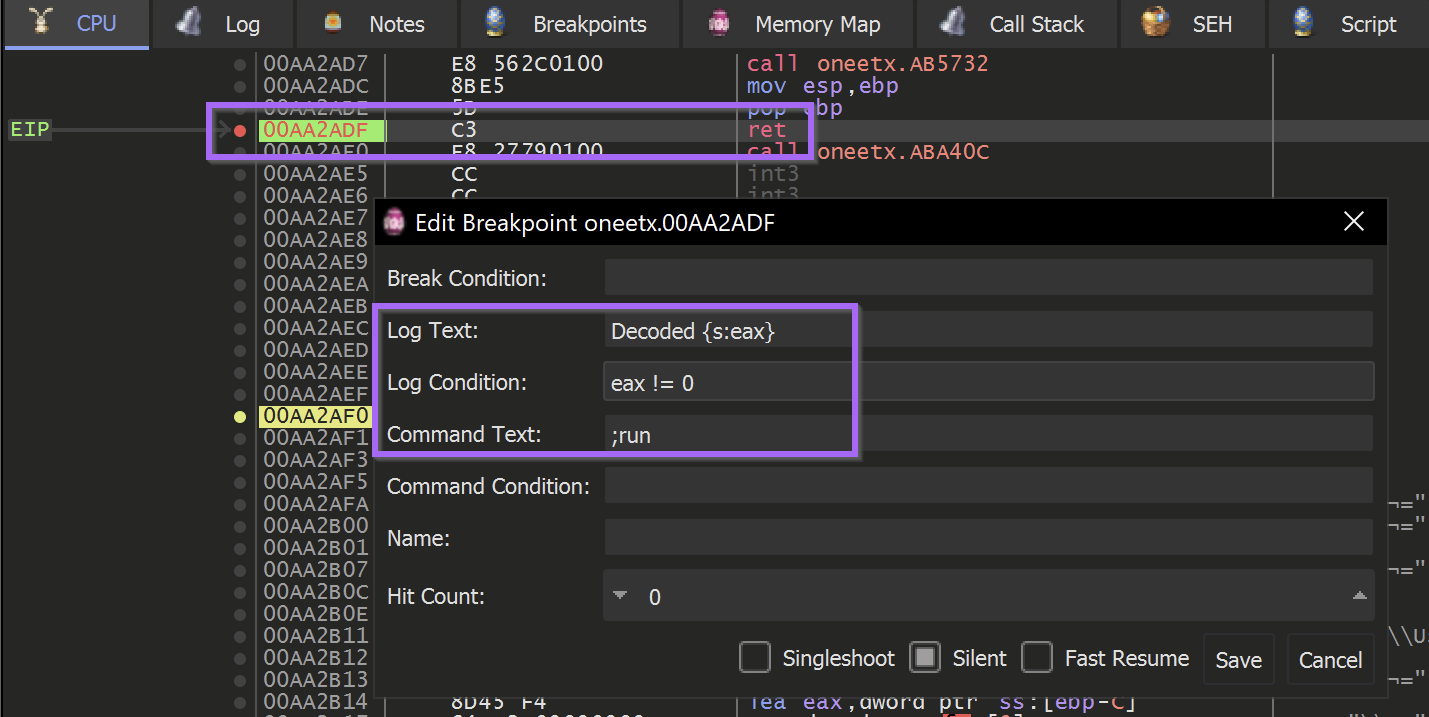
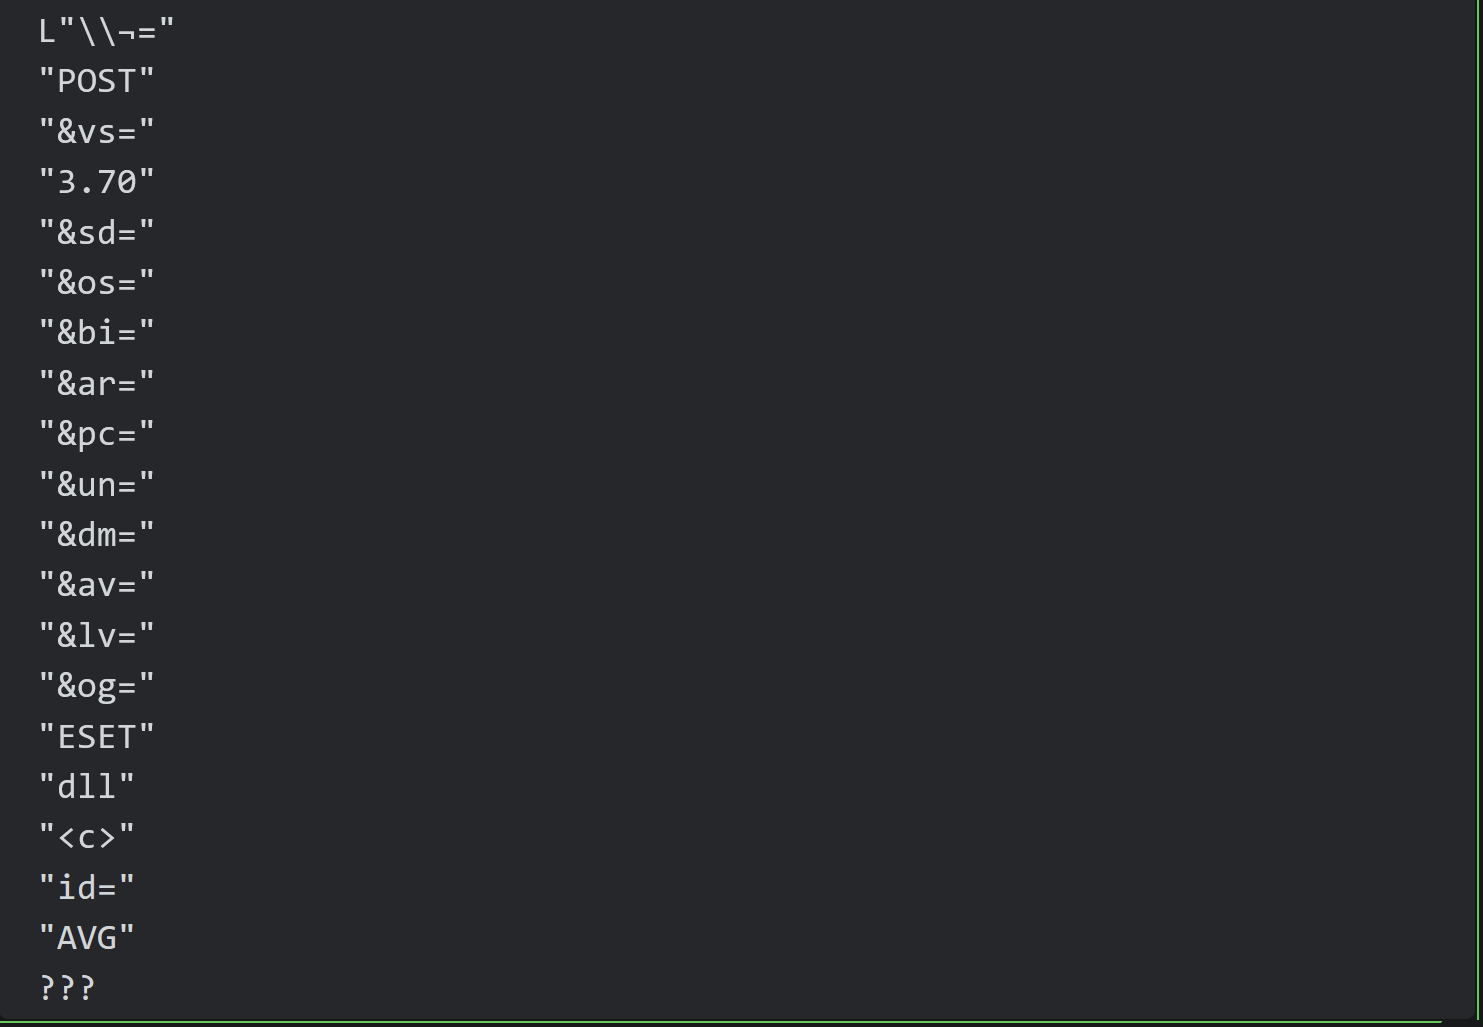
Allowing the malware to continue to execute. I could observe the decoded values printed to the log menu of x32dbg.
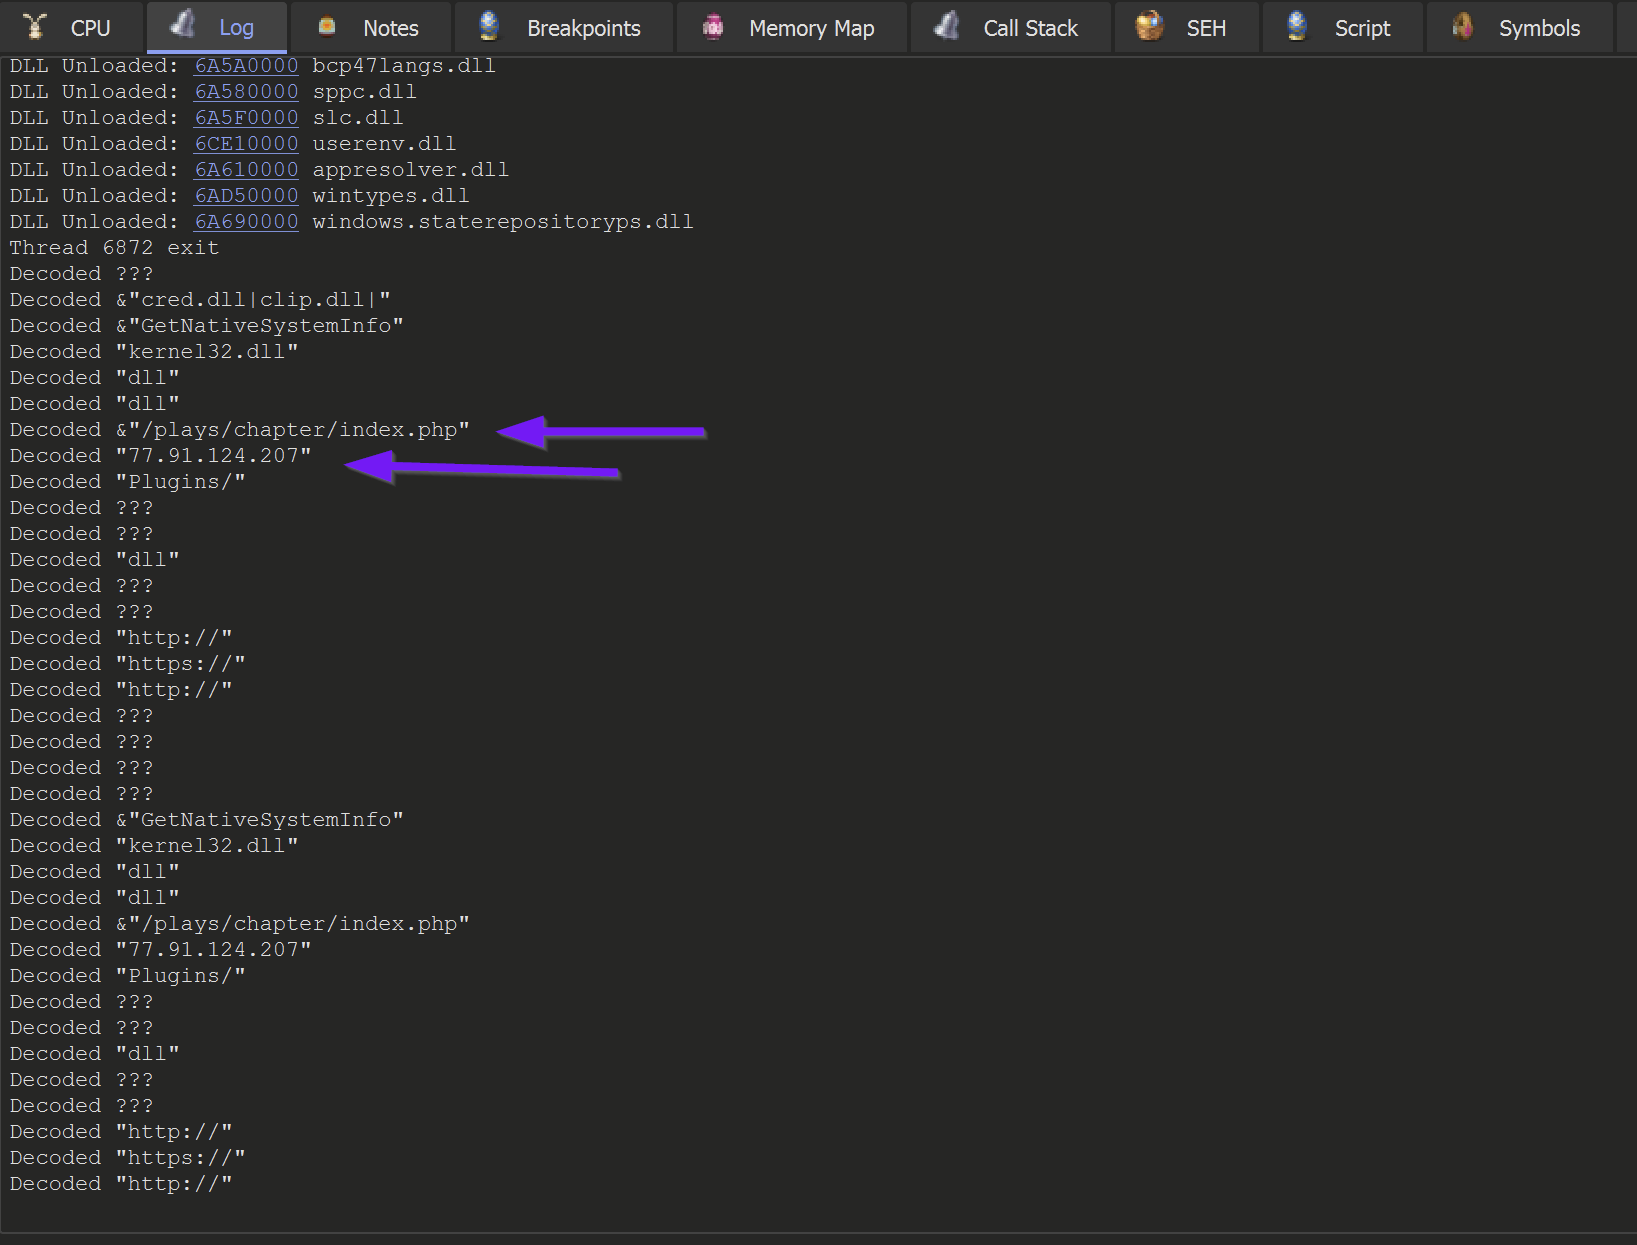
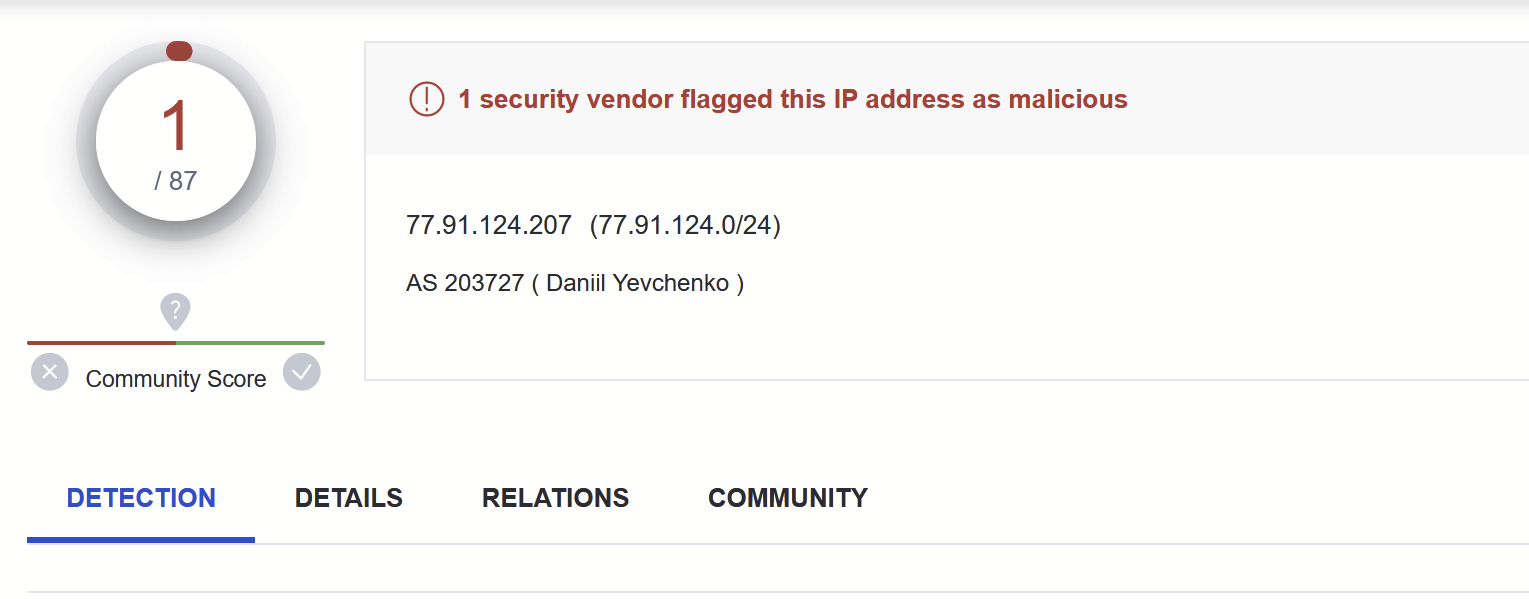
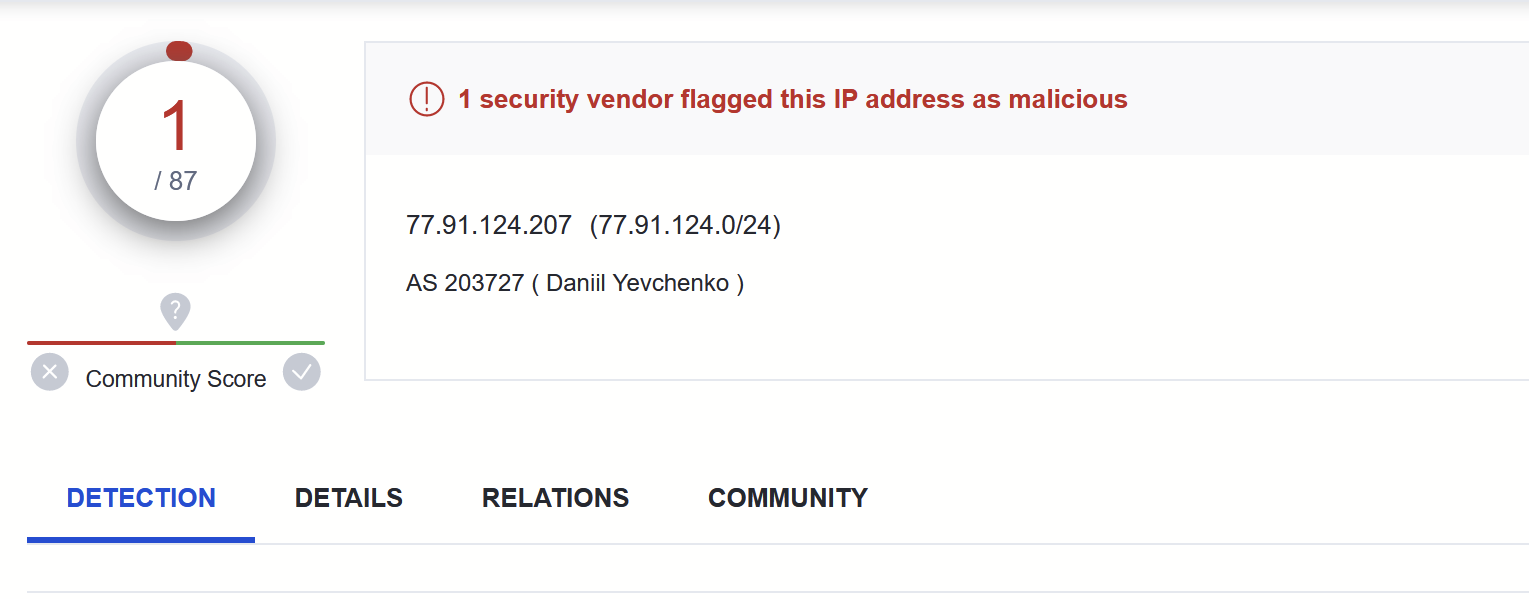
This revealed some c2 information - referencing an IP with 1/87 detections as of 2023/04/10
The full list of decoded strings can be found here.
 &"SOFTWARE\\Microsoft\\Windows\\CurrentVersion\\Explorer\\User Shell Folders"
 &"SYSTEM\\CurrentControlSet\\Control\\ComputerName\\ComputerName"
 &"SOFTWARE\\Microsoft\\Windows NT\\CurrentVersion"
 &"abcdefghijklmnopqrstuvwxyz0123456789-_"
 &"/Create /SC MINUTE /MO 1 /TN "
 &"/plays/chapter/index.php"
 &"GetNativeSystemInfo"
 &"cred.dll|clip.dll|"
 "77[.]91[.]124[.]207"
 "Panda Security"
 "AVAST Software"
 "Kaspersky Lab"
 "ProgramData\\"
 "ComputerName"
 "CurrentBuild"
 "kernel32.dll"
 "Bitdefender"
 "Doctor Web"
 "https://"
 "Plugins/"
 "SCHTASKS"
 "http://"
 " /TR \""
 "Startup"
 "Comodo"
 "Sophos"
 "Norton"
 "Avira"
 "\" /F"
 L"\\¬="
 "POST"
 "&vs="
 "3.70"
 "&sd="
 "&os="
 "&bi="
 "&ar="
 "&pc="
 "&un="
 "&dm="
 "&av="
 "&lv="
 "&og="
 "ESET"
 "dll"
 "<c>"
 "id="
 "AVG"
 ???
The first link contains IOCs from an Amadey Bot sample, which aligns closely with the sample analysed in this blog.
This section was not in the original blog, but was later added when I was informed by another researcher that the malware might not be Redline.
I then revisited my analysis and determined that the sample was Amadey Bot.
I was able to determine this mostly by researching (googling) the decrypted strings.
I thought it would be useful for others to see what this process looked like :)
Decrypted strings are not just useful for C2 information. They are equally as useful for identifying the malware that you are analyzing.
Unless you are analyzing the latest and greatest APT malware, your sample has likely been analyzed and publically documented before. You'd be surprised how much you can determine using Google and the "intext" operator. (Essentially it forces all search results to contain your query string, significantly reducing unrelated content)
From decrypted strings, try to pick something specific.
For example, the following decrypted string &"cred.dll|clip.dll|" can be used to craft a Google query of intext:clip.dll intext:cred.dll malware.
This returns 7 results that reference a combination of Redline Stealer and Amadey Bot.
The first link contains IOCs from an Amadey Bot sample, which aligns closely with the sample analysed in this blog.
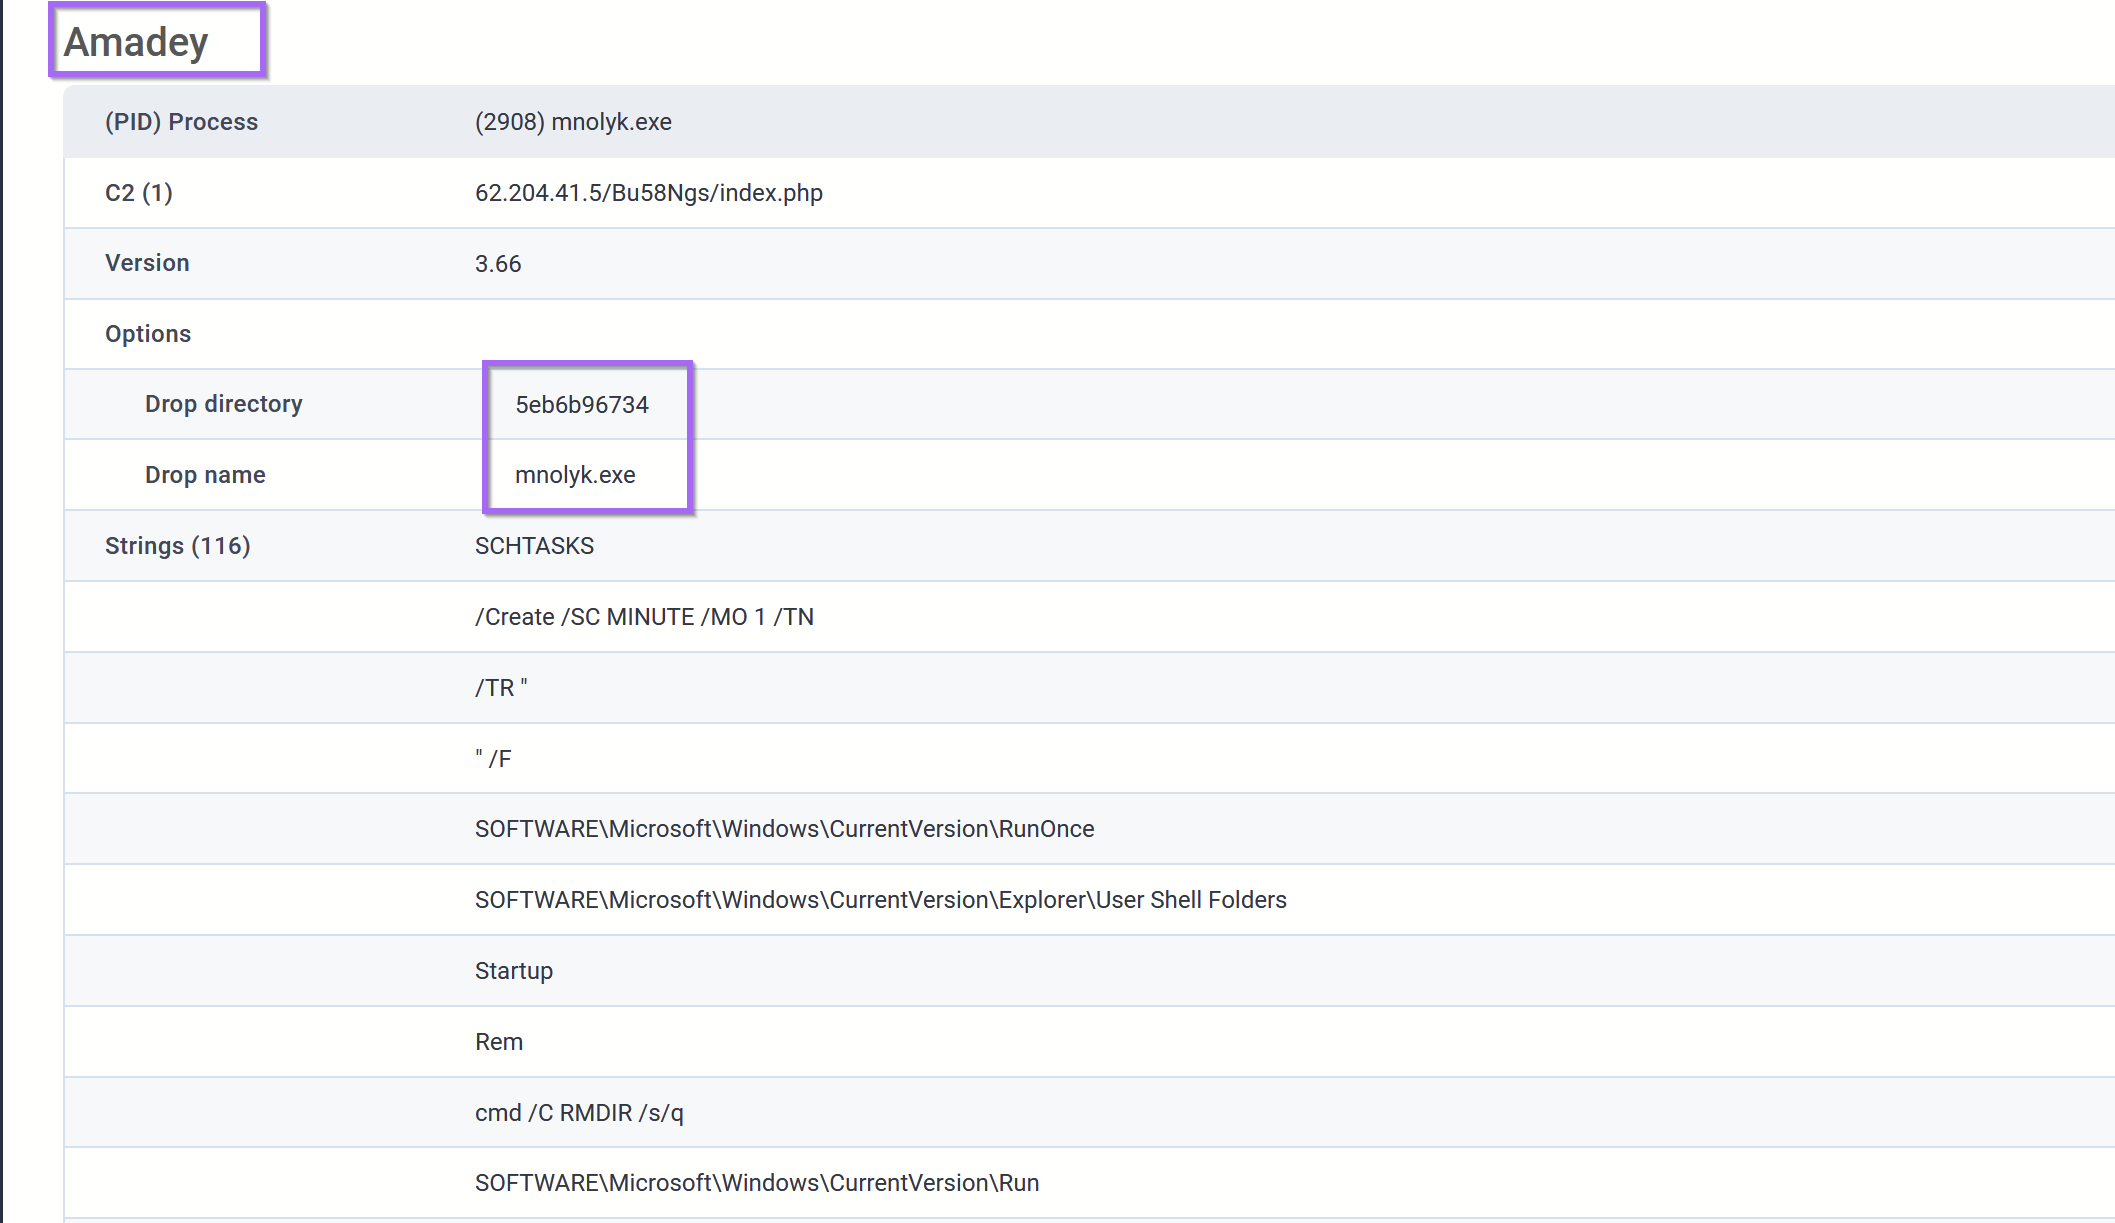
In the second link - An additional Amadey sample is analysed with the exact same filename as this one. Albeit with a different C2 server.
At this point - I would have moderate confidence that the sample is Amadey Bot.
For additional confirmation, I would typically google this family and see if any TTP's are the same or at least similar.
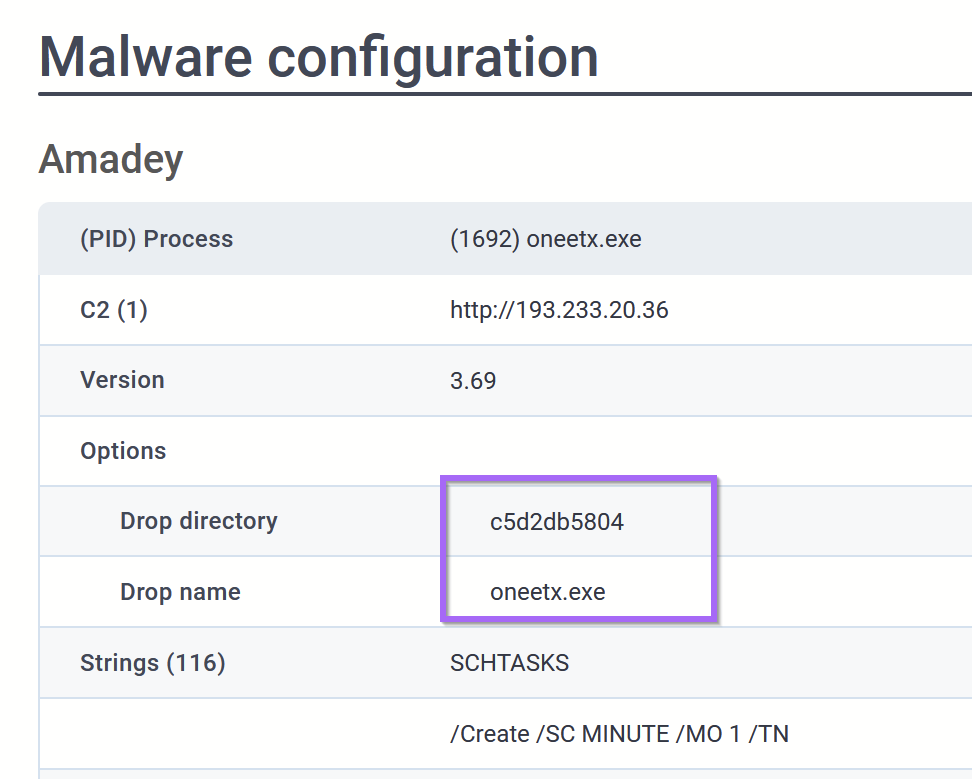
I googled Amadey Bot Analysis and discovered this blog from AhnLab.com.

The Ahnsec blog details an extremely similar installation path and strings.
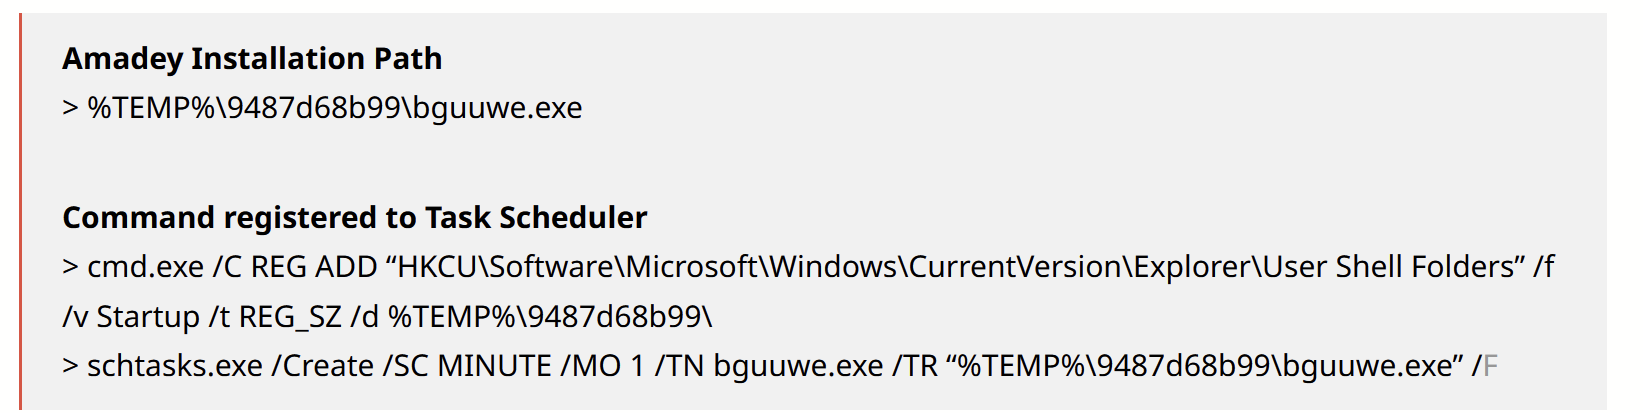
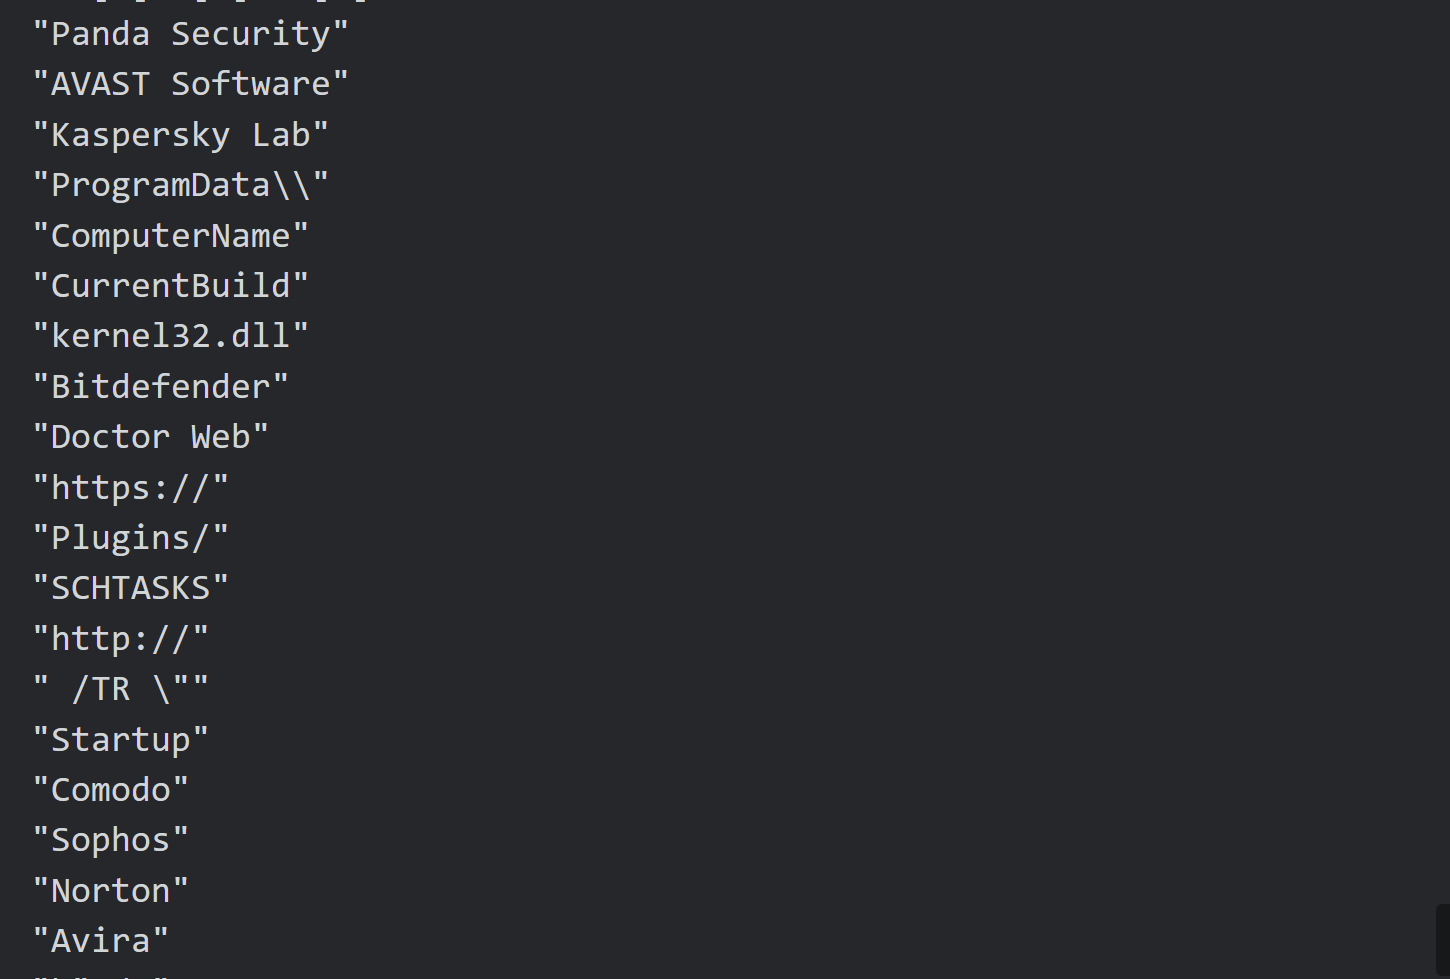
The Ahnsec Blog also references a list of AV products that are enumerated by Amadey Bot.
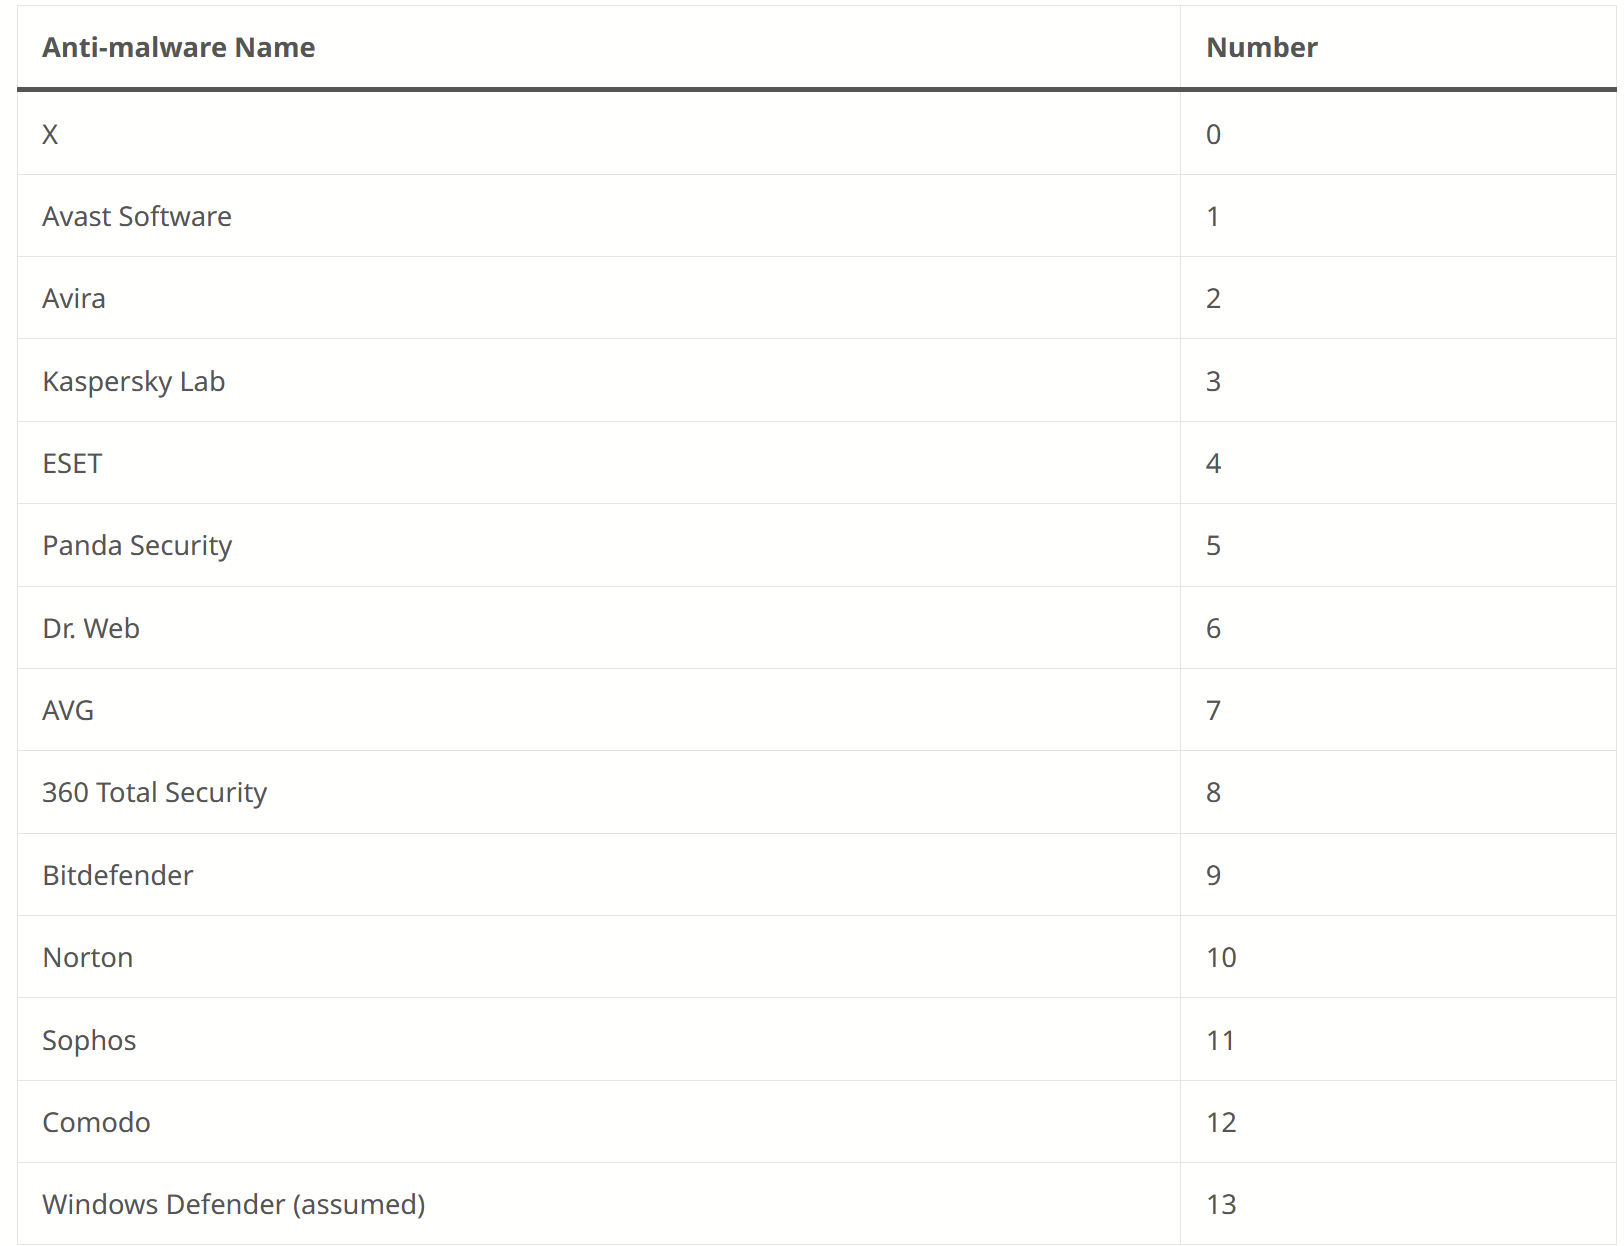
Coincidentally, almost all of those strings were contained in our sample
The Ahnsec blog also references specific parameters that are sent in POST requests made by Amadey Bot.
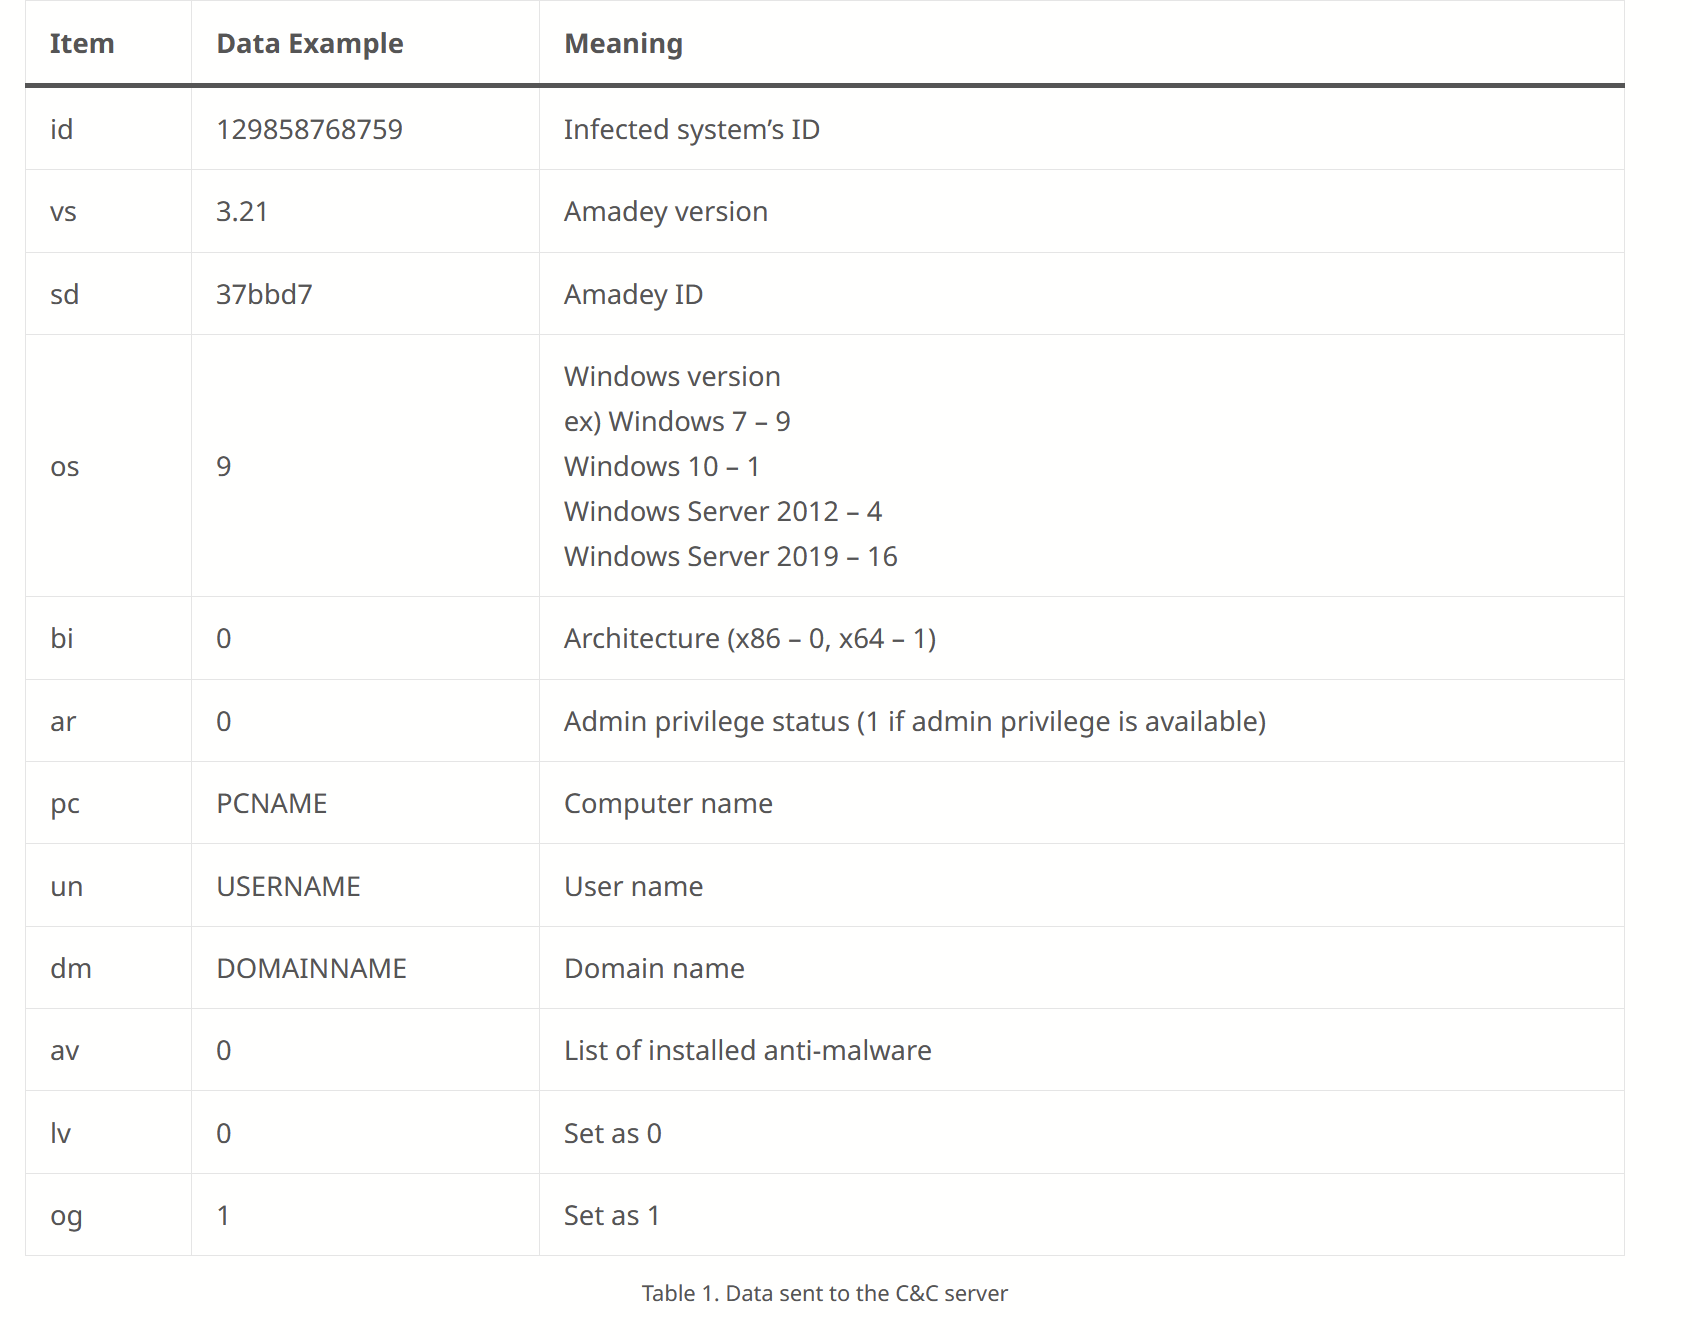
Coincidentally, almost all of those same fields (first column) are referenced in our decrypted strings.
Since POST request parameters are pretty specific - I was confident my sample was actually Amadey bot.
At this point, I also reviewed a second blog from Blackberry. Which confirmed much of the same analysis as AhnSec.
At this point, I was comfortable re-classifying the malware as Amadey bot.
(I also learned not to blindly follow tags from Malware Reps)
Conclusion and Recommendations
At this point, I'm going to conclude the analysis, as we have successfully located the C2 information and identified the malware family. In a real-life situation, this analysis could serve multiple purposes.
- Decrypted strings can be googled to aid in malware identification.
- Decrypted strings contain commands and process names that can be used for process-based hunting
- Decrypted Strings contain a URL structure that can used to hunt or develop detection rules for proxy logs.
- Decrypted Strings contain an IP that could be used to identify infected machines.
- Decrypted Strings can be used to enhance a Ghidra or IDA database - enhancing the decompiler output and leading to better RE analysis.
- Better automation could be used to make a config extractor - useful for a threat intel/analysis pipeline. (Replacing x32dbg with Dumpulator would be a great way to do this)
- + lots of fun :D
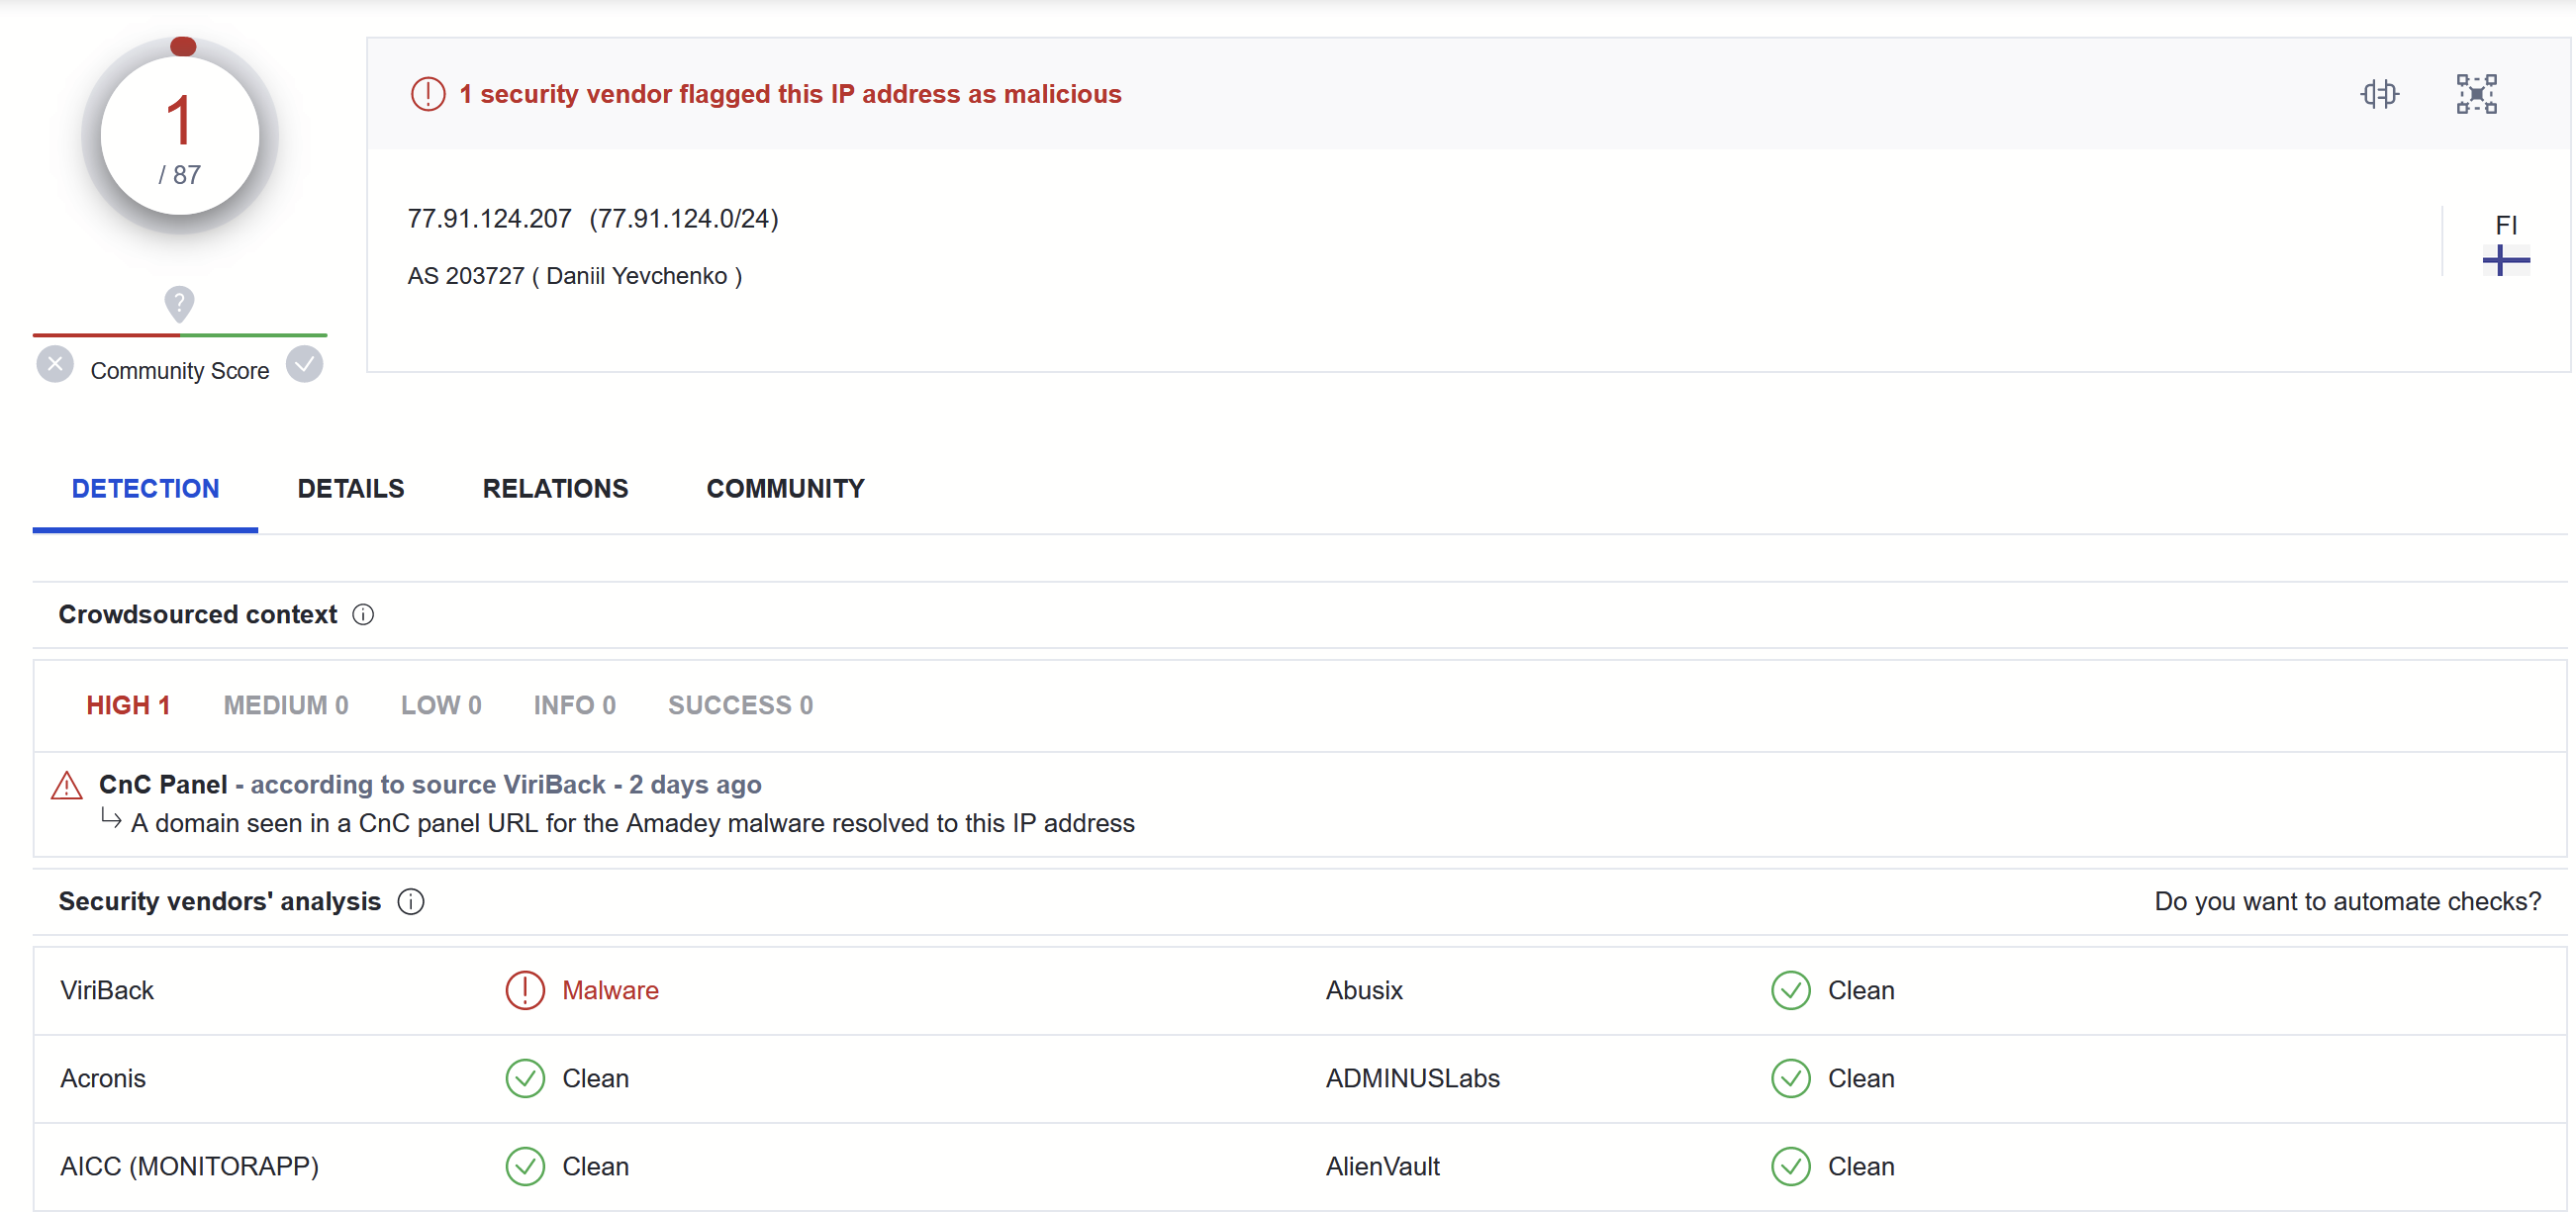
Virustotal
At the time of this analysis (2023/04/10) - There is only 1/87 detections for the C2 on Virustotal
Decoded Strings
A full list of strings obtained using the log function of x32dbg.
(Noting that these are in order of length and not location of occurrence.)
 &"SOFTWARE\\Microsoft\\Windows\\CurrentVersion\\Explorer\\User Shell Folders"
 &"SYSTEM\\CurrentControlSet\\Control\\ComputerName\\ComputerName"
 &"SOFTWARE\\Microsoft\\Windows NT\\CurrentVersion"
 &"abcdefghijklmnopqrstuvwxyz0123456789-_"
 &"/Create /SC MINUTE /MO 1 /TN "
 &"/plays/chapter/index.php"
 &"GetNativeSystemInfo"
 &"cred.dll|clip.dll|"
 "77[.]91[.]124[.]207"
 "Panda Security"
 "AVAST Software"
 "Kaspersky Lab"
 "ProgramData\\"
 "ComputerName"
 "CurrentBuild"
 "kernel32.dll"
 "Bitdefender"
 "Doctor Web"
 "https://"
 "Plugins/"
 "SCHTASKS"
 "http://"
 " /TR \""
 "Startup"
 "Comodo"
 "Sophos"
 "Norton"
 "Avira"
 "\" /F"
 L"\\¬="
 "POST"
 "&vs="
 "3.70"
 "&sd="
 "&os="
 "&bi="
 "&ar="
 "&pc="
 "&un="
 "&dm="
 "&av="
 "&lv="
 "&og="
 "ESET"
 "dll"
 "<c>"
 "id="
 "AVG"
 ???
Useful Links
- AhnSec Labs - Blog on Amadey Stealer
- Blackberry Blog - Amadey Bot Analysis
- Mandiant - Repo for Flare VM Install
- X32dbg Documentation - Conditional Breakpoints in X32dbg