Ghidra

The Ghidra User interface can be intimidating and complicated for users who are not familiar with the tool.
In this post, I'll go over some changes that I made in order to improve the usability of Ghidra and ensure a better analysis experience.
This is an expansion of a post that I previously made on Twitter.
How to Enable Dark Mode in Ghidra
Ghidra 10.3+ has a dark mode which significantly improves the readability of the tool.
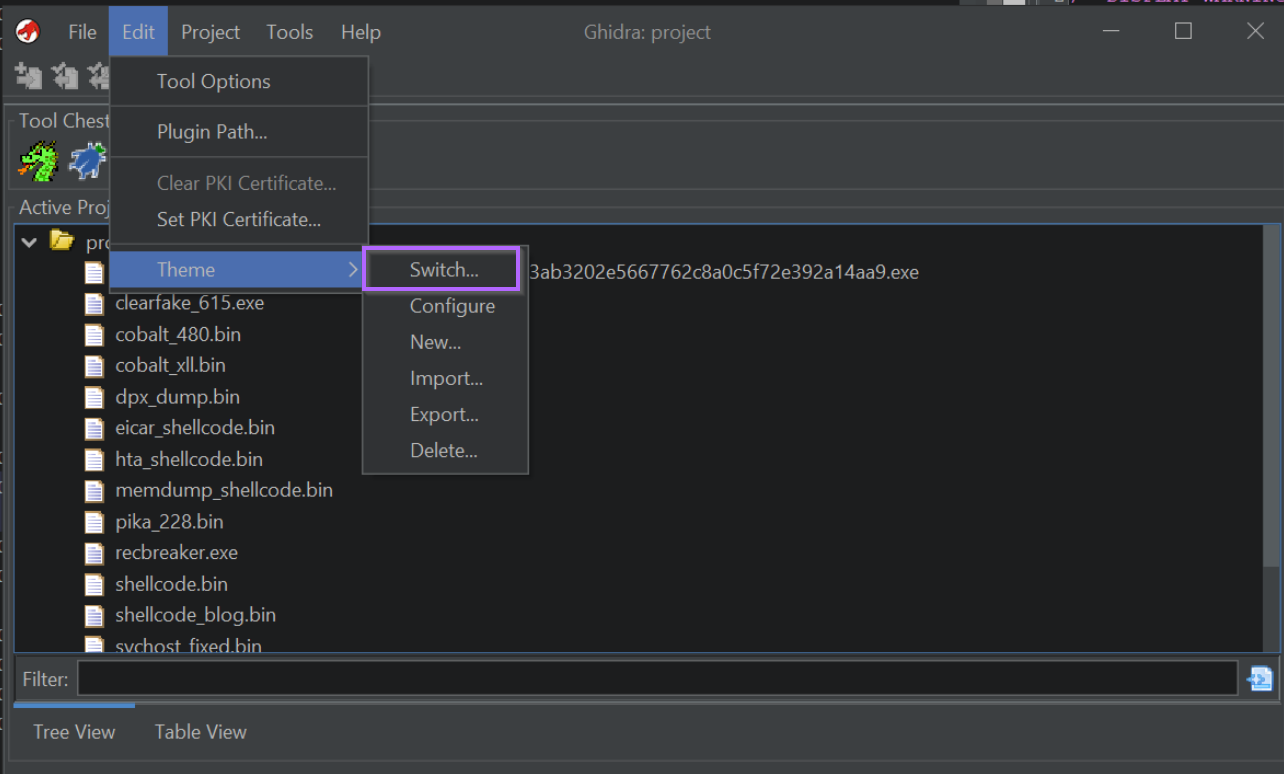
You can enable it from the initial project menu by selecting Edit -> Theme -> Switch -> Flat Dark Theme
How to Enable Cursor Text Highlighting In Ghidra
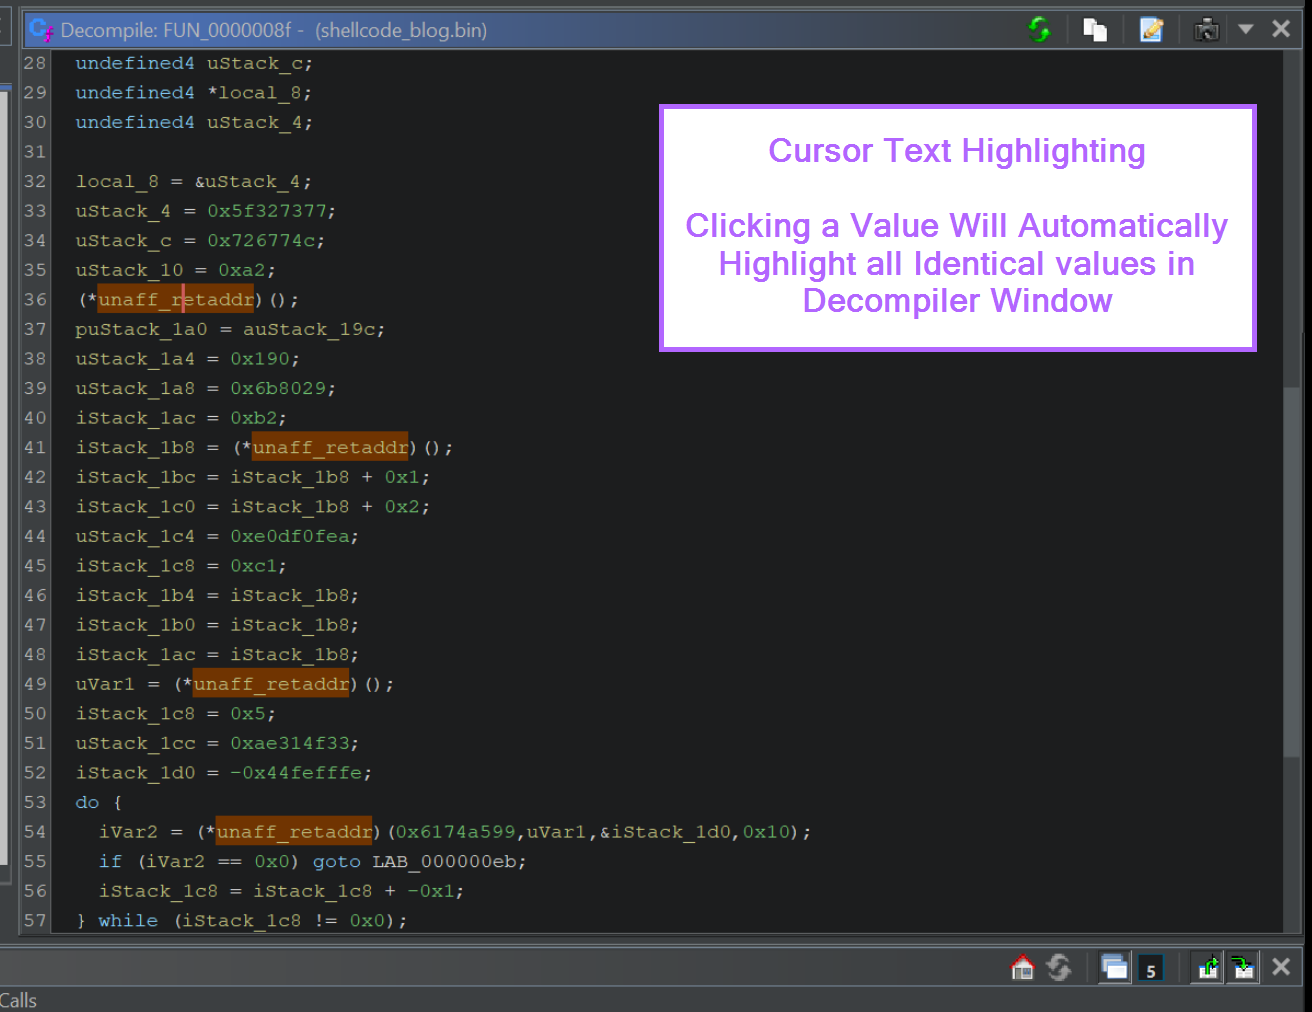
Cursor text highlighting will automatically highlight all identical values in the decompiler window. You can click on any value, and identical values will automatically be highlighted.
This is great for identifying usage of a variable or function within code.
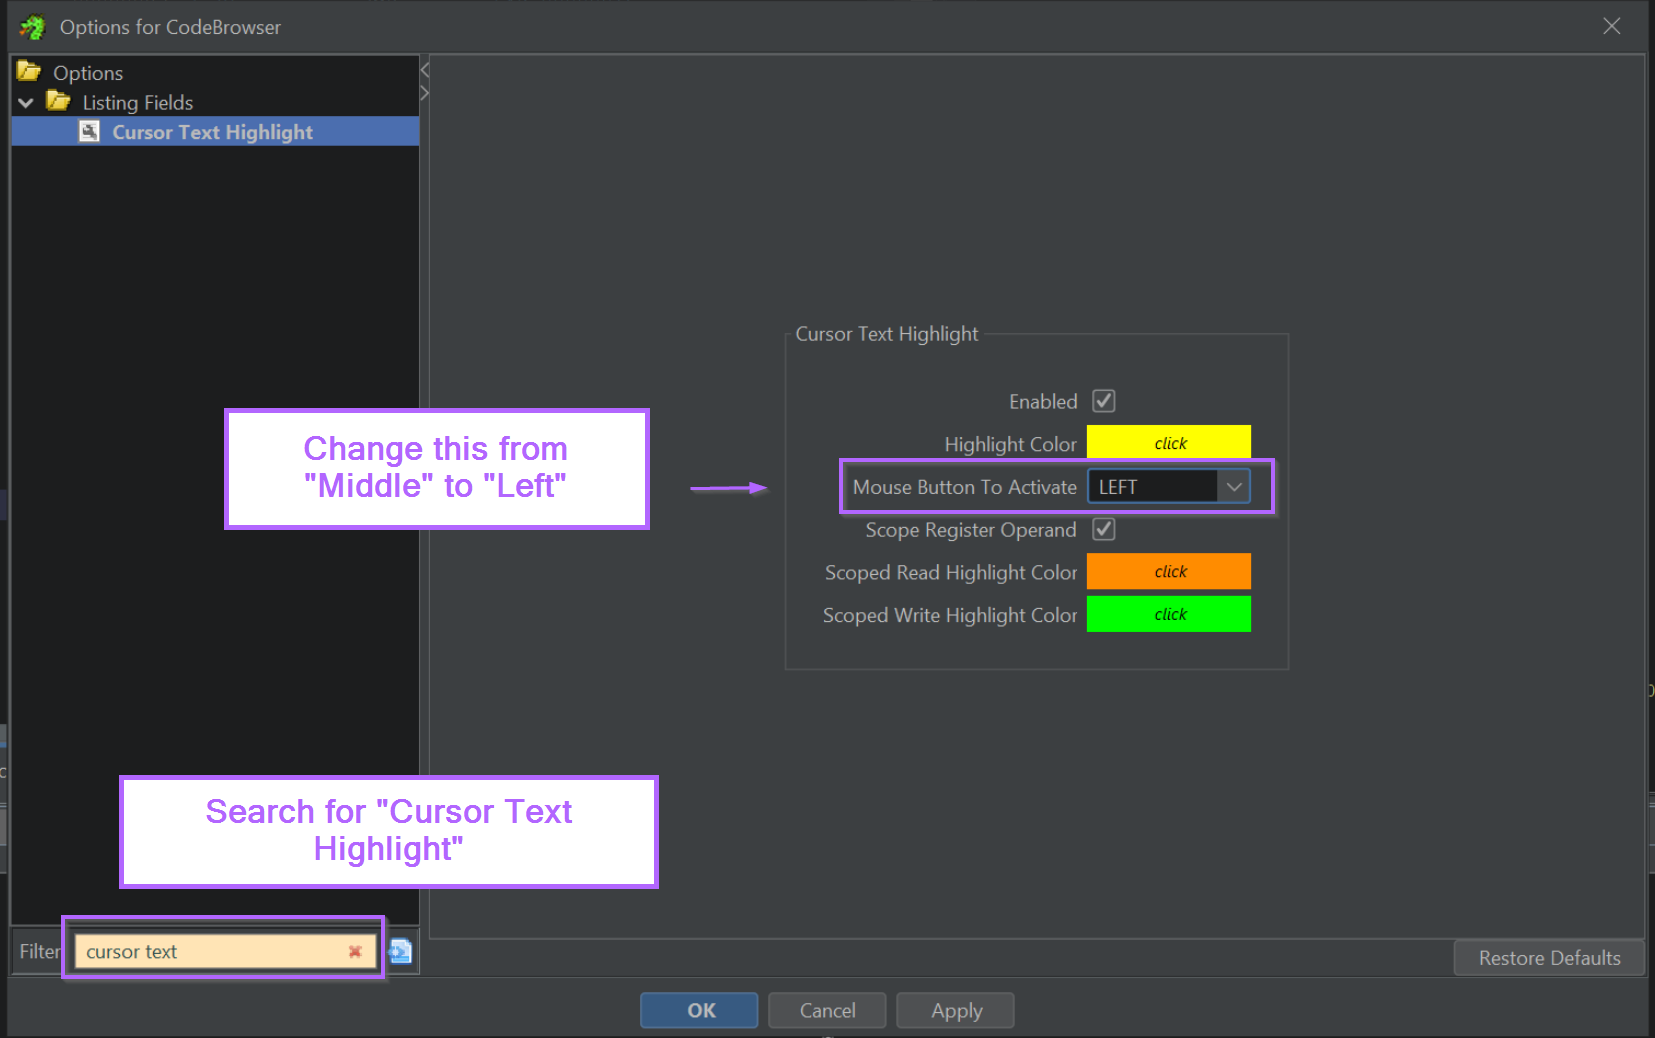
You can enable Cursor Text Highlighting with Edit -> Tool Options -> Listing Fields -> Cursor Text Highlight -> Mouse Button To Activate and setting the value to LEFT.
You can also go to Edit -> Tool Options and search directly for Cursor text
An Example of Cursor text highlighting can be seen below, where clicking on the unaff_retaddr value will automatically highlight all identical values.
Enabling Entropy View Window
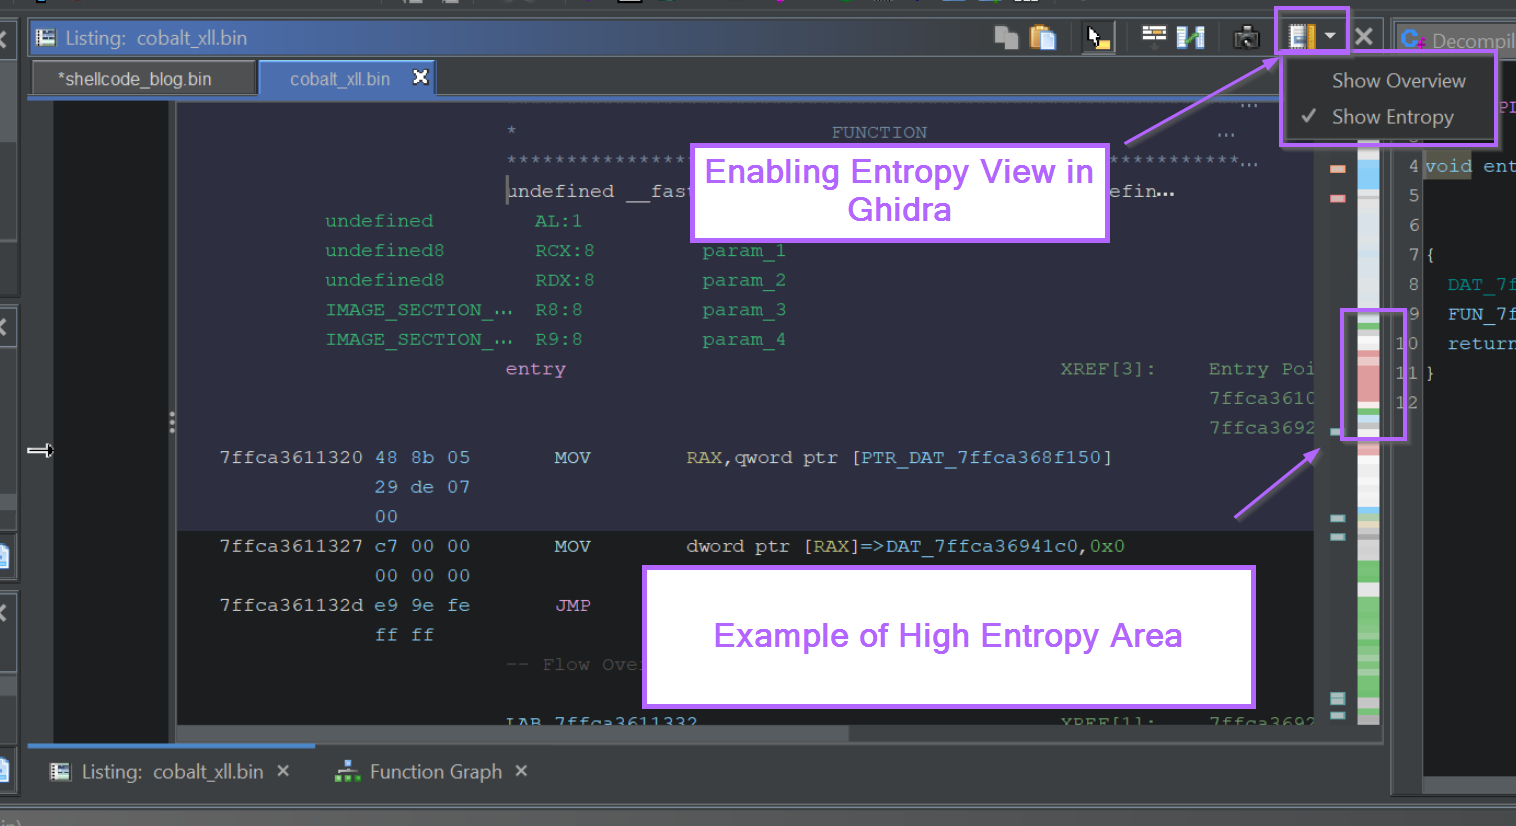
Ghidra has an entropy view which can enable you to hone in on high-entropy (generally encrypted) content. (I've shown an example of that here)
The entropy view can be enabled by browsing to the top right box within the listing view and selecting Show Entropy
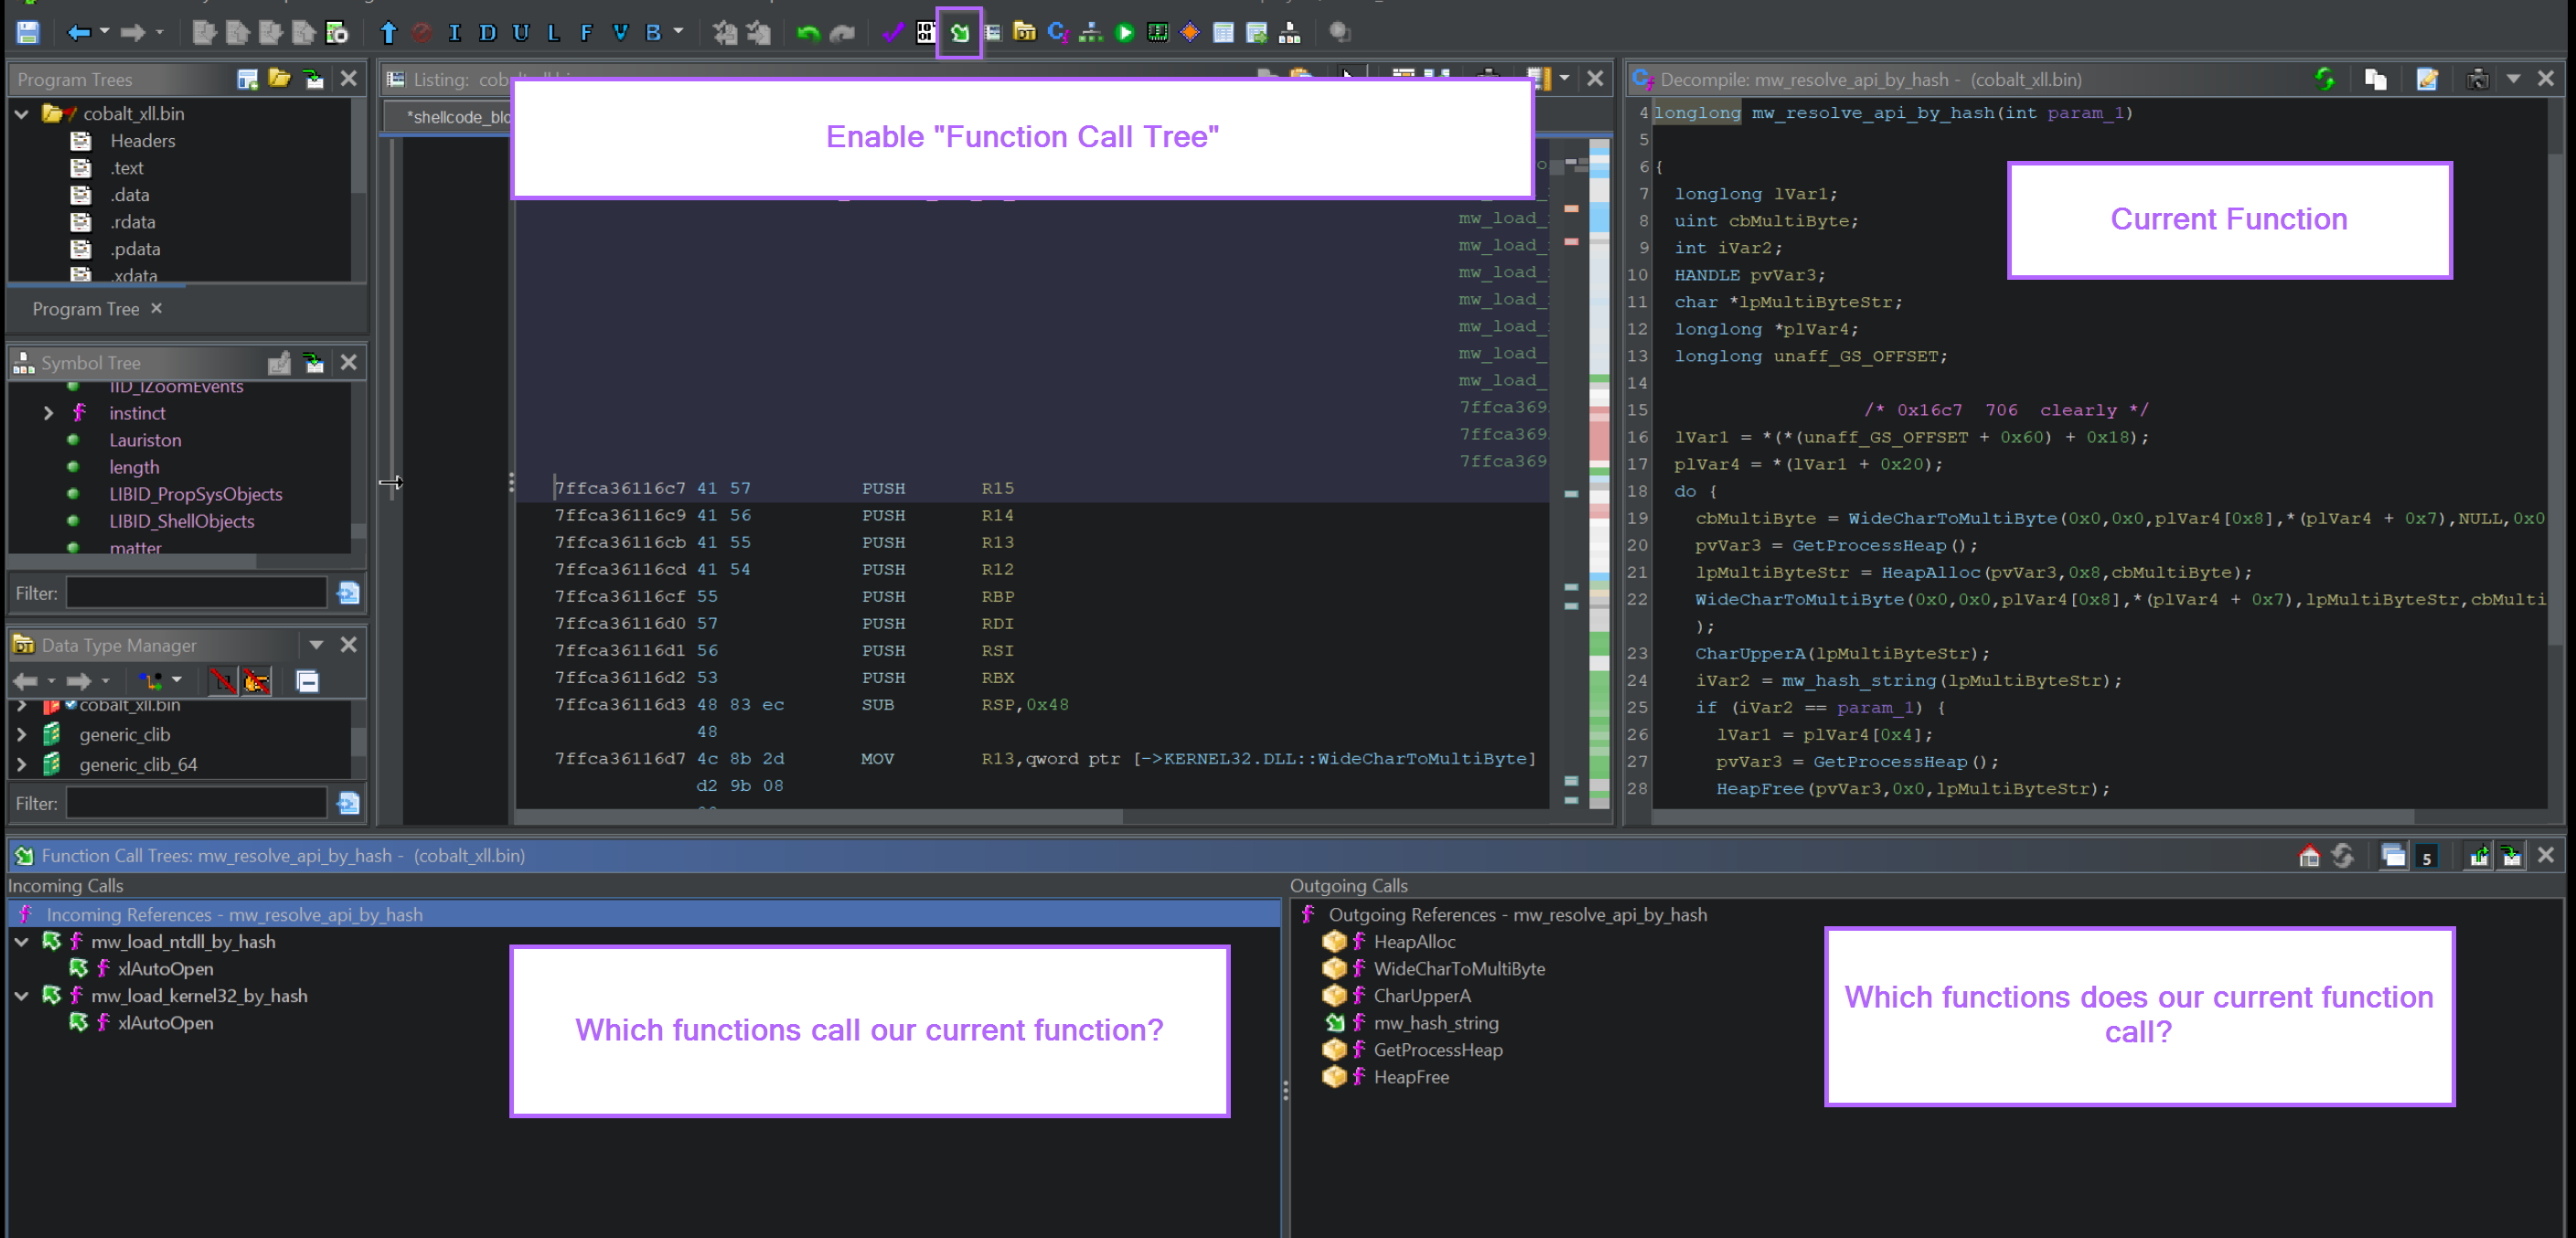
Enabling Function Call Tree in Ghidra
Ghidra has a feature called the "Function Call Tree" which enables you to see which functions are going "in" or "out" of whatever you're currently looking at.
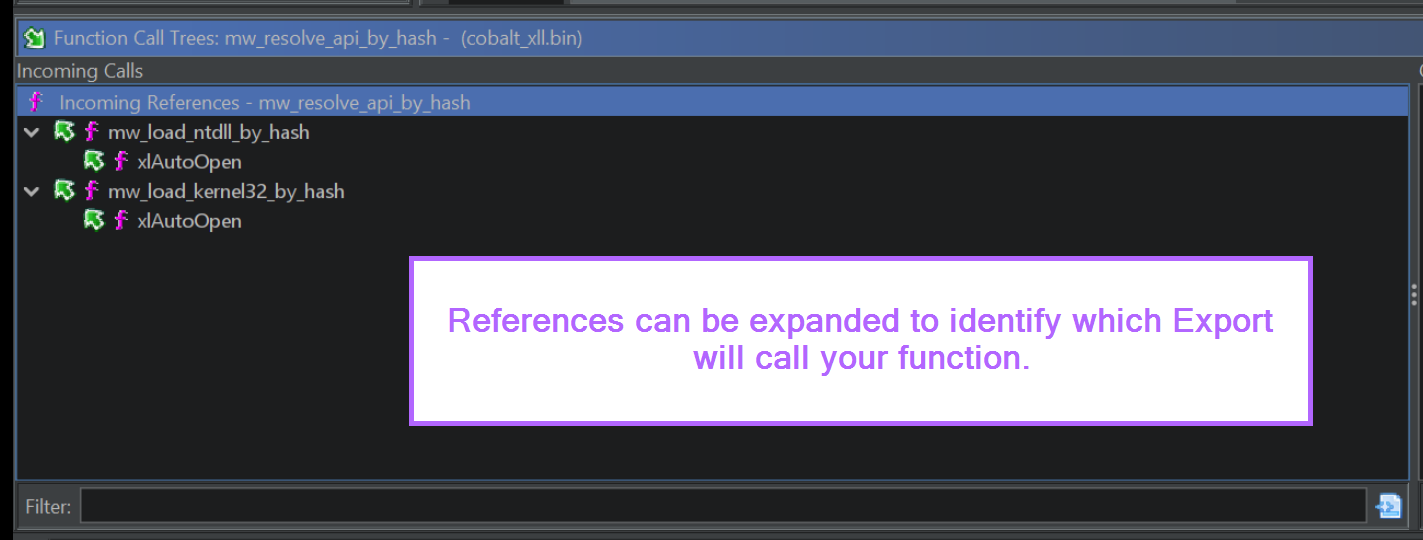
For a given function, this can be an easy way to see how often it's used, and to identify which Entry Point (or export) will call your function.
You can enable the Function Call Tree it by removing the default Scripting Window, and then clicking on the Green Arrow in the Top window.
(This is a feature that I used in Static analysis of Amadey bot, as well as during the identification of an API hashing function with AgentTesla )
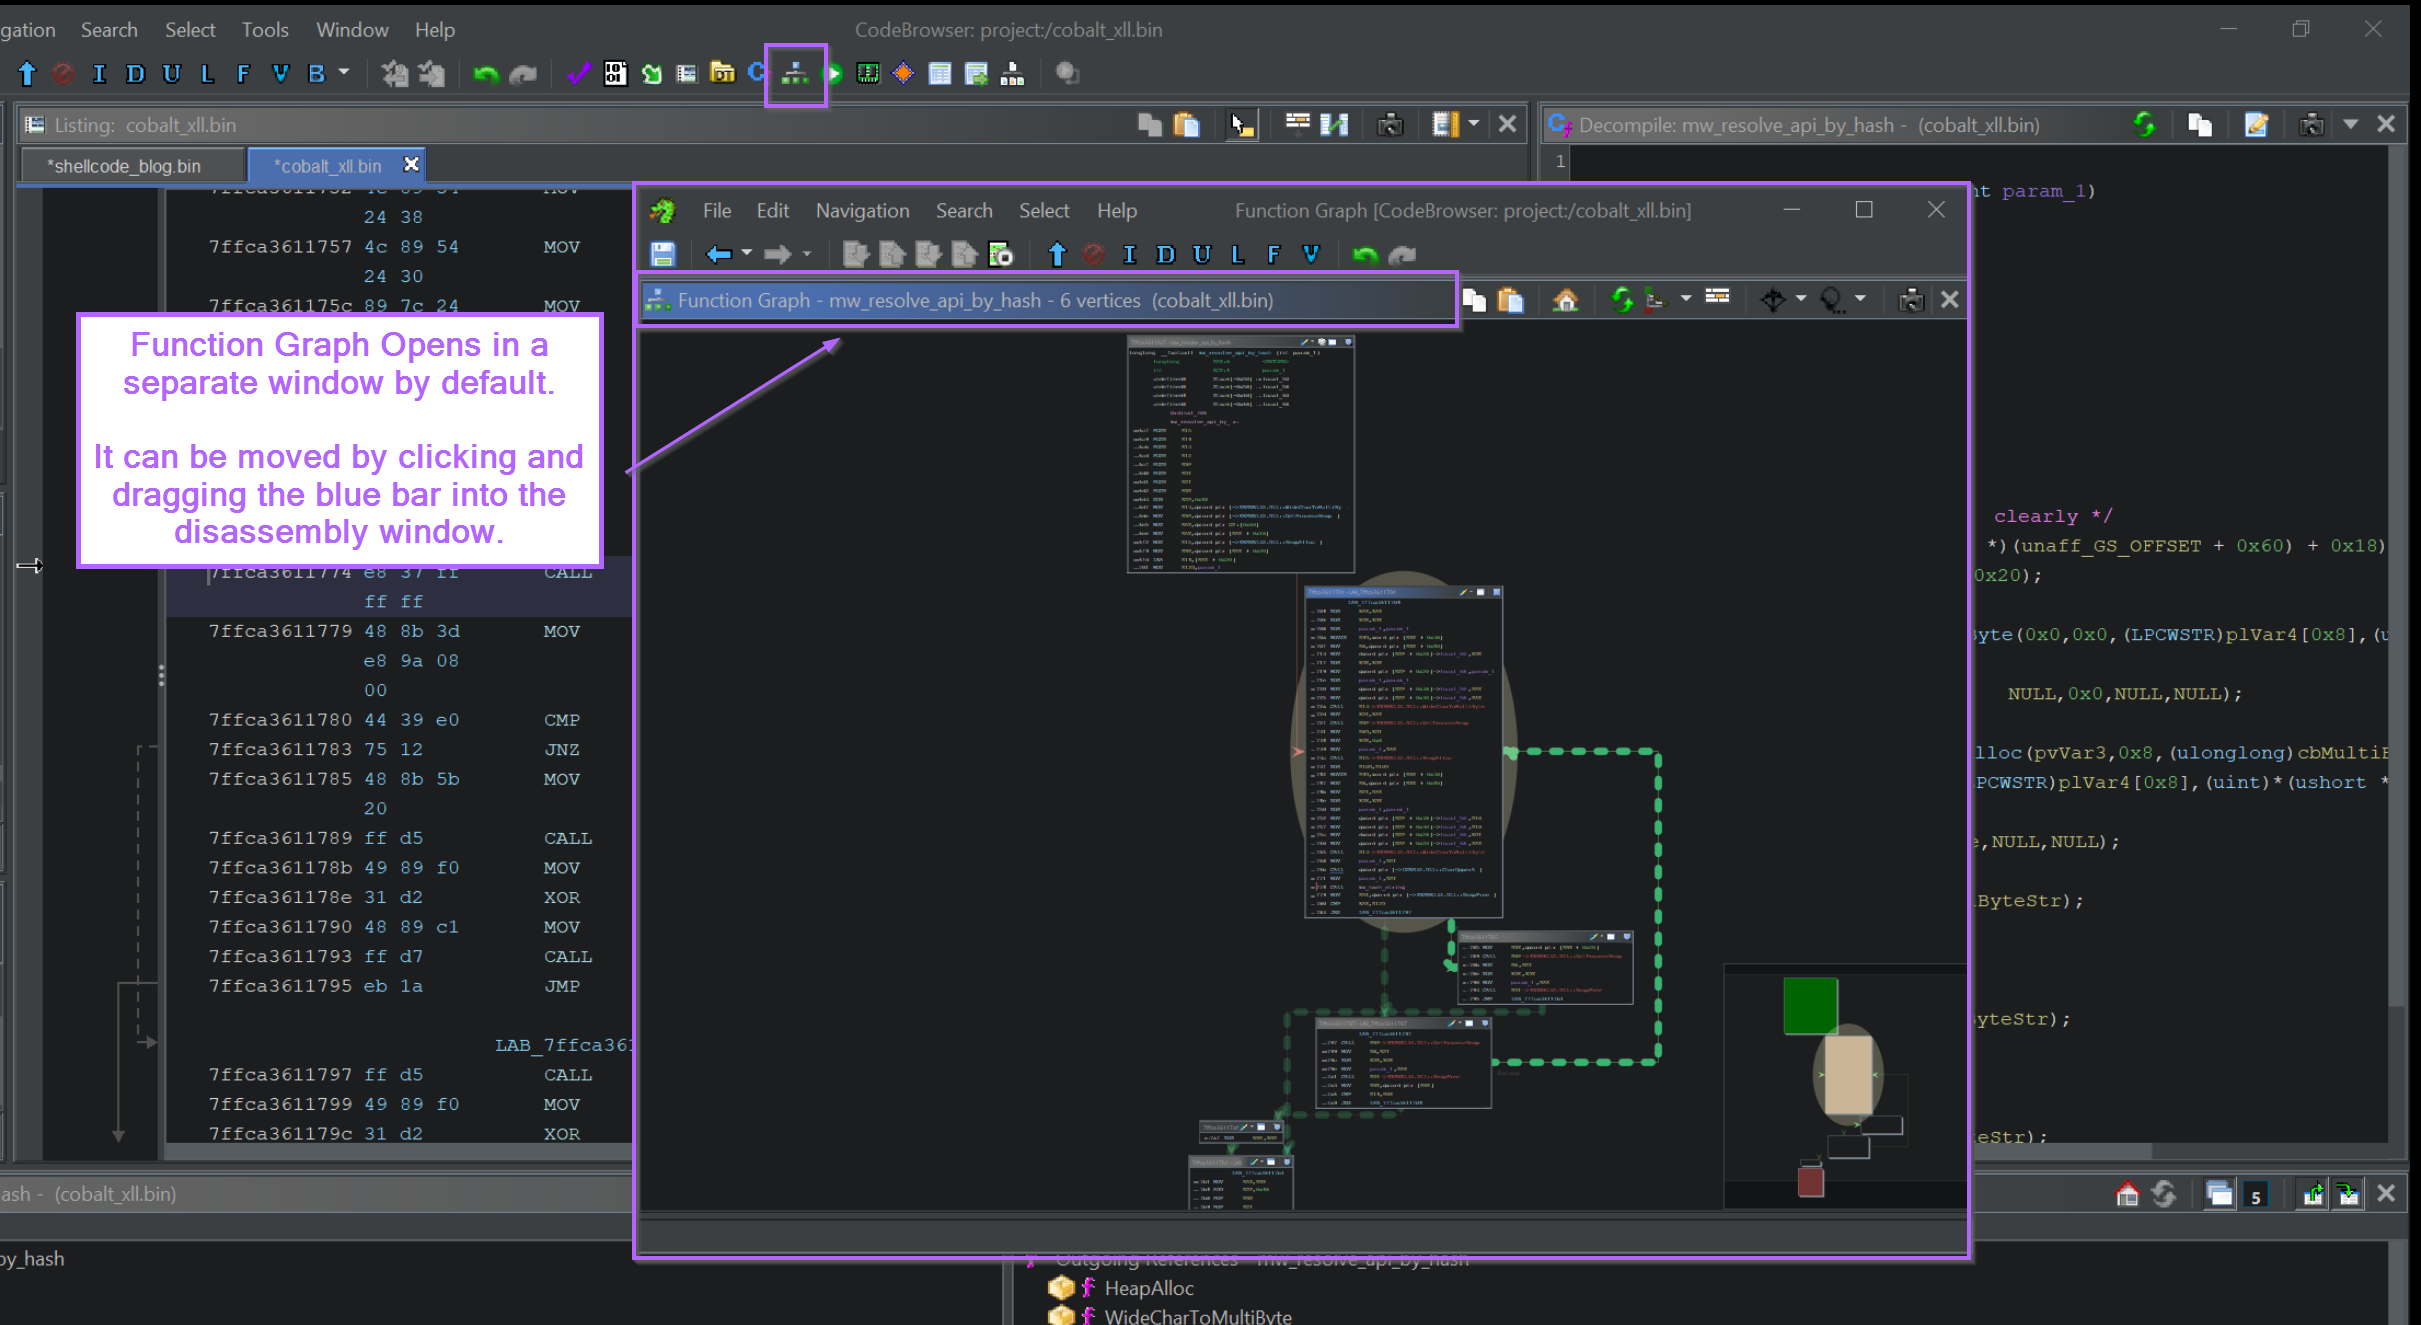
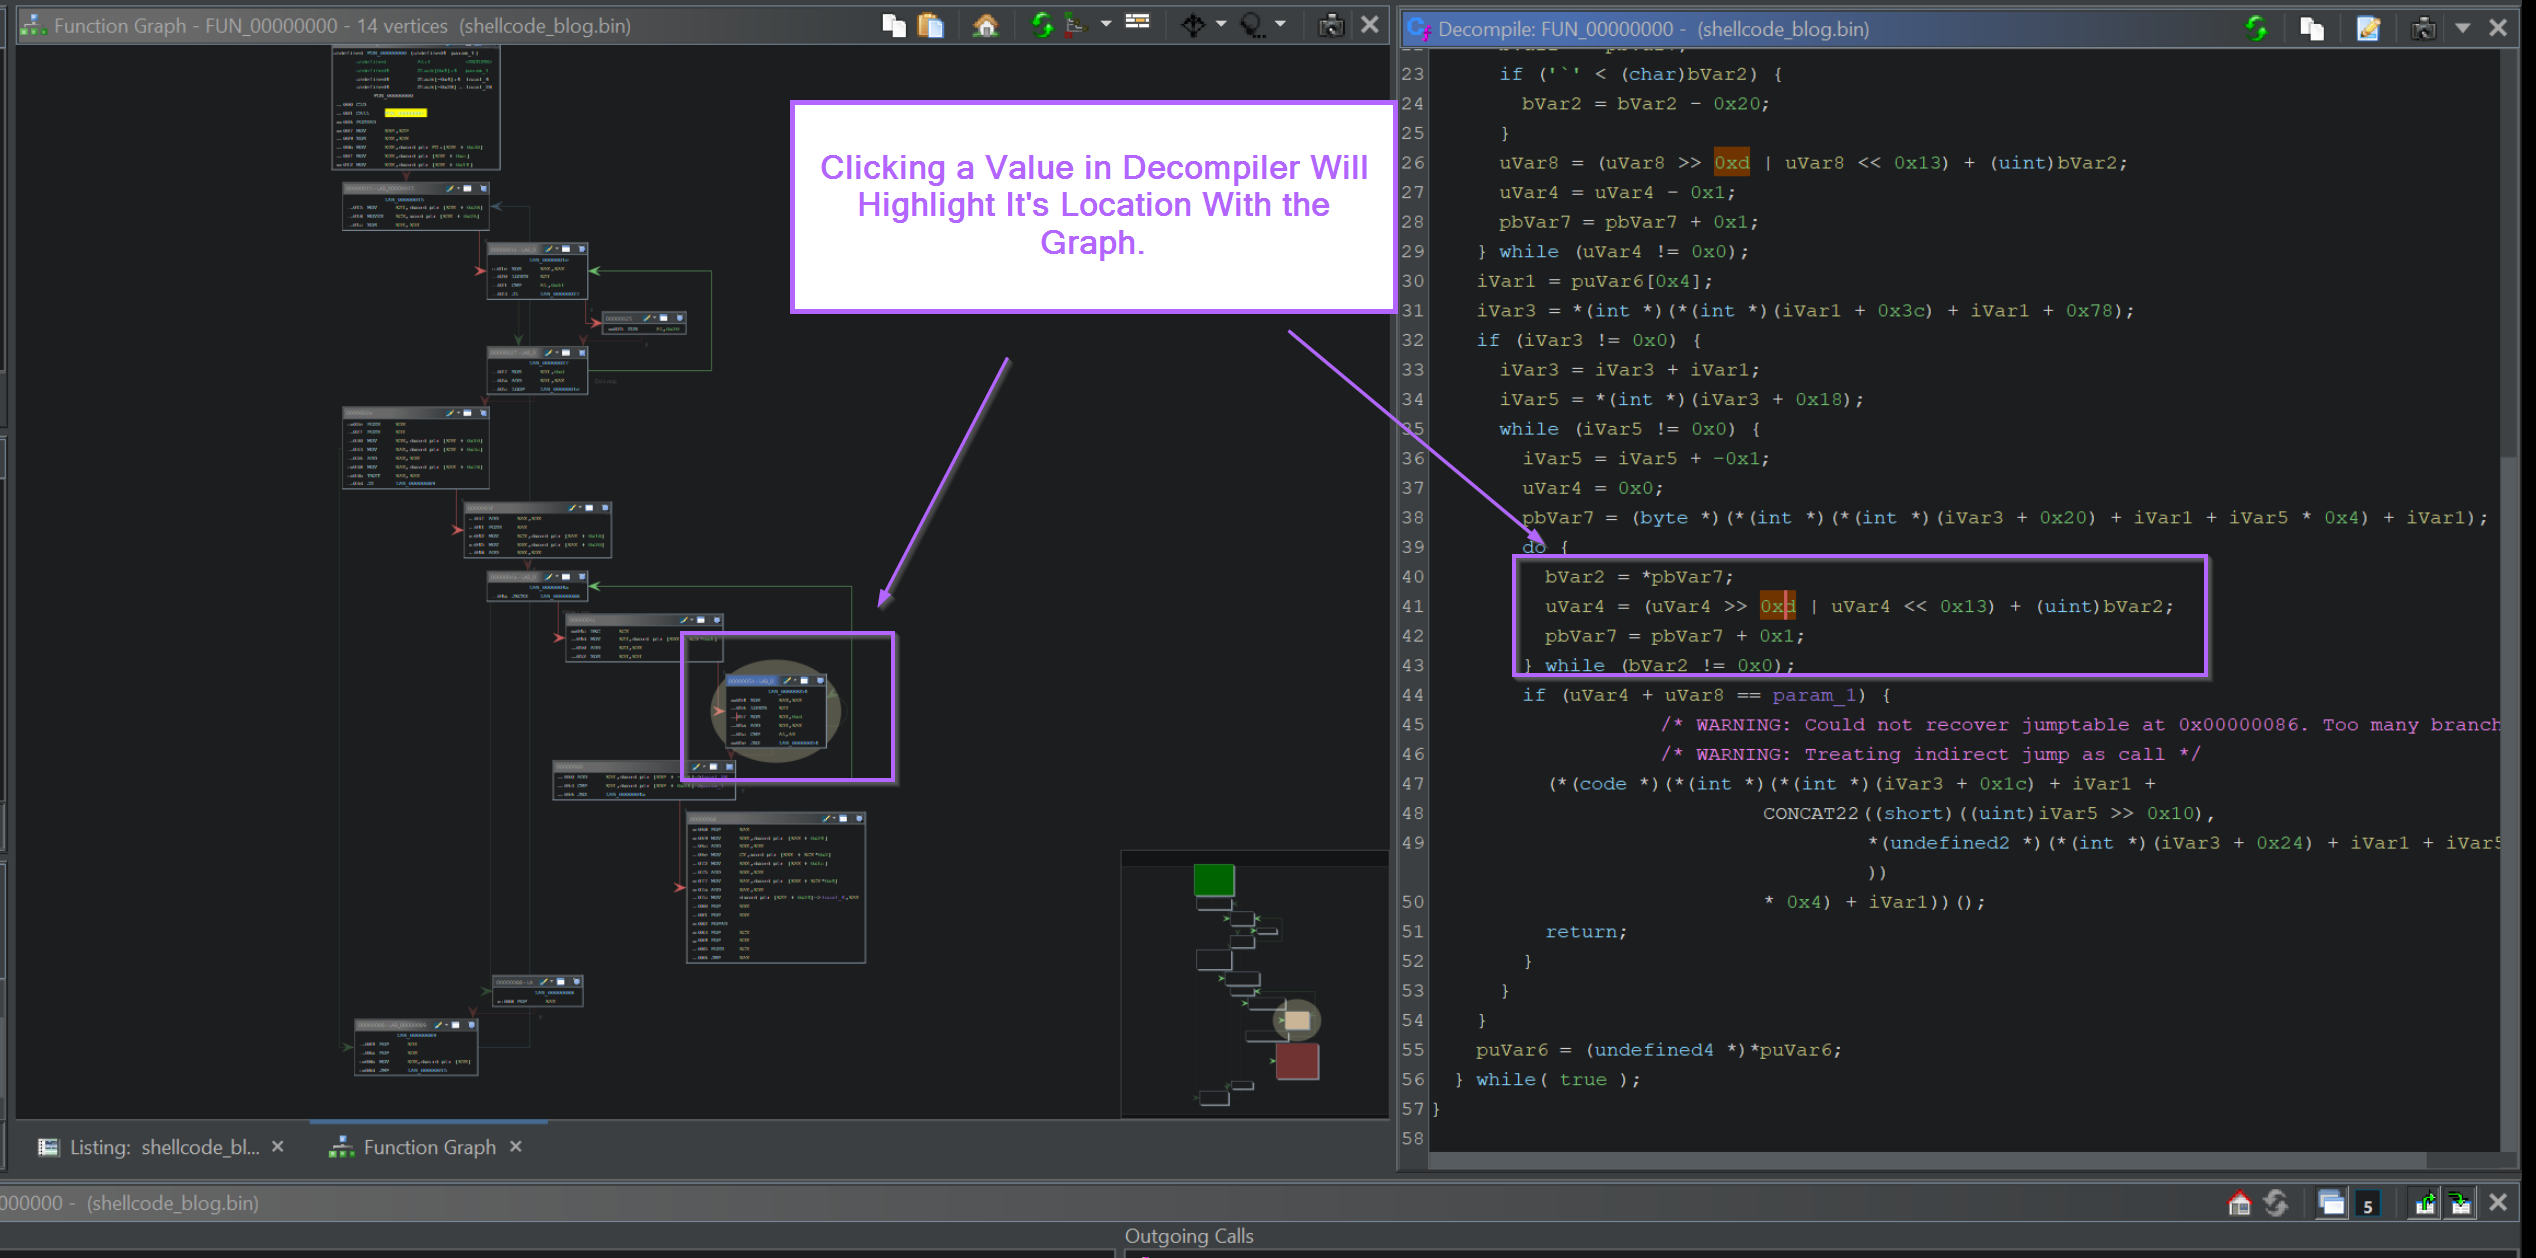
Enabling and Moving the Function Graph to Resemble IDA
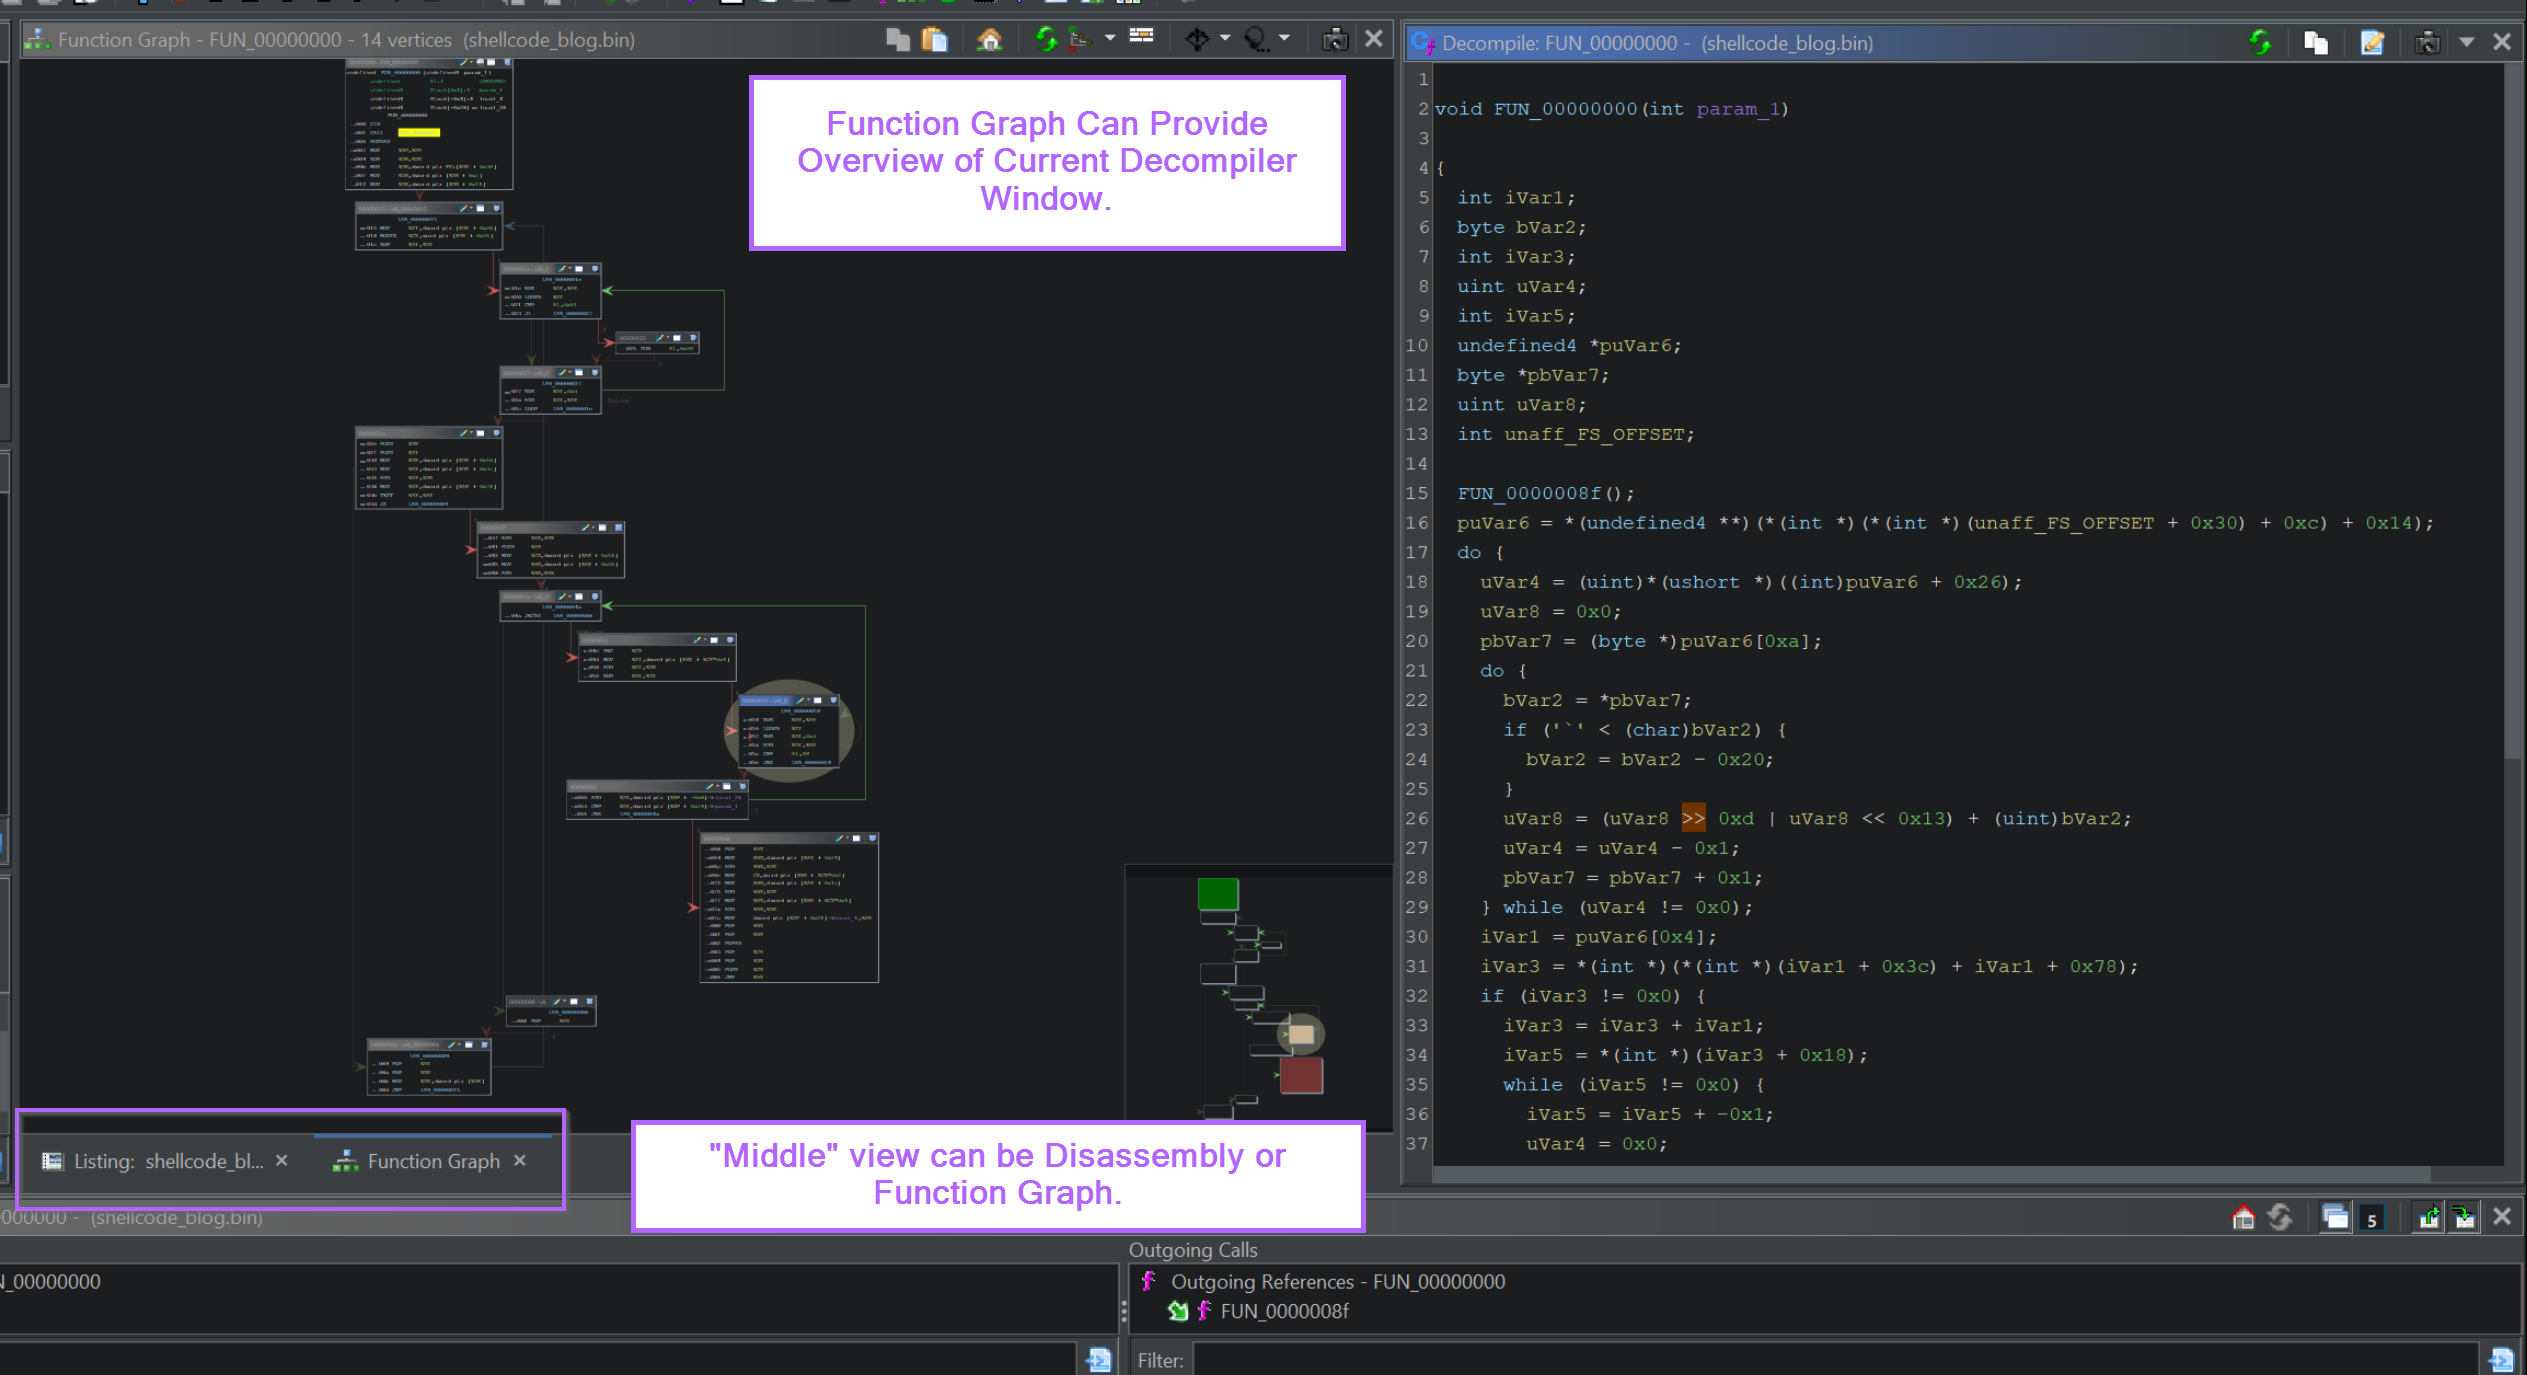
Ghidra by default has the listing (disassembly) window present in the middle of the screen. I often find it useful to be able to switch the middle screen between disassembly and the Function Graph.
By default, opening the function graph opens it in a separate window. This makes it hard for the Decompiler and Function Graph to stay in Sync.
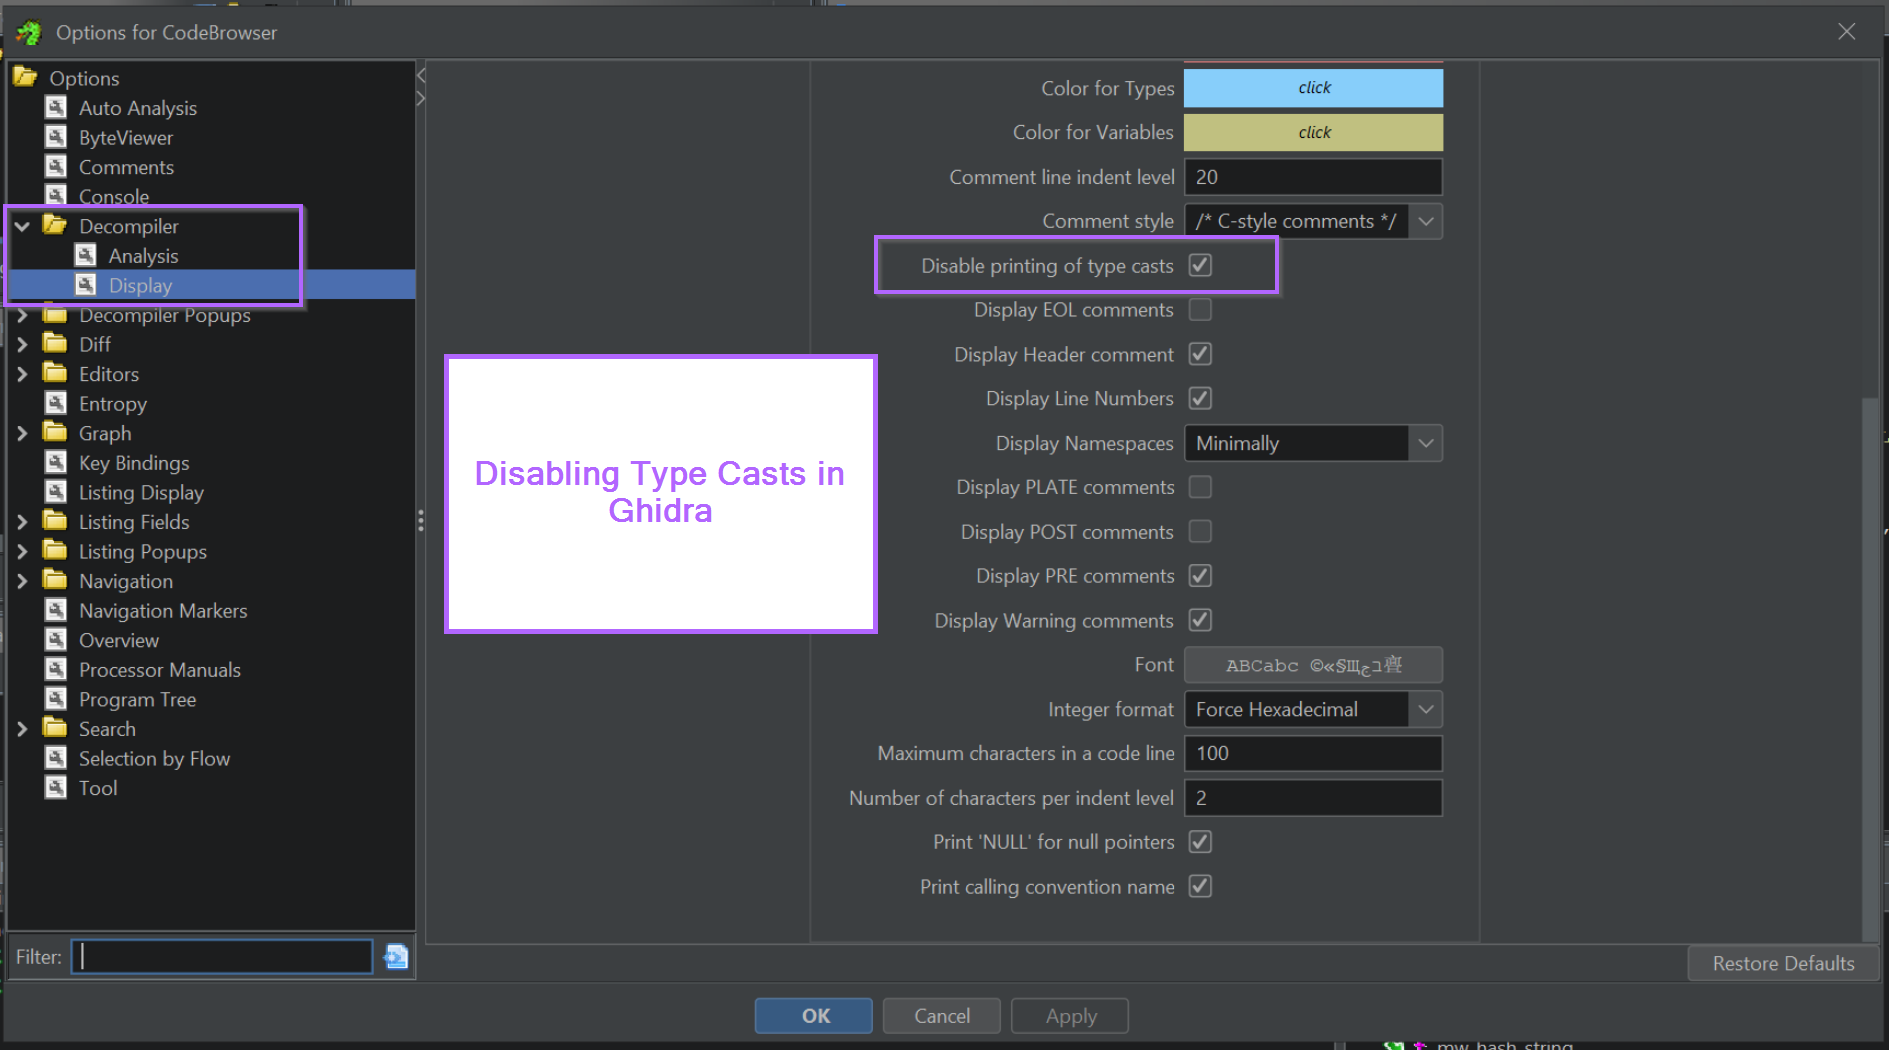
Disabling Type Casting In Ghidra
Ghidra displays all type casts by default in the Decompiler window. Although this is useful information, I believe it's overwhelming and unnecessary for new users to Ghidra and Malware Analysis/RE.
Those with a strong C programming background can skip this step, but for others I do believe it makes a better Ghidra experience.
Type Casts can be disabled with Tool Options -> Decompiler -> Display -> Disable Printing of Type Casts
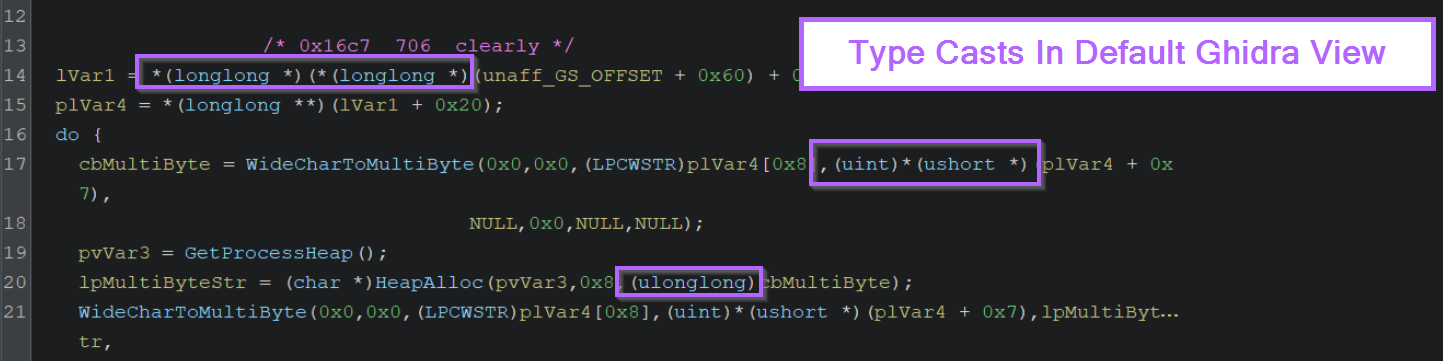
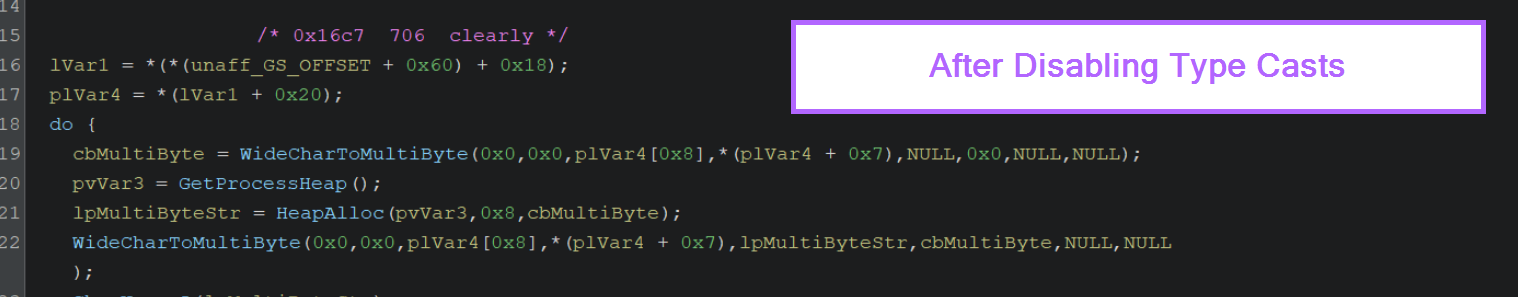
Type Casts can (and should) be re-enabled later once you're more comfortable with Ghidra.
This isn't a fantastic example of the benefits of disabling type casts, but it shows the difference between having it enabled and disabled.
Sign up for Embee Research
Malware Analysis and Threat Intelligence Research
No spam. Unsubscribe anytime.